| Param | Original file | Final file |
|---|---|---|
| Filename | modeM0/AS1A07_118T01_9000003232_21862cztM0_level2.evt | modeM0/AS1A07_118T01_9000003232_21862cztM0_level2_quad_clean.evt |
| Size (bytes) | 662,509,440 | 92,592,000 |
| Size | 631.8 MB | 88.3 MB |
| Events in quadrant A | 4,092,385 | 557,439 |
| Events in quadrant B | 4,457,979 | 568,798 |
| Events in quadrant C | 4,141,435 | 556,309 |
| Events in quadrant D | 6,804,094 | 539,102 |
| Mode SS | |||
|---|---|---|---|
| Quadrant | BADHDUFLAG | Total packets | Discarded packets |
| A | 0 | 170 | 0 |
| B | 0 | 170 | 0 |
| C | 0 | 170 | 0 |
| D | 0 | 170 | 0 |
| Mode M9 | |||
|---|---|---|---|
| Quadrant | BADHDUFLAG | Total packets | Discarded packets |
| A | 0 | 4 | 0 |
| B | 0 | 4 | 0 |
| C | 0 | 4 | 0 |
| D | 0 | 4 | 0 |
| Mode M0 | |||
|---|---|---|---|
| Quadrant | BADHDUFLAG | Total packets | Discarded packets |
| A | 0 | 17718 | 1 |
| B | 0 | 18554 | 1 |
| C | 0 | 17676 | 1 |
| D | 0 | 25796 | 3 |
| Quadrant | Total seconds | Saturated seconds | Saturation percentage |
|---|---|---|---|
| A | 8374 | 287 | 3.427275% |
| B | 8374 | 397 | 4.740865% |
| C | 8374 | 345 | 4.119895% |
| D | 8373 | 1299 | 15.514153% |
Noise dominated data is calculated using 1-second bins in cleaned event files. If a bin has >2000 counts, and if more than 50% of those come from <1% of pixels, then it is considered to be noise-dominated and hence unusable.
| Quadrant | # 1 sec bins | Bins with >0 counts | Bins with >2000 counts | High rate bins dominated by noise | Noise dominated (total time) | Noise dominated (detector-on time) | Marked lightcurve |
|---|---|---|---|---|---|---|---|
| A | 8804 | 8374 | 0 | 0 | 0.00% | 0.00% | 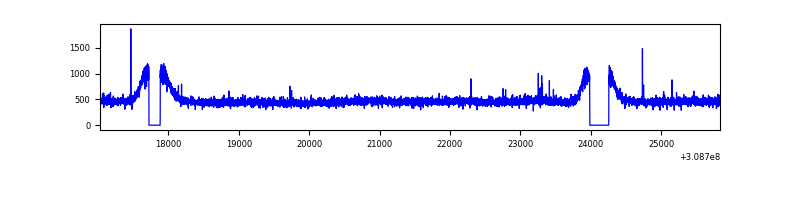 |
| B | 8804 | 8375 | 43 | 43 | 0.49% | 0.51% | 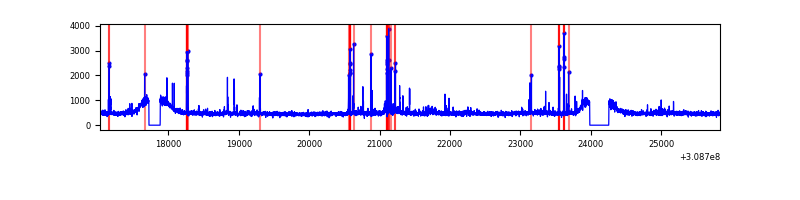 |
| C | 8804 | 8374 | 0 | 0 | 0.00% | 0.00% |  |
| D | 8803 | 8374 | 868 | 868 | 9.86% | 10.37% | 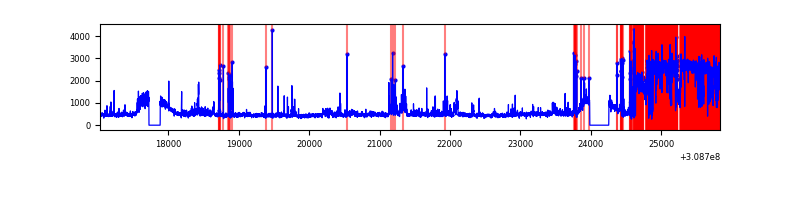 |
Top three noisy pixels from each quadrant. If the there are fewer than three noisy pixels in the level2.evt file, extra rows are filled as -1
| Pixel properties | Quadrant properties | ||||||
|---|---|---|---|---|---|---|---|
| Quadrant | DetID | PixID | Counts | Sigma | Mean | Median | Sigma |
| A | 13 | 254 | 15147 | 65.64 | 1055 | 1031 | 215.0 |
| A | 5 | 16 | 14144 | 60.98 | 1055 | 1031 | 215.0 |
| A | 3 | 137 | 9304 | 38.47 | 1055 | 1031 | 215.0 |
| B | 3 | 64 | 197341 | 942.57 | 1058 | 1028 | 208.3 |
| B | 0 | 230 | 43709 | 204.93 | 1058 | 1028 | 208.3 |
| B | 0 | 190 | 26689 | 123.21 | 1058 | 1028 | 208.3 |
| C | 14 | 238 | 154945 | 635.42 | 1018 | 1024 | 242.2 |
| C | 8 | 128 | 12803 | 48.63 | 1018 | 1024 | 242.2 |
| C | 13 | 61 | 7023 | 24.77 | 1018 | 1024 | 242.2 |
| D | 1 | 52 | 2803750 | 11793.92 | 955 | 927 | 237.6 |
| D | 12 | 227 | 126363 | 527.82 | 955 | 927 | 237.6 |
| D | 2 | 16 | 103615 | 432.1 | 955 | 927 | 237.6 |
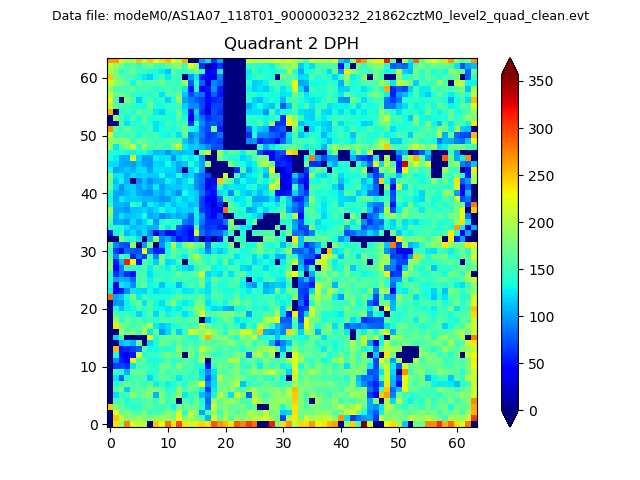
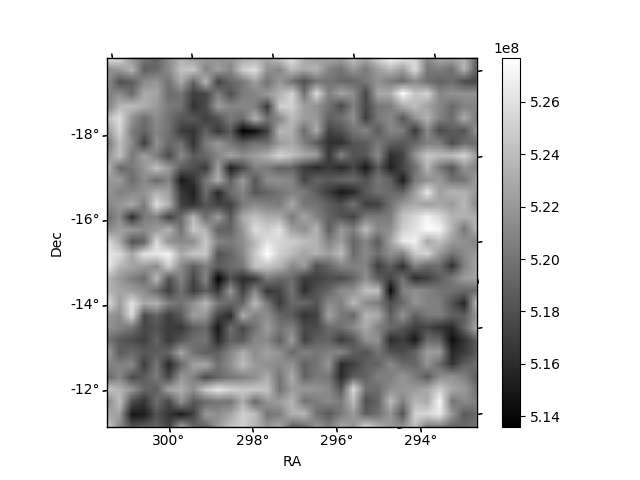
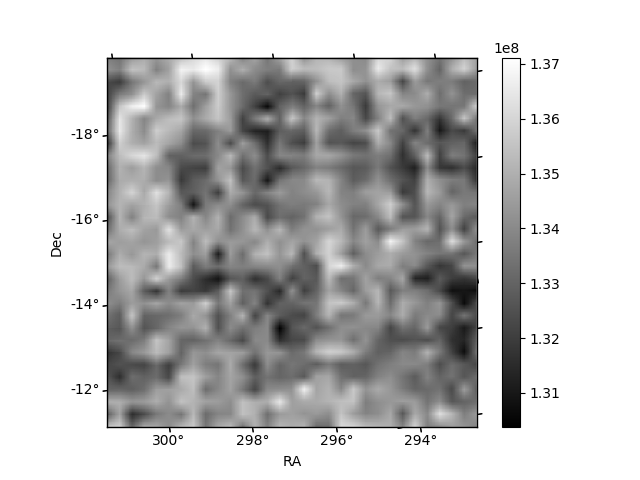
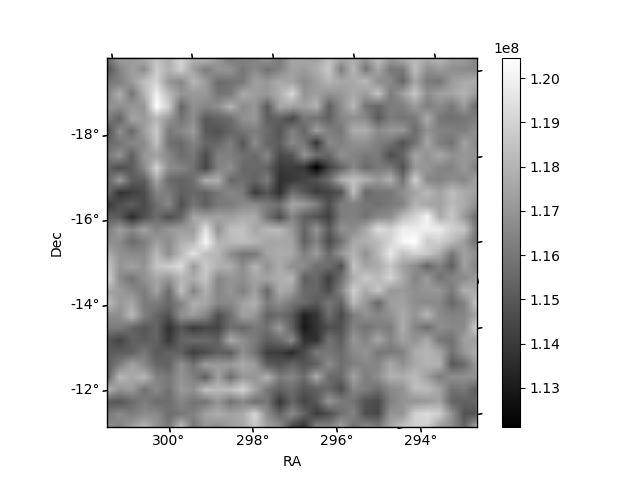
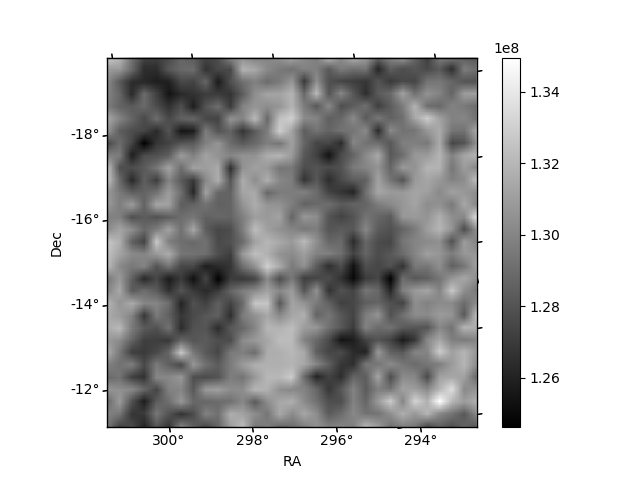
Histogram calculated using DETX and DETY for each event in the final _common_clean file
| Quadrant A | 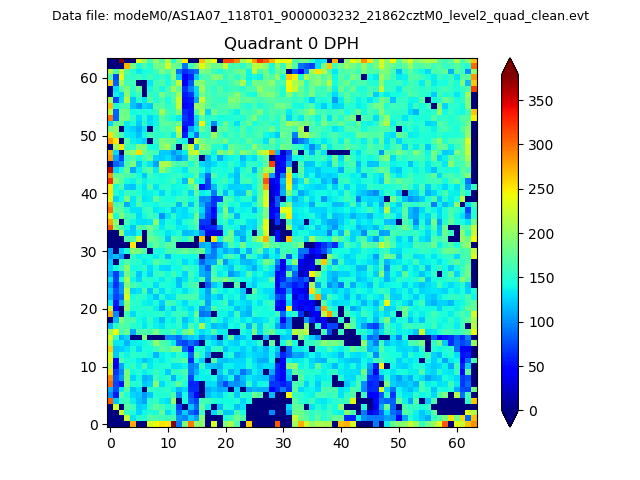 |
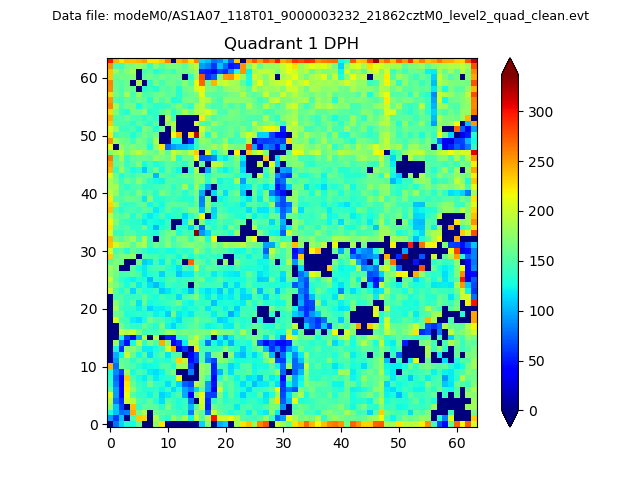 |
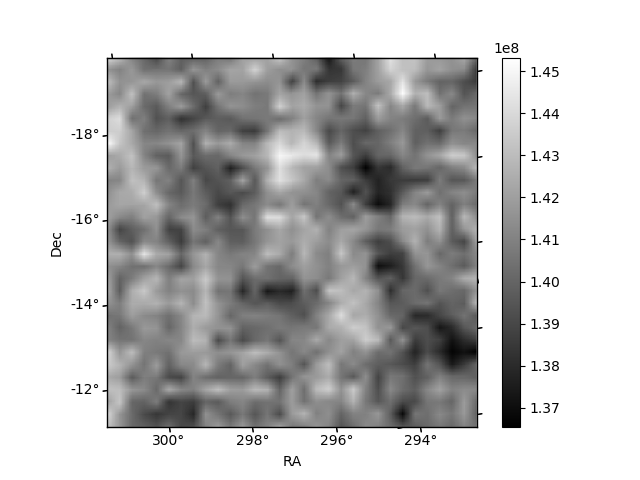
Quadrant B |
|---|---|---|---|
| Quadrant D | 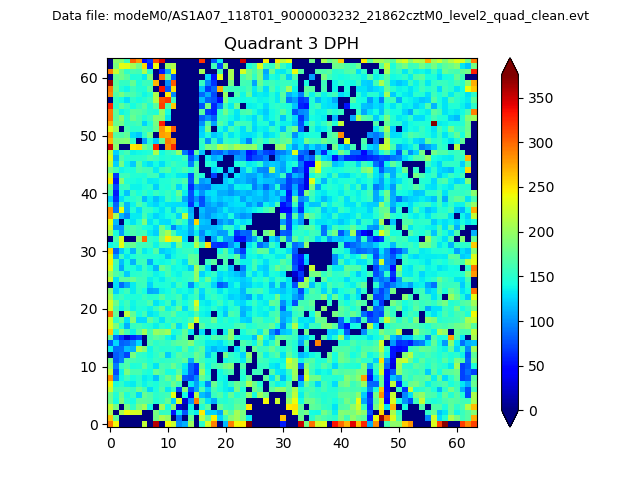 |
 |
Quadrant C |
| Plot type | Count rate plots | Images |
|---|---|---|
| Comparison with Poisson distribution Blue bars denote a histogram of data divided into 1 sec bins. Red curve is a Poisson curve with rate = median count rate of data. |
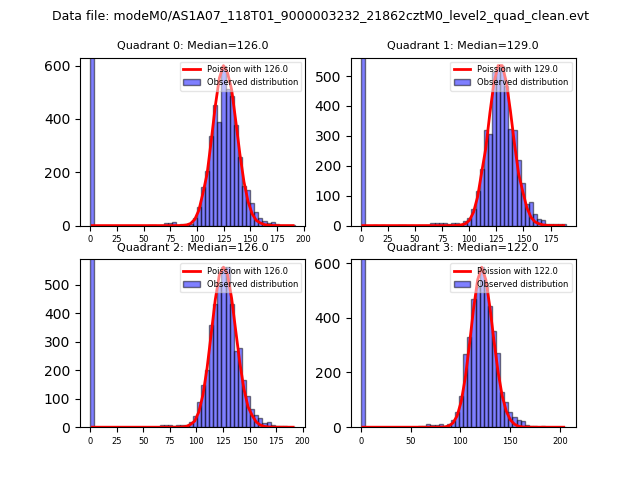 |
 |
| Quadrant-wise count rates Data is divided into 100 sec bins |
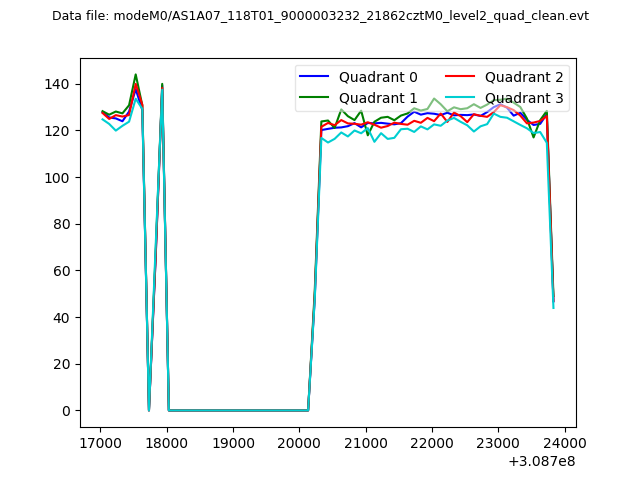 |
|
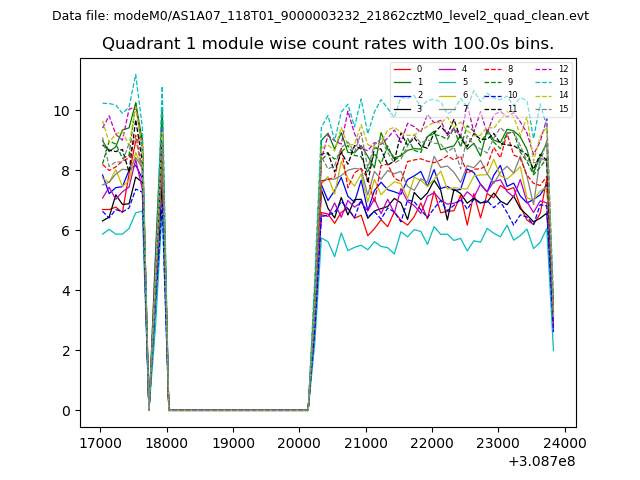
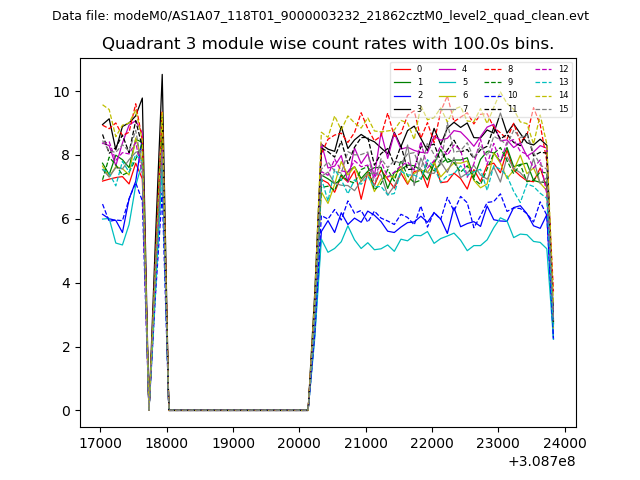
| Module-wise count rates for Quadrant A Data is divided into 100 sec bins |
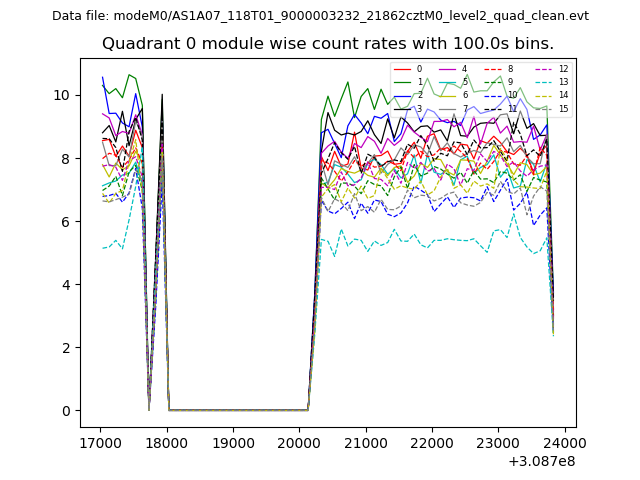 |
 |
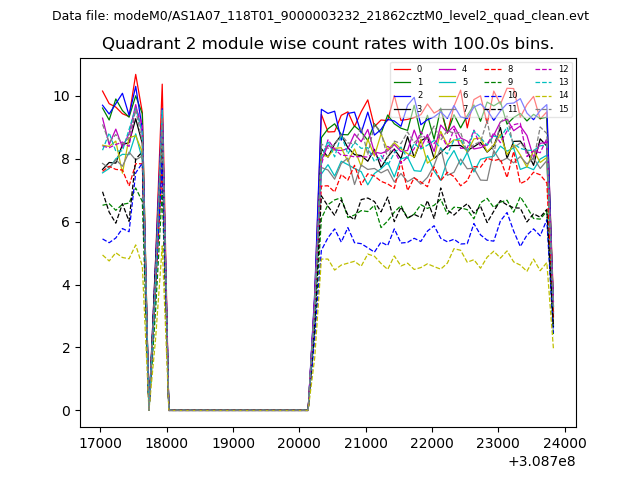
| Module-wise count rates for Quadrant B Data is divided into 100 sec bins |
 |
 |
| Module-wise count rates for Quadrant C Data is divided into 100 sec bins |
 |
 |
| Module-wise count rates for Quadrant D Data is divided into 100 sec bins |
 |
 |
| Parameter | Plot |
|---|---|
| CZT HV Monitor | 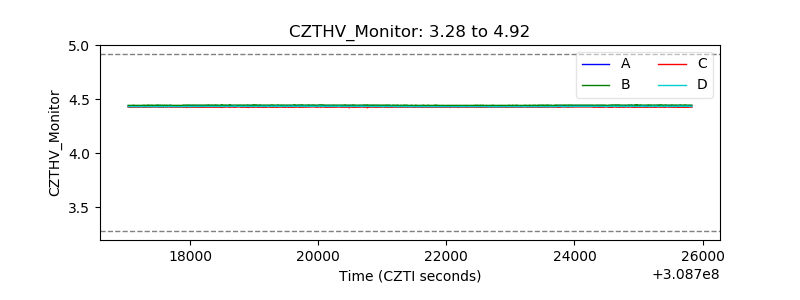 |
| D_VDD |  |
| Temperature 1 | 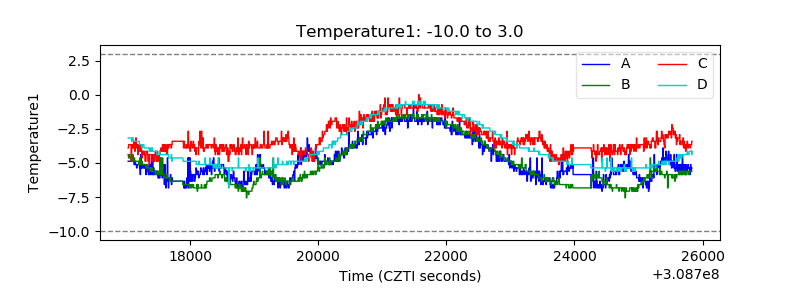 |
| Veto HV Monitor | 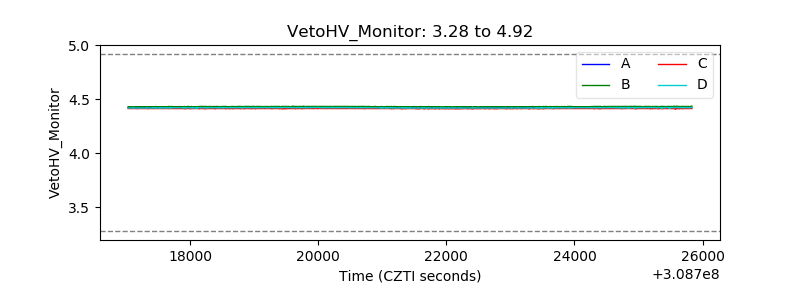 |
| Veto LLD | 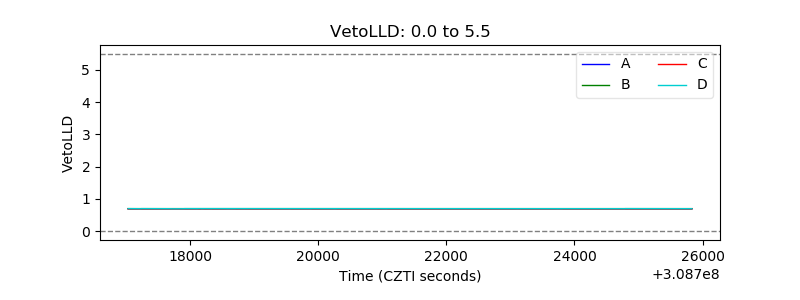 |
| Alpha Counter | 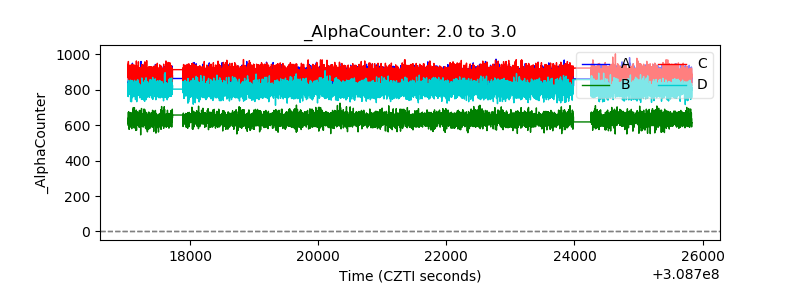 |
| _CPM_Rate | 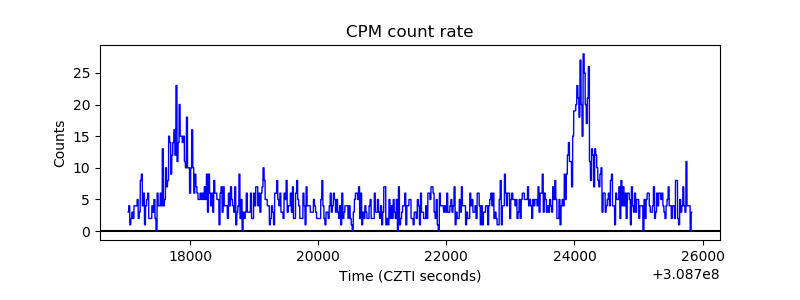 |
| CZT Counter | 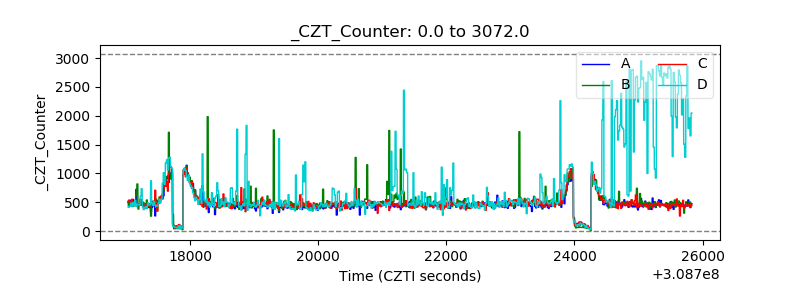 |
| +2.5 Volts monitor |  |
| +5 Volts monitor |  |
| _ROLL_ROT | 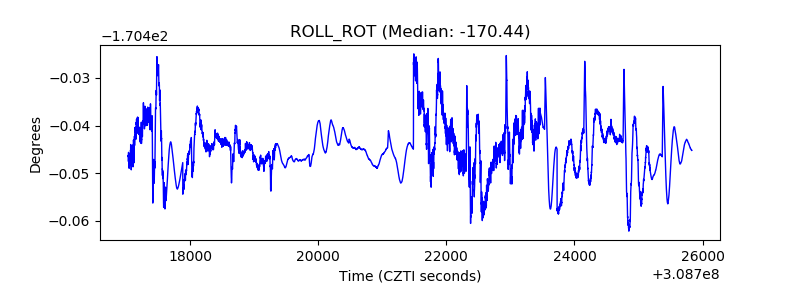 |
| _Roll_DEC | 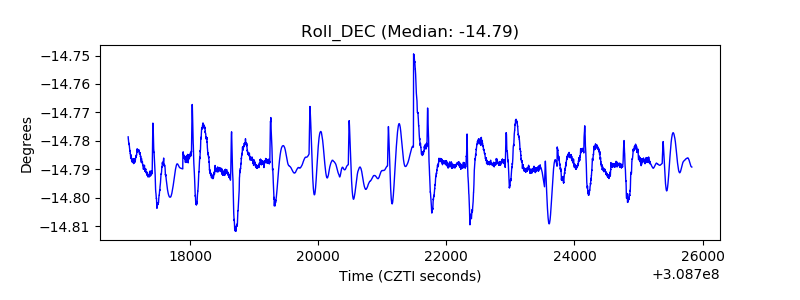 |
| _Roll_RA | 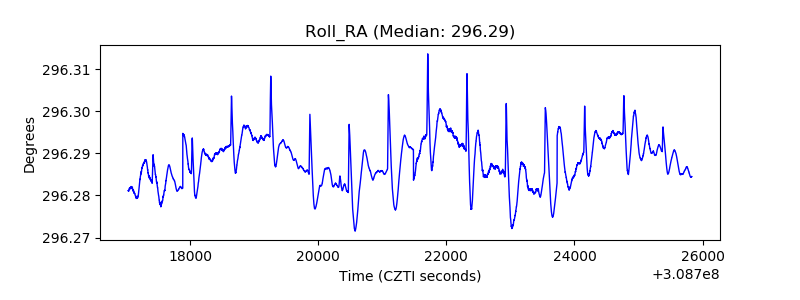 |
| Veto Counter | 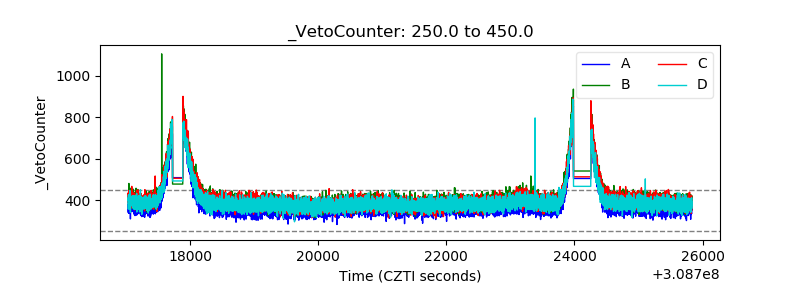 |