| Param | Original file | Final file |
|---|---|---|
| Filename | modeM0/AS1A07_118T01_9000003232_21865cztM0_level2.evt | modeM0/AS1A07_118T01_9000003232_21865cztM0_level2_quad_clean.evt |
| Size (bytes) | 1,757,721,600 | 219,490,560 |
| Size | 1.6 GB | 209.3 MB |
| Events in quadrant A | 8,884,568 | 1,451,618 |
| Events in quadrant B | 9,248,357 | 1,480,472 |
| Events in quadrant C | 8,816,840 | 1,446,120 |
| Events in quadrant D | 25,032,504 | 990,918 |
| Mode SS | |||
|---|---|---|---|
| Quadrant | BADHDUFLAG | Total packets | Discarded packets |
| A | 0 | 376 | 0 |
| B | 0 | 376 | 0 |
| C | 0 | 376 | 0 |
| D | 0 | 376 | 0 |
| Mode M9 | |||
|---|---|---|---|
| Quadrant | BADHDUFLAG | Total packets | Discarded packets |
| A | 0 | 23 | 0 |
| B | 0 | 23 | 0 |
| C | 0 | 23 | 0 |
| D | 0 | 23 | 0 |
| Mode M0 | |||
|---|---|---|---|
| Quadrant | BADHDUFLAG | Total packets | Discarded packets |
| A | 0 | 38386 | 4 |
| B | 0 | 38985 | 4 |
| C | 0 | 38074 | 4 |
| D | 0 | 86966 | 4 |
| Quadrant | Total seconds | Saturated seconds | Saturation percentage |
|---|---|---|---|
| A | 18530 | 325 | 1.753913% |
| B | 18530 | 401 | 2.164058% |
| C | 18531 | 393 | 2.120771% |
| D | 18531 | 6891 | 37.186336% |
Noise dominated data is calculated using 1-second bins in cleaned event files. If a bin has >2000 counts, and if more than 50% of those come from <1% of pixels, then it is considered to be noise-dominated and hence unusable.
| Quadrant | # 1 sec bins | Bins with >0 counts | Bins with >2000 counts | High rate bins dominated by noise | Noise dominated (total time) | Noise dominated (detector-on time) | Marked lightcurve |
|---|---|---|---|---|---|---|---|
| A | 20805 | 18530 | 5 | 5 | 0.02% | 0.03% | 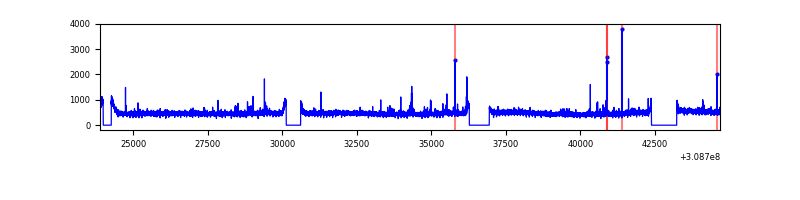 |
| B | 20805 | 18530 | 34 | 34 | 0.16% | 0.18% | 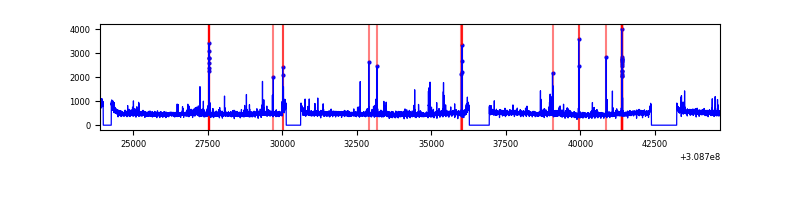 |
| C | 20806 | 18532 | 0 | 0 | 0.00% | 0.00% | 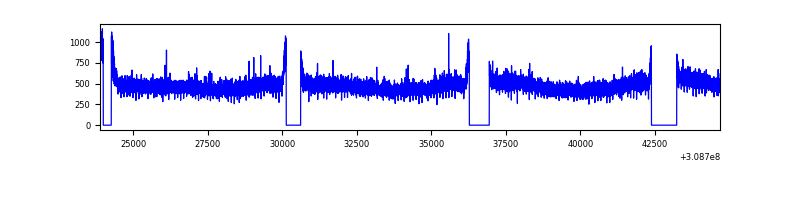 |
| D | 20805 | 18530 | 5048 | 5048 | 24.26% | 27.24% | 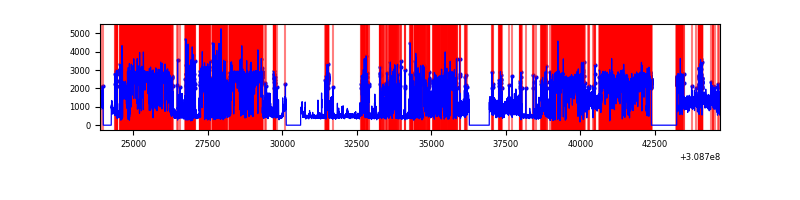 |
Top three noisy pixels from each quadrant. If the there are fewer than three noisy pixels in the level2.evt file, extra rows are filled as -1
| Pixel properties | Quadrant properties | ||||||
|---|---|---|---|---|---|---|---|
| Quadrant | DetID | PixID | Counts | Sigma | Mean | Median | Sigma |
| A | 4 | 2 | 68859 | 145.8 | 2265 | 2210 | 457.1 |
| A | 5 | 16 | 60102 | 126.64 | 2265 | 2210 | 457.1 |
| A | 13 | 254 | 33727 | 68.95 | 2265 | 2210 | 457.1 |
| B | 3 | 64 | 157860 | 356.06 | 2264 | 2202 | 437.2 |
| B | 0 | 190 | 86350 | 192.48 | 2264 | 2202 | 437.2 |
| B | 12 | 111 | 53666 | 117.72 | 2264 | 2202 | 437.2 |
| C | 14 | 238 | 340725 | 665.41 | 2175 | 2184 | 508.8 |
| C | 13 | 61 | 15279 | 25.74 | 2175 | 2184 | 508.8 |
| C | 15 | 78 | 5322 | 6.17 | 2175 | 2184 | 508.8 |
| D | 1 | 52 | 17797311 | 43171.23 | 1639 | 1599 | 412.2 |
| D | 12 | 227 | 248119 | 598.04 | 1639 | 1599 | 412.2 |
| D | 7 | 238 | 228051 | 549.36 | 1639 | 1599 | 412.2 |
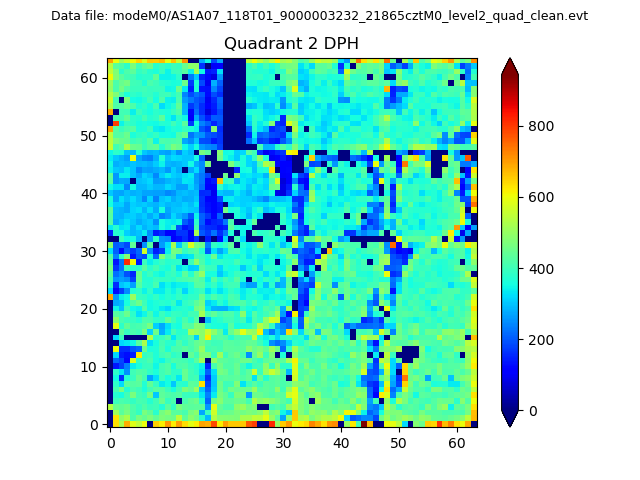
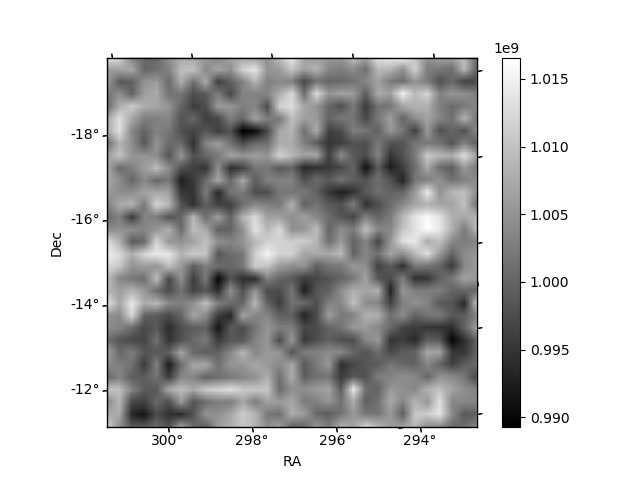
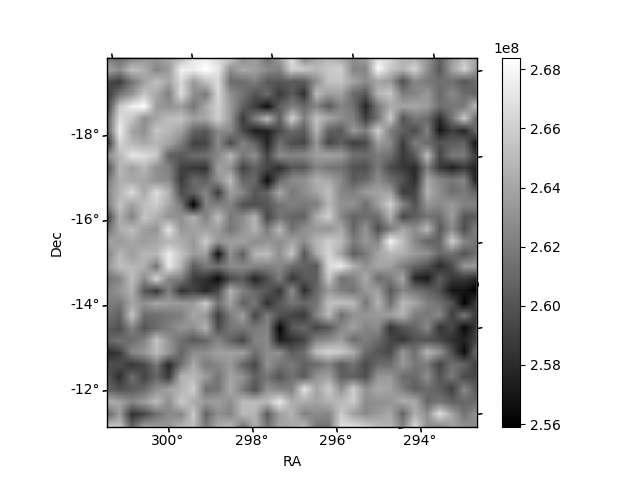
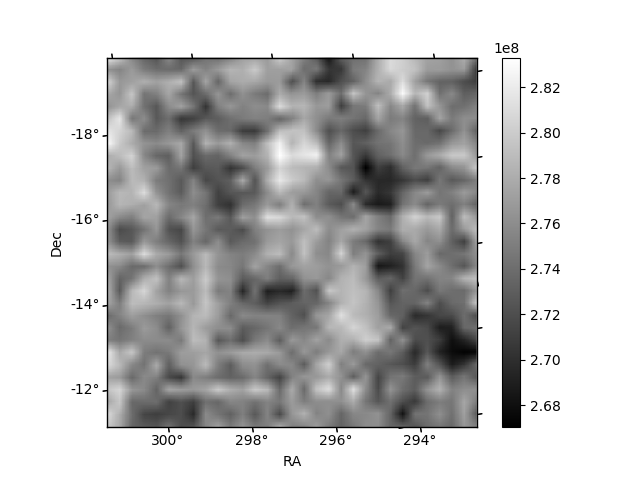
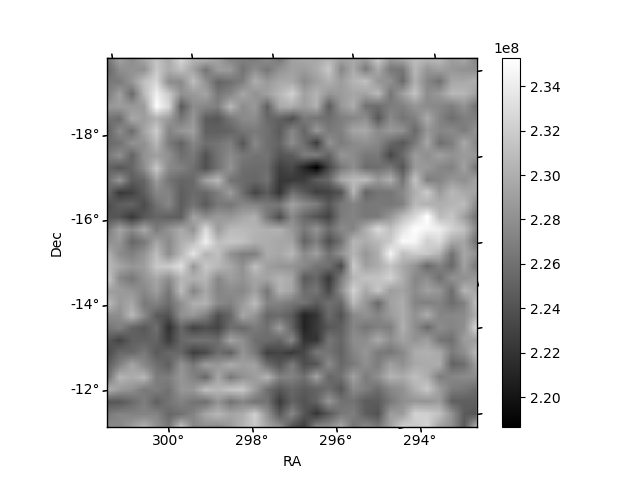
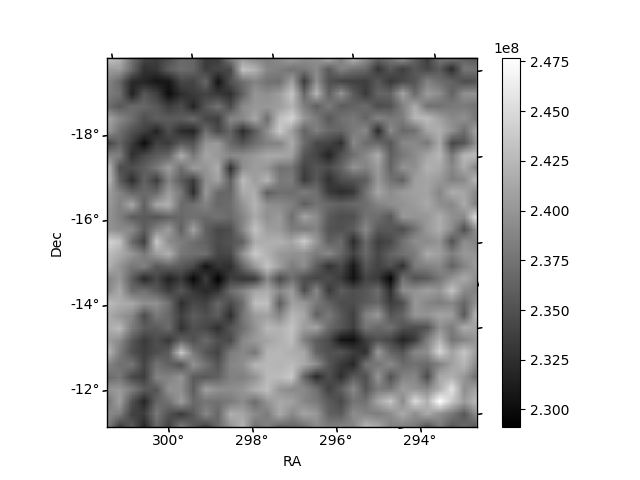
Histogram calculated using DETX and DETY for each event in the final _common_clean file
| Quadrant A | 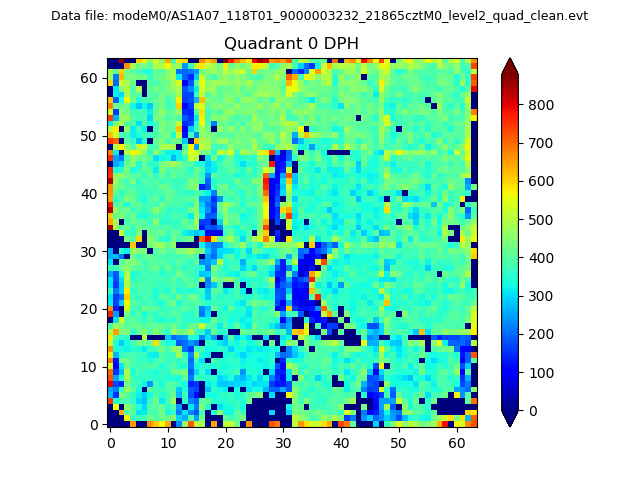 |
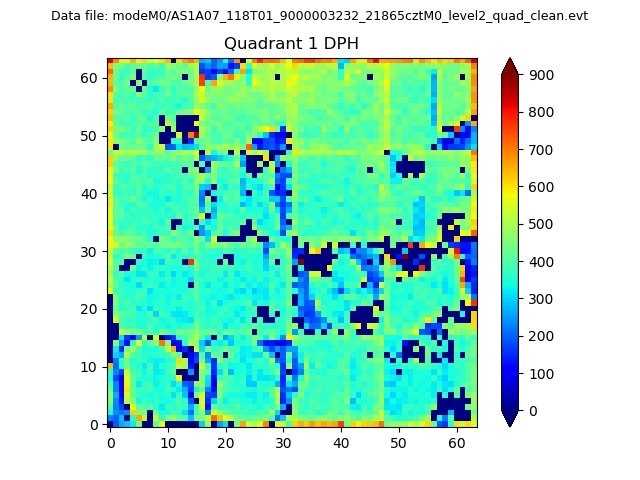 |
Quadrant B |
|---|---|---|---|
| Quadrant D | 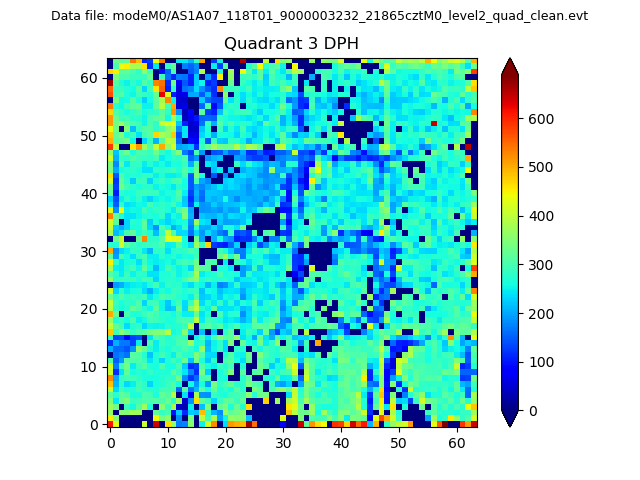 |
 |
Quadrant C |
| Plot type | Count rate plots | Images |
|---|---|---|
| Comparison with Poisson distribution Blue bars denote a histogram of data divided into 1 sec bins. Red curve is a Poisson curve with rate = median count rate of data. |
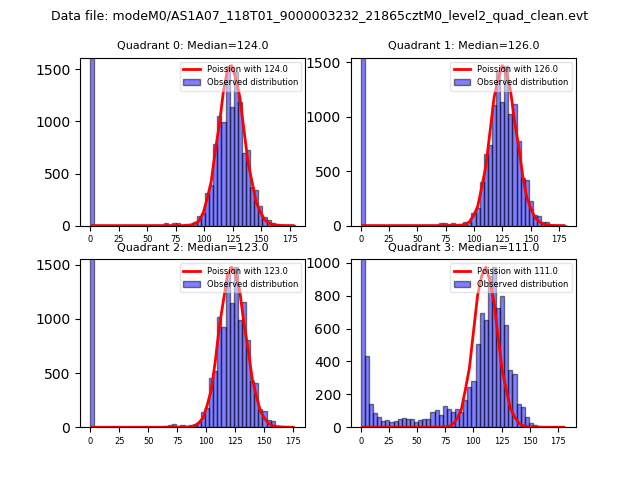 |
 |
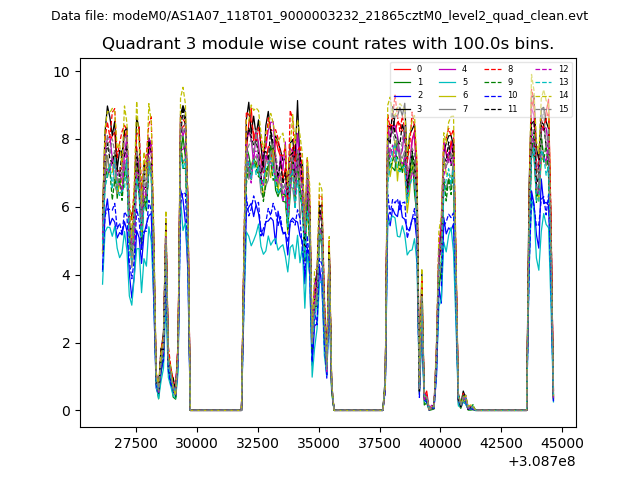
| Quadrant-wise count rates Data is divided into 100 sec bins |
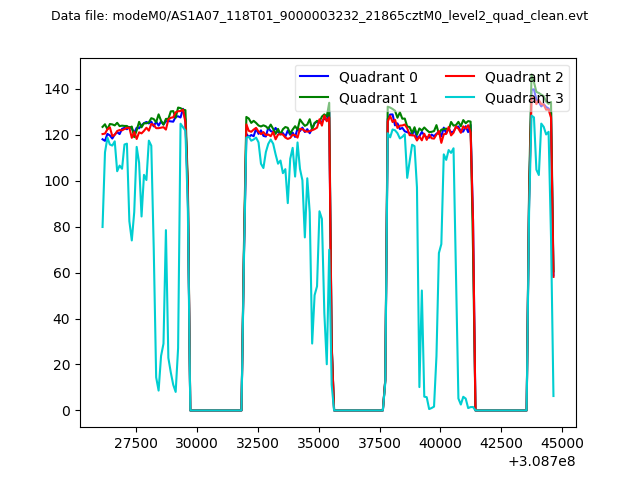 |
|
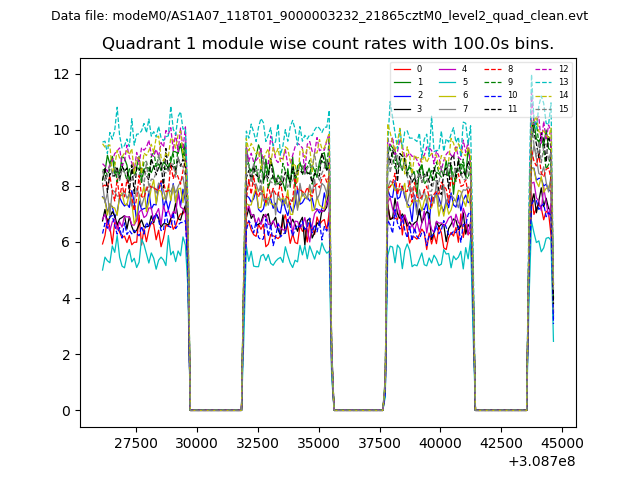
| Module-wise count rates for Quadrant A Data is divided into 100 sec bins |
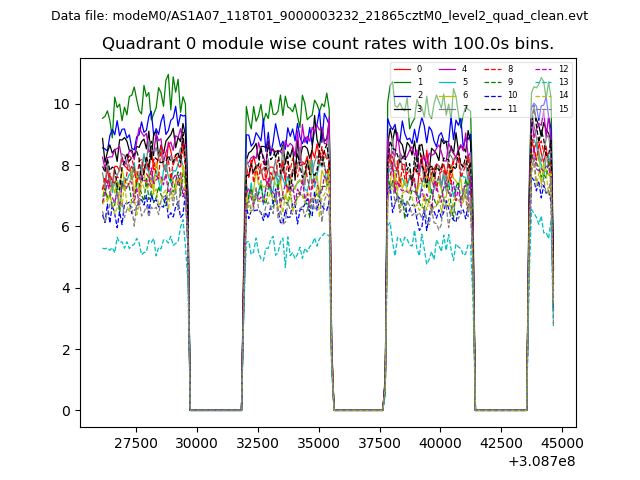 |
 |
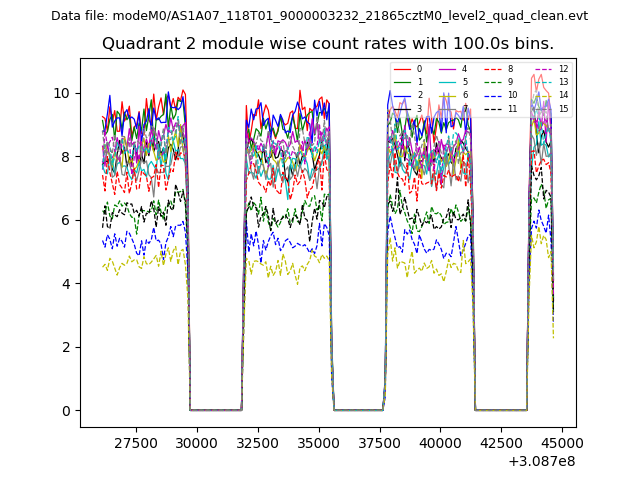
| Module-wise count rates for Quadrant B Data is divided into 100 sec bins |
 |
 |
| Module-wise count rates for Quadrant C Data is divided into 100 sec bins |
 |
 |
| Module-wise count rates for Quadrant D Data is divided into 100 sec bins |
 |
 |
| Parameter | Plot |
|---|---|
| CZT HV Monitor | 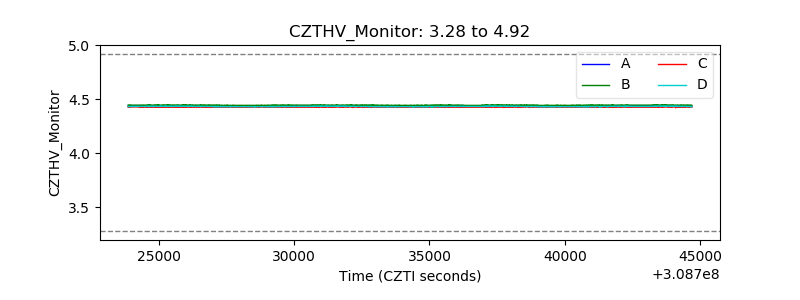 |
| D_VDD | 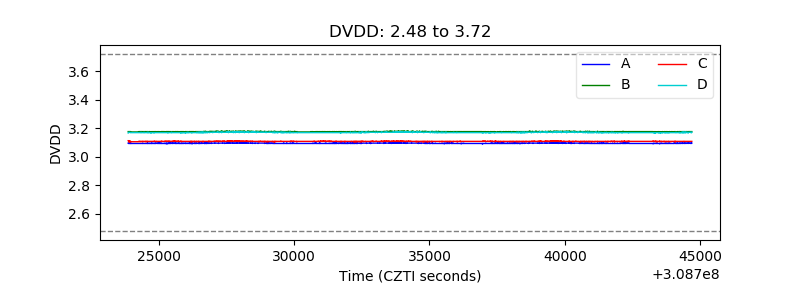 |
| Temperature 1 | 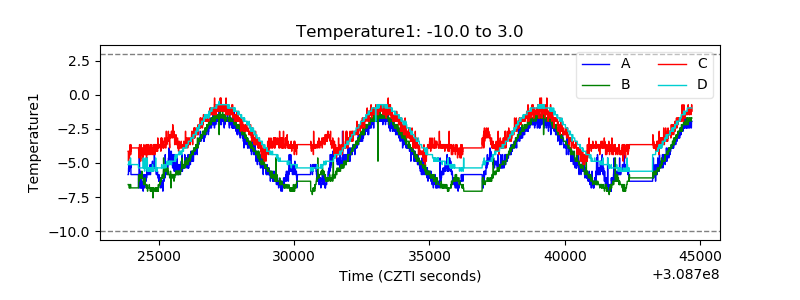 |
| Veto HV Monitor | 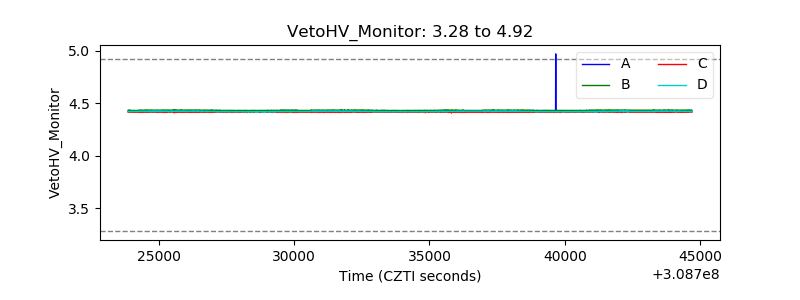 |
| Veto LLD | 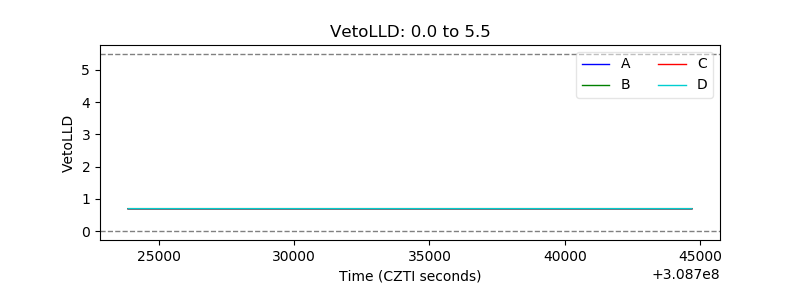 |
| Alpha Counter | 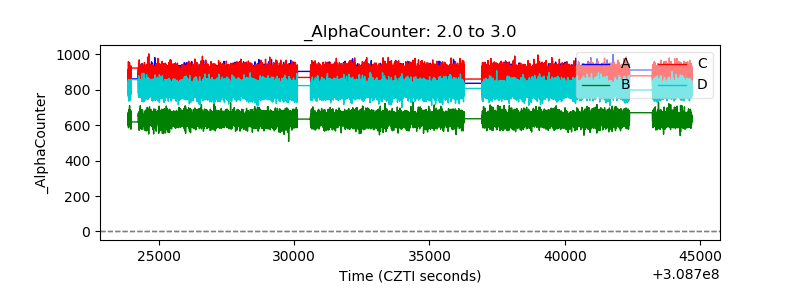 |
| _CPM_Rate | 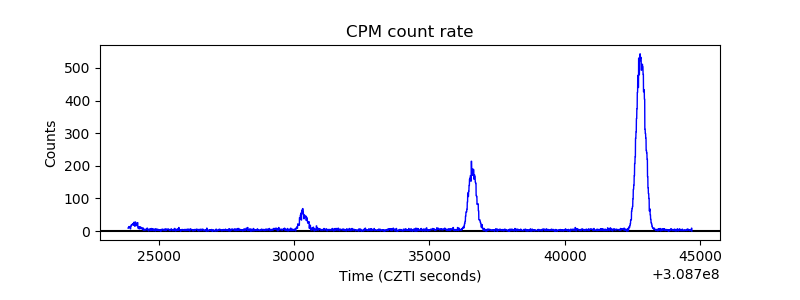 |
| CZT Counter | 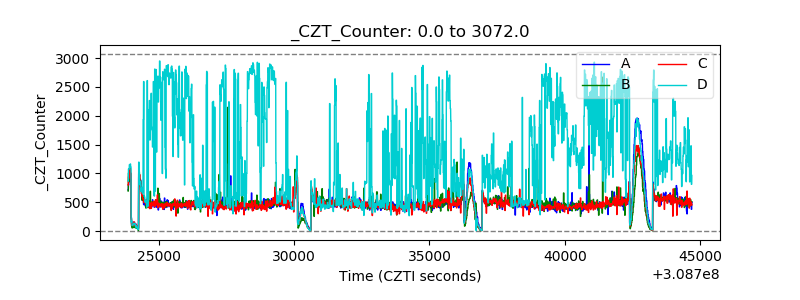 |
| +2.5 Volts monitor | 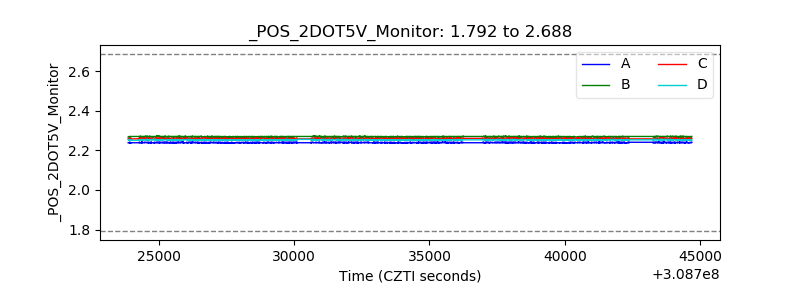 |
| +5 Volts monitor |  |
| _ROLL_ROT | 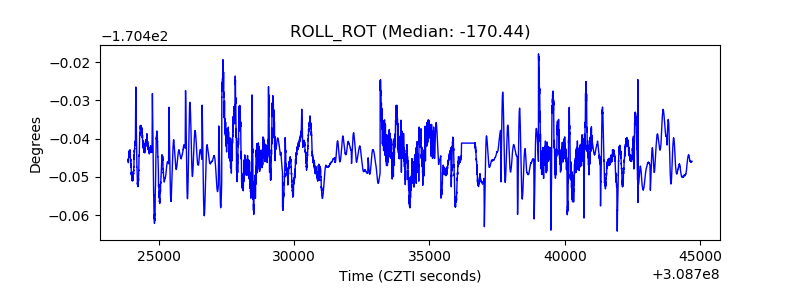 |
| _Roll_DEC | 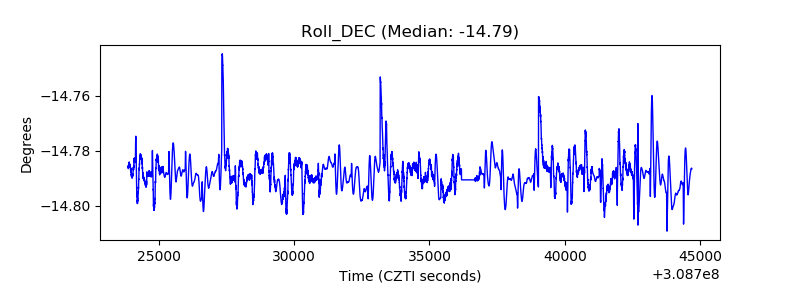 |
| _Roll_RA | 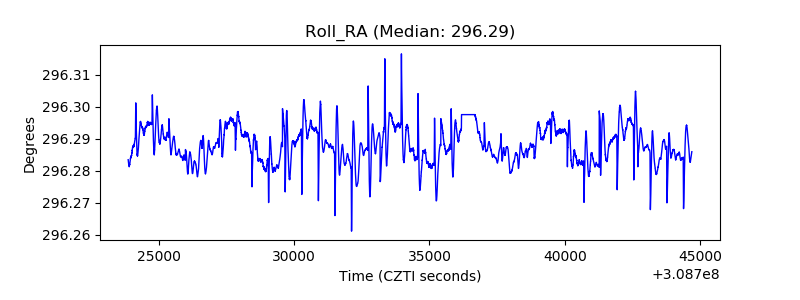 |
| Veto Counter | 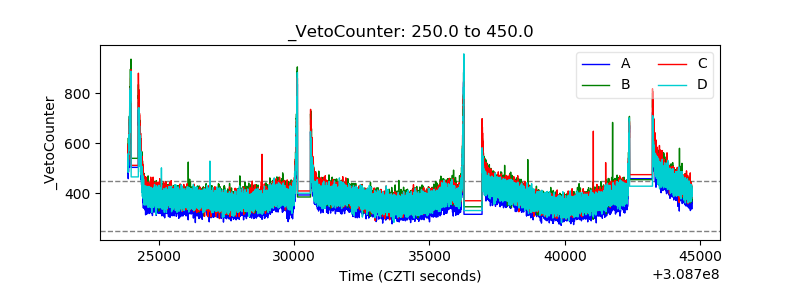 |