| Param | Original file | Final file |
|---|---|---|
| Filename | modeM0/AS1A07_118T01_9000003232_21866cztM0_level2.evt | modeM0/AS1A07_118T01_9000003232_21866cztM0_level2_quad_clean.evt |
| Size (bytes) | 605,928,960 | 92,868,480 |
| Size | 577.9 MB | 88.6 MB |
| Events in quadrant A | 3,343,243 | 663,282 |
| Events in quadrant B | 3,390,513 | 671,132 |
| Events in quadrant C | 3,167,819 | 647,181 |
| Events in quadrant D | 8,005,968 | 374,481 |
| Mode SS | |||
|---|---|---|---|
| Quadrant | BADHDUFLAG | Total packets | Discarded packets |
| A | 0 | 132 | 0 |
| B | 0 | 132 | 0 |
| C | 0 | 132 | 0 |
| D | 0 | 132 | 0 |
| Mode M9 | |||
|---|---|---|---|
| Quadrant | BADHDUFLAG | Total packets | Discarded packets |
| A | 0 | 10 | 0 |
| B | 0 | 10 | 0 |
| C | 0 | 10 | 0 |
| D | 0 | 10 | 0 |
| Mode M0 | |||
|---|---|---|---|
| Quadrant | BADHDUFLAG | Total packets | Discarded packets |
| A | 0 | 14152 | 1 |
| B | 0 | 14206 | 1 |
| C | 0 | 13613 | 1 |
| D | 0 | 28186 | 1 |
| Quadrant | Total seconds | Saturated seconds | Saturation percentage |
|---|---|---|---|
| A | 6527 | 69 | 1.057147% |
| B | 6528 | 98 | 1.501225% |
| C | 6528 | 93 | 1.424632% |
| D | 6528 | 2571 | 39.384191% |
Noise dominated data is calculated using 1-second bins in cleaned event files. If a bin has >2000 counts, and if more than 50% of those come from <1% of pixels, then it is considered to be noise-dominated and hence unusable.
| Quadrant | # 1 sec bins | Bins with >0 counts | Bins with >2000 counts | High rate bins dominated by noise | Noise dominated (total time) | Noise dominated (detector-on time) | Marked lightcurve |
|---|---|---|---|---|---|---|---|
| A | 7512 | 6527 | 11 | 11 | 0.15% | 0.17% |  |
| B | 7513 | 6528 | 25 | 25 | 0.33% | 0.38% | 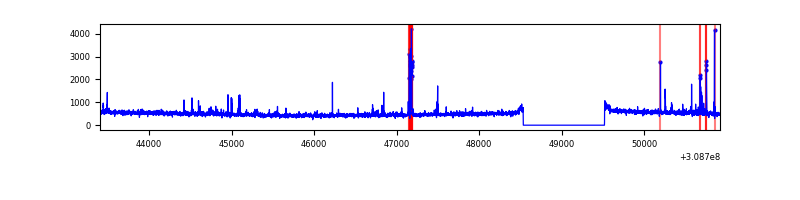 |
| C | 7513 | 6528 | 0 | 0 | 0.00% | 0.00% | 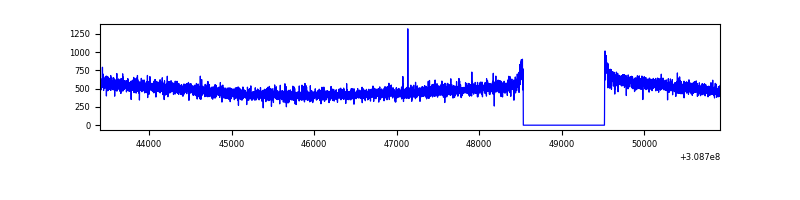 |
| D | 7513 | 6528 | 1138 | 1138 | 15.15% | 17.43% | 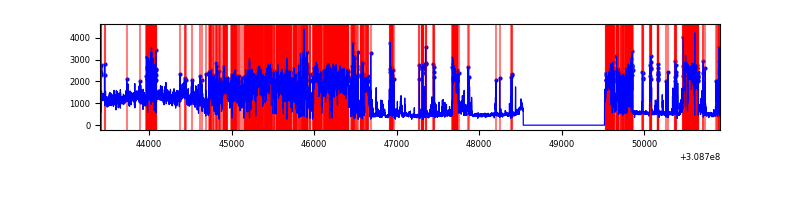 |
Top three noisy pixels from each quadrant. If the there are fewer than three noisy pixels in the level2.evt file, extra rows are filled as -1
| Pixel properties | Quadrant properties | ||||||
|---|---|---|---|---|---|---|---|
| Quadrant | DetID | PixID | Counts | Sigma | Mean | Median | Sigma |
| A | 6 | 16 | 78782 | 471.04 | 822 | 806 | 165.5 |
| A | 4 | 2 | 56776 | 338.1 | 822 | 806 | 165.5 |
| A | 5 | 16 | 28643 | 168.16 | 822 | 806 | 165.5 |
| B | 3 | 64 | 101270 | 637.77 | 814 | 794 | 157.5 |
| B | 0 | 190 | 53314 | 333.37 | 814 | 794 | 157.5 |
| B | 12 | 111 | 18754 | 114.0 | 814 | 794 | 157.5 |
| C | 14 | 238 | 123986 | 676.27 | 780 | 784 | 182.2 |
| C | 13 | 61 | 5467 | 25.71 | 780 | 784 | 182.2 |
| C | 15 | 78 | 1986 | 6.6 | 780 | 784 | 182.2 |
| D | 1 | 52 | 5830105 | 40196.75 | 550 | 537 | 145.0 |
| D | 7 | 238 | 27704 | 187.33 | 550 | 537 | 145.0 |
| D | 2 | 234 | 17731 | 118.56 | 550 | 537 | 145.0 |
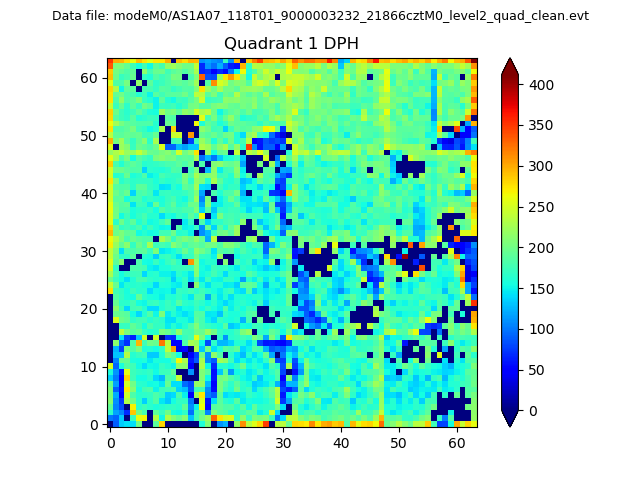
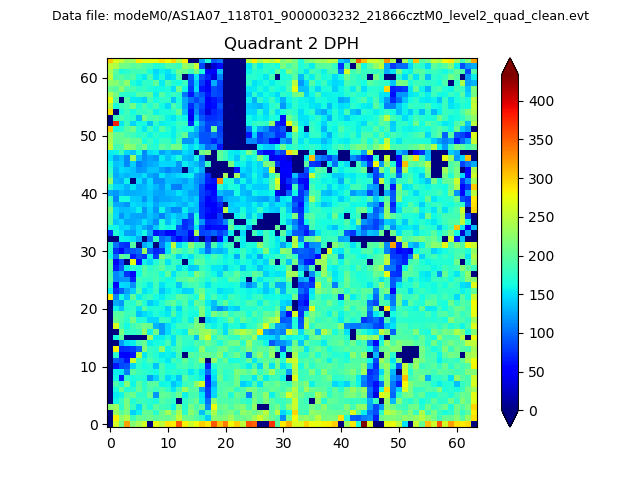
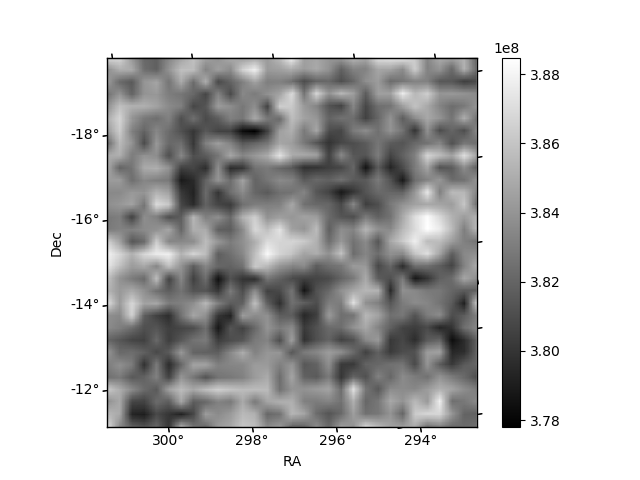
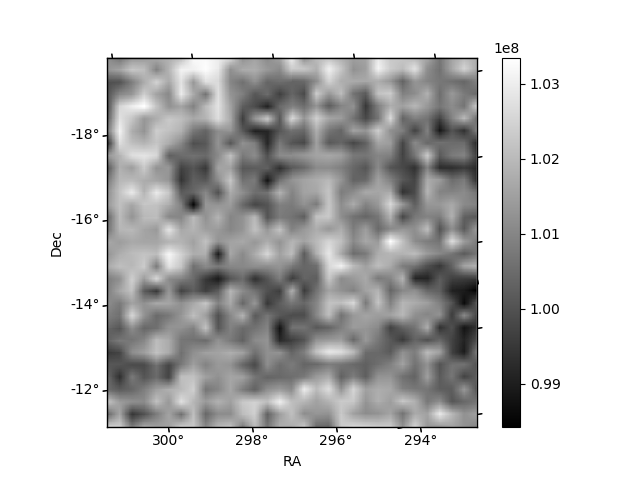
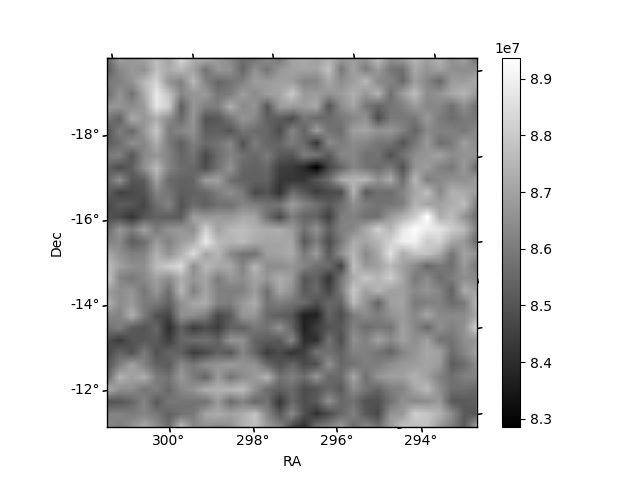
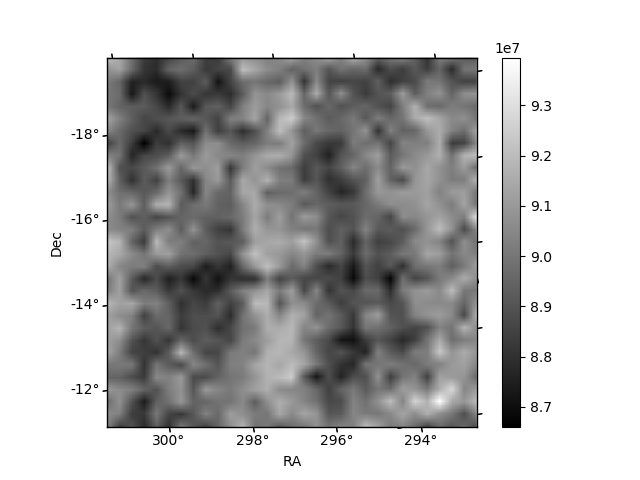
Histogram calculated using DETX and DETY for each event in the final _common_clean file
| Quadrant A | 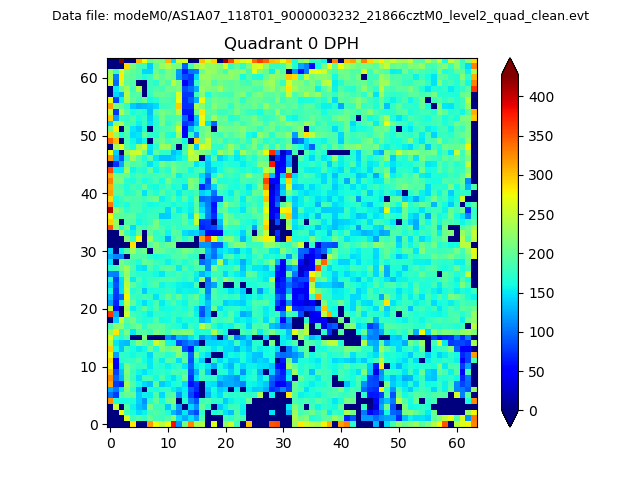 |
 |
Quadrant B |
|---|---|---|---|
| Quadrant D | 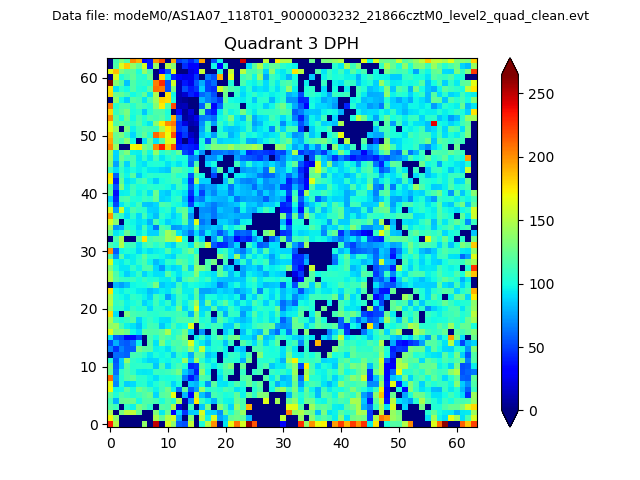 |
 |
Quadrant C |
| Plot type | Count rate plots | Images |
|---|---|---|
| Comparison with Poisson distribution Blue bars denote a histogram of data divided into 1 sec bins. Red curve is a Poisson curve with rate = median count rate of data. |
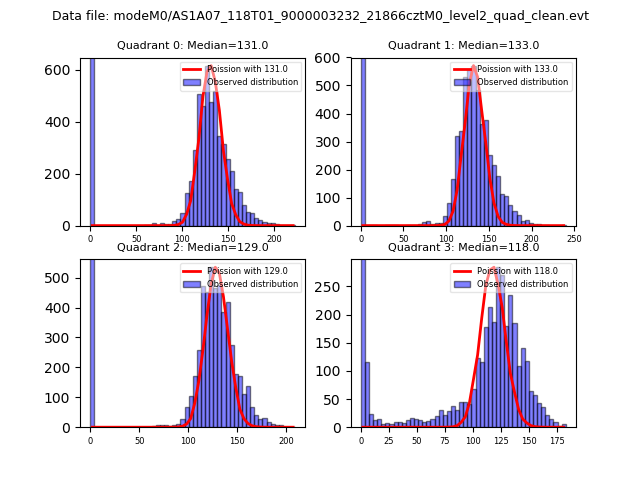 |
 |
| Quadrant-wise count rates Data is divided into 100 sec bins |
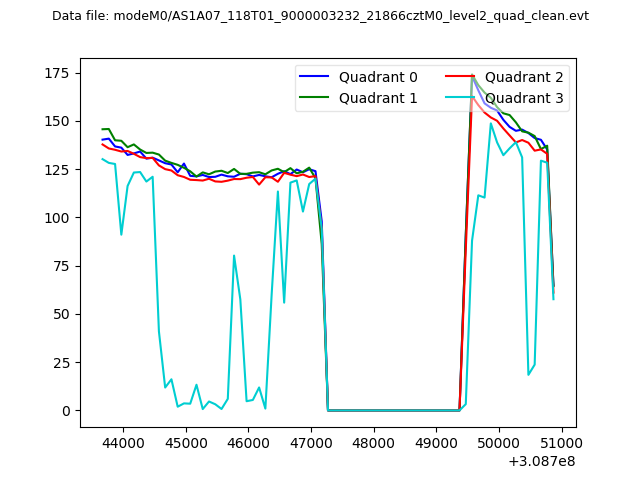 |
|
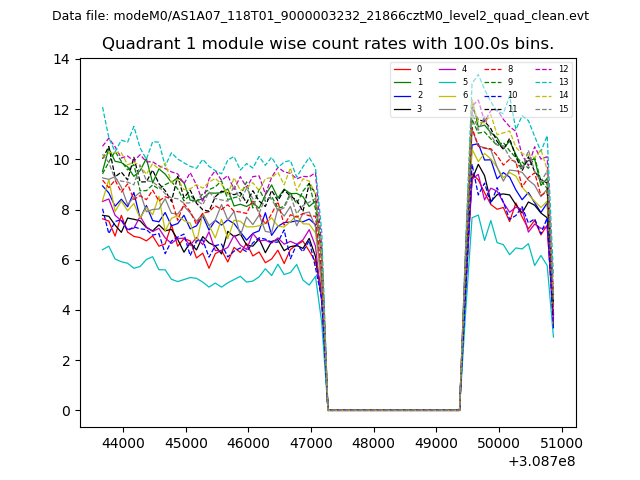
| Module-wise count rates for Quadrant A Data is divided into 100 sec bins |
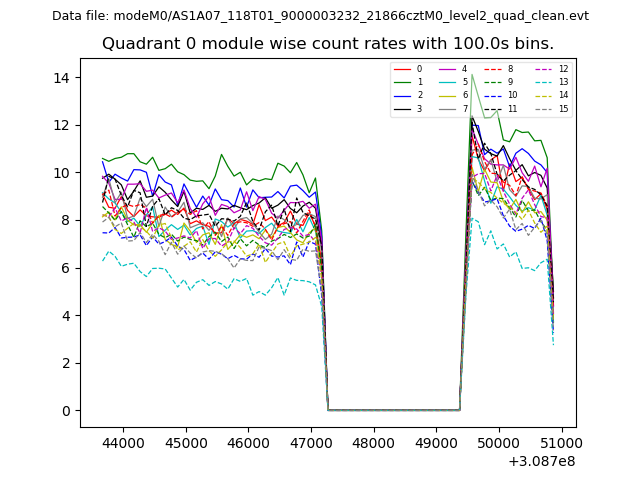 |
 |
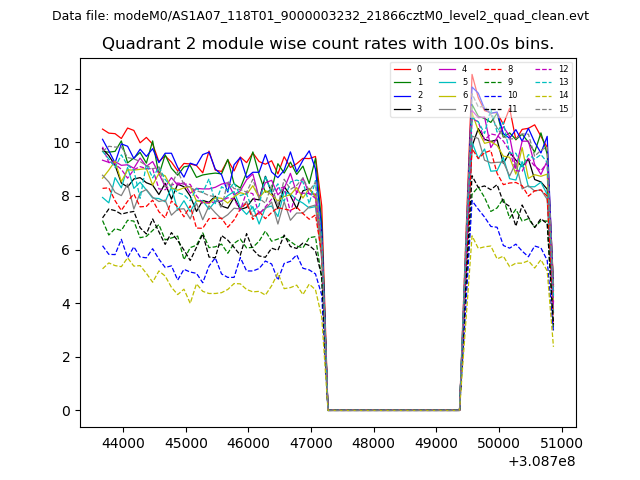
| Module-wise count rates for Quadrant B Data is divided into 100 sec bins |
 |
 |
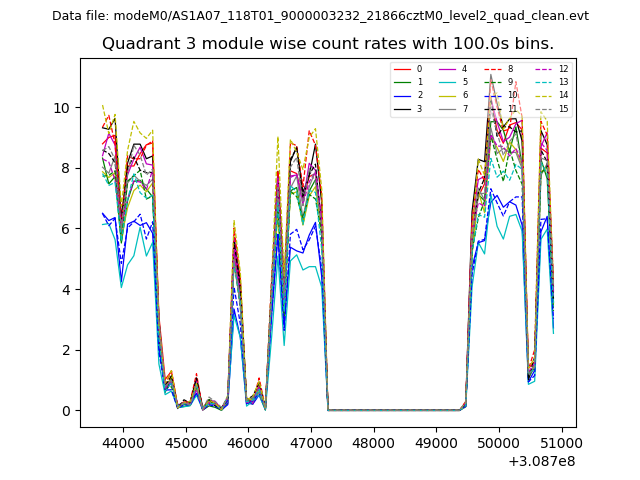
| Module-wise count rates for Quadrant C Data is divided into 100 sec bins |
 |
 |
| Module-wise count rates for Quadrant D Data is divided into 100 sec bins |
 |
 |
| Parameter | Plot |
|---|---|
| CZT HV Monitor | 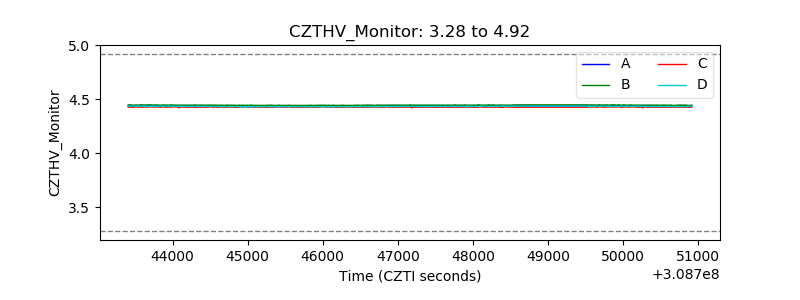 |
| D_VDD |  |
| Temperature 1 | 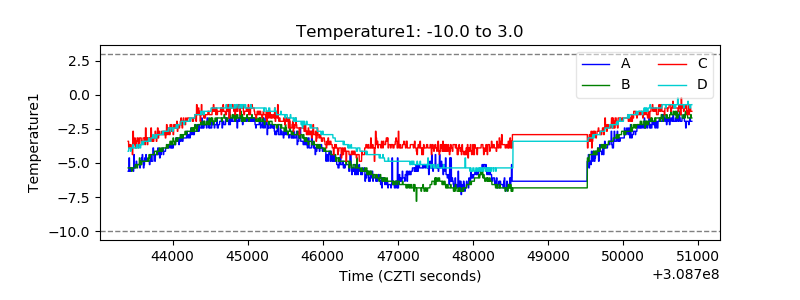 |
| Veto HV Monitor | 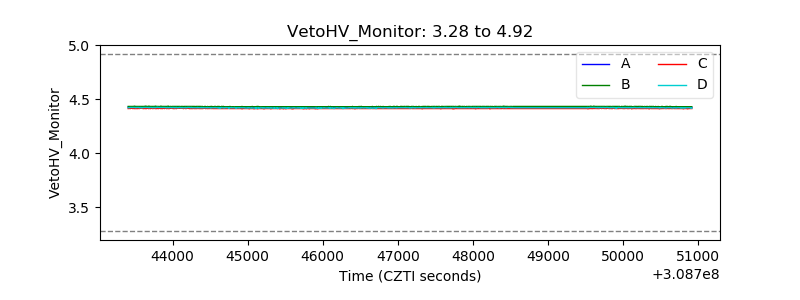 |
| Veto LLD | 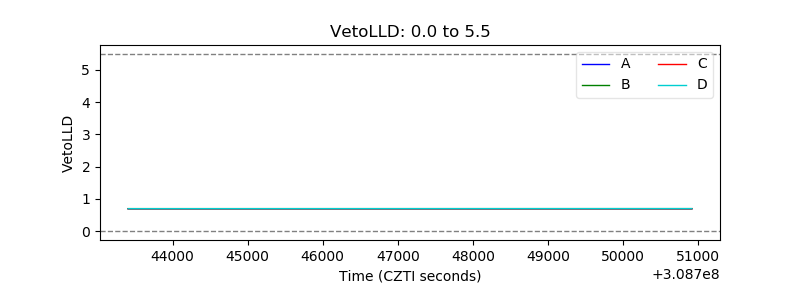 |
| Alpha Counter | 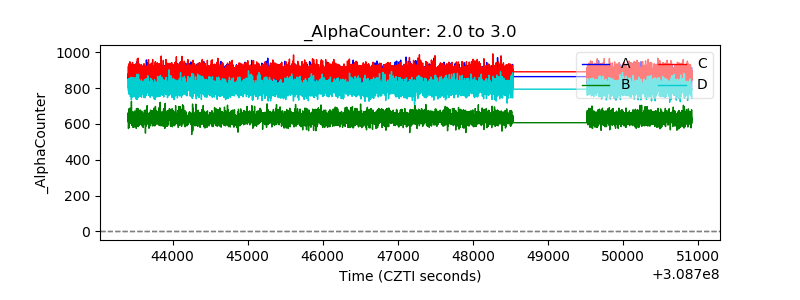 |
| _CPM_Rate | 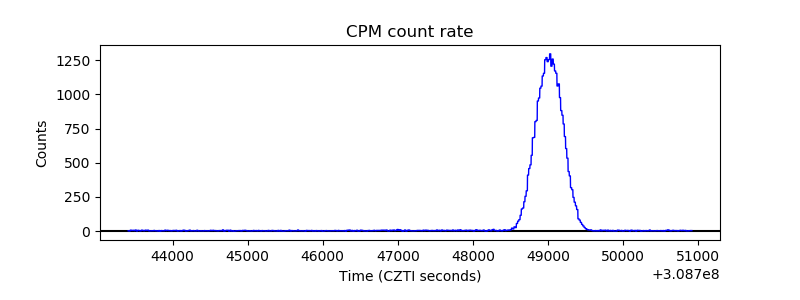 |
| CZT Counter | 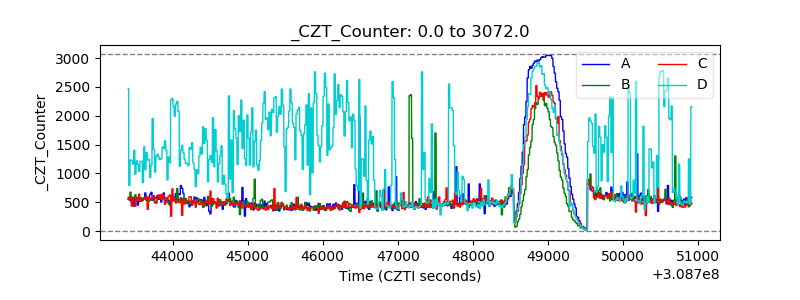 |
| +2.5 Volts monitor |  |
| +5 Volts monitor |  |
| _ROLL_ROT | 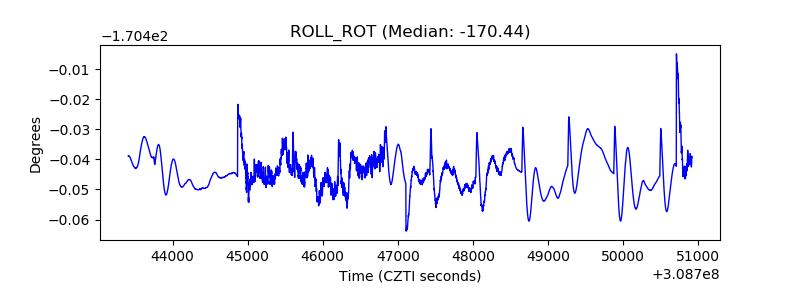 |
| _Roll_DEC | 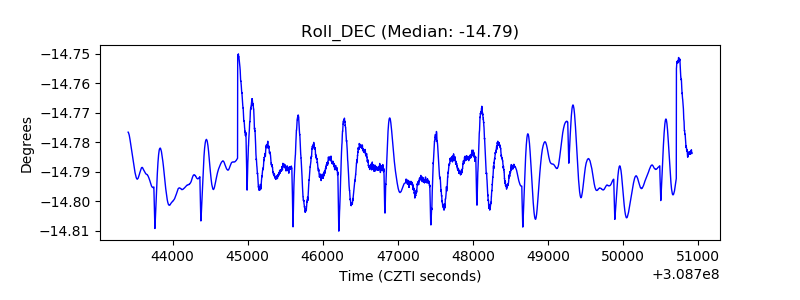 |
| _Roll_RA | 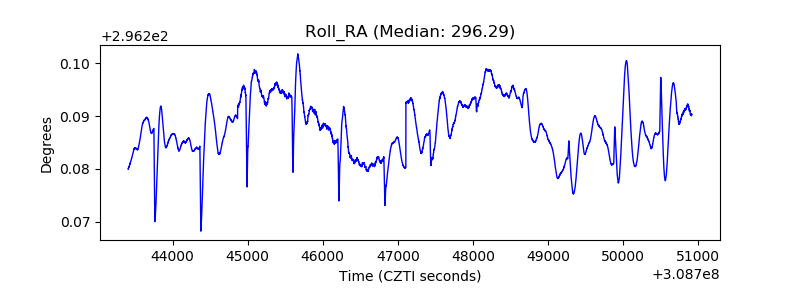 |
| Veto Counter | 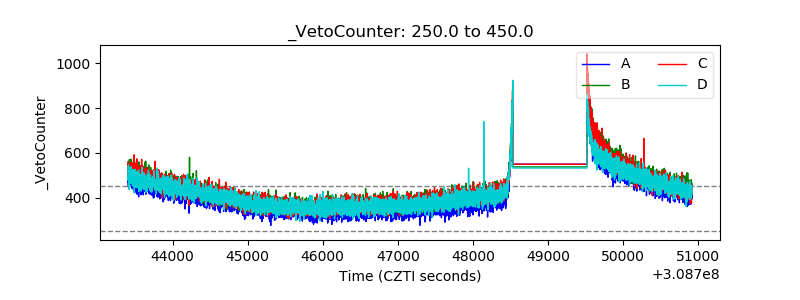 |