| Param | Original file | Final file |
|---|---|---|
| Filename | modeM0/AS1A07_118T01_9000003232_21868cztM0_level2.evt | modeM0/AS1A07_118T01_9000003232_21868cztM0_level2_quad_clean.evt |
| Size (bytes) | 562,968,000 | 109,886,400 |
| Size | 536.9 MB | 104.8 MB |
| Events in quadrant A | 3,815,285 | 739,347 |
| Events in quadrant B | 3,731,977 | 749,242 |
| Events in quadrant C | 3,521,355 | 714,069 |
| Events in quadrant D | 5,504,095 | 635,572 |
| Mode SS | |||
|---|---|---|---|
| Quadrant | BADHDUFLAG | Total packets | Discarded packets |
| A | 0 | 142 | 0 |
| B | 0 | 142 | 0 |
| C | 0 | 142 | 0 |
| D | 0 | 142 | 0 |
| Mode M9 | |||
|---|---|---|---|
| Quadrant | BADHDUFLAG | Total packets | Discarded packets |
| A | 0 | 21 | 0 |
| B | 0 | 21 | 0 |
| C | 0 | 21 | 0 |
| D | 0 | 21 | 0 |
| Mode M0 | |||
|---|---|---|---|
| Quadrant | BADHDUFLAG | Total packets | Discarded packets |
| A | 0 | 15947 | 2 |
| B | 0 | 15681 | 2 |
| C | 0 | 15027 | 2 |
| D | 0 | 20943 | 2 |
| Quadrant | Total seconds | Saturated seconds | Saturation percentage |
|---|---|---|---|
| A | 7030 | 141 | 2.005690% |
| B | 7031 | 142 | 2.019627% |
| C | 7031 | 160 | 2.275636% |
| D | 7031 | 749 | 10.652823% |
Noise dominated data is calculated using 1-second bins in cleaned event files. If a bin has >2000 counts, and if more than 50% of those come from <1% of pixels, then it is considered to be noise-dominated and hence unusable.
| Quadrant | # 1 sec bins | Bins with >0 counts | Bins with >2000 counts | High rate bins dominated by noise | Noise dominated (total time) | Noise dominated (detector-on time) | Marked lightcurve |
|---|---|---|---|---|---|---|---|
| A | 9135 | 7030 | 32 | 32 | 0.35% | 0.46% | 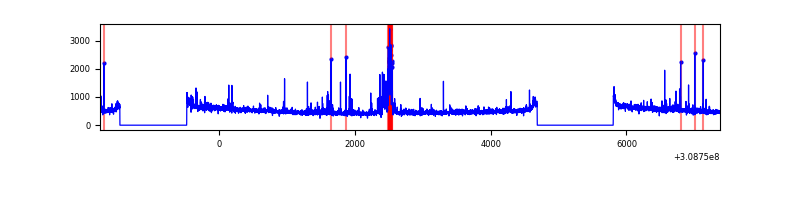 |
| B | 9136 | 7031 | 15 | 15 | 0.16% | 0.21% | 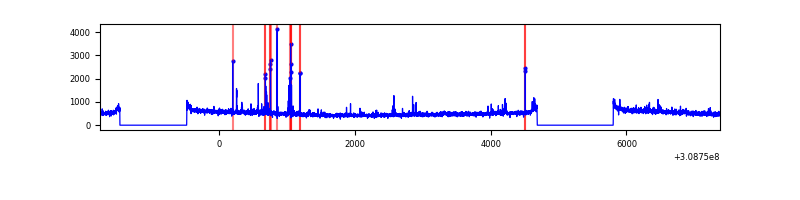 |
| C | 9136 | 7031 | 0 | 0 | 0.00% | 0.00% | 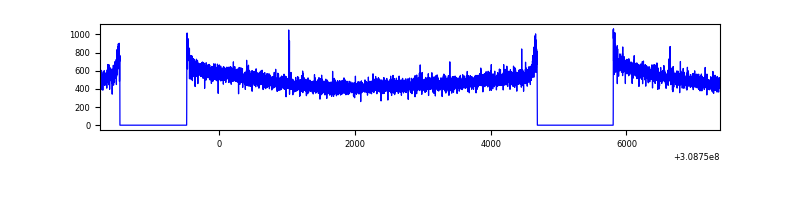 |
| D | 9136 | 7031 | 524 | 524 | 5.74% | 7.45% | 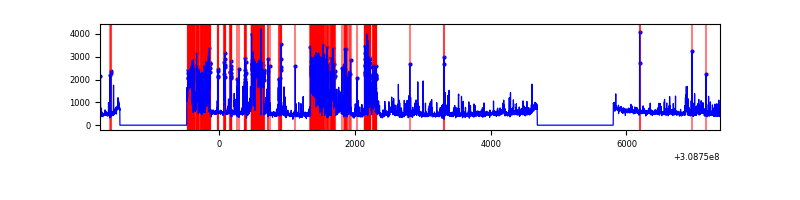 |
Top three noisy pixels from each quadrant. If the there are fewer than three noisy pixels in the level2.evt file, extra rows are filled as -1
| Pixel properties | Quadrant properties | ||||||
|---|---|---|---|---|---|---|---|
| Quadrant | DetID | PixID | Counts | Sigma | Mean | Median | Sigma |
| A | 4 | 2 | 165416 | 894.12 | 918 | 900 | 184.0 |
| A | 6 | 16 | 88749 | 477.44 | 918 | 900 | 184.0 |
| A | 5 | 16 | 22226 | 115.9 | 918 | 900 | 184.0 |
| B | 0 | 190 | 62415 | 358.8 | 907 | 886 | 171.5 |
| B | 3 | 64 | 56486 | 324.23 | 907 | 886 | 171.5 |
| B | 0 | 230 | 31769 | 180.09 | 907 | 886 | 171.5 |
| C | 14 | 238 | 136807 | 672.79 | 866 | 872 | 202.0 |
| C | 13 | 61 | 6054 | 25.65 | 866 | 872 | 202.0 |
| C | 4 | 191 | 4402 | 17.47 | 866 | 872 | 202.0 |
| D | 1 | 52 | 2063152 | 10245.6 | 829 | 806 | 201.3 |
| D | 7 | 238 | 113221 | 558.47 | 829 | 806 | 201.3 |
| D | 2 | 136 | 81275 | 399.76 | 829 | 806 | 201.3 |
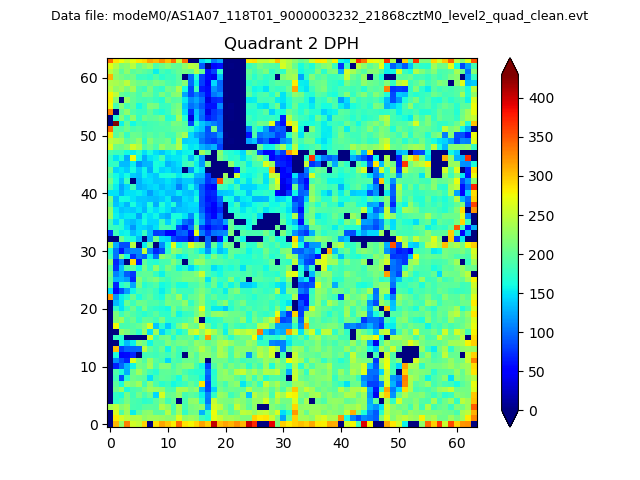
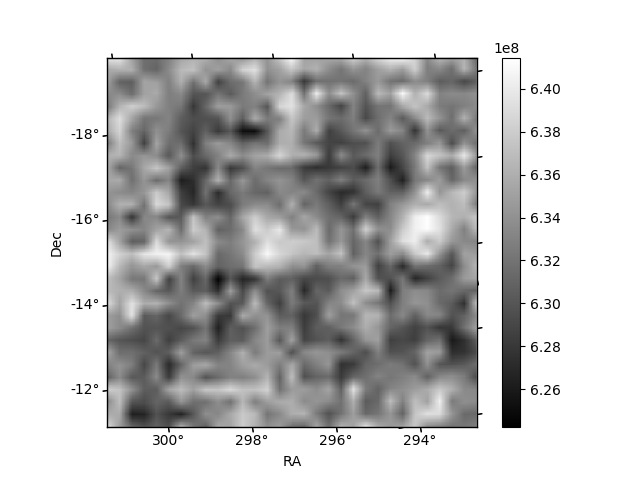
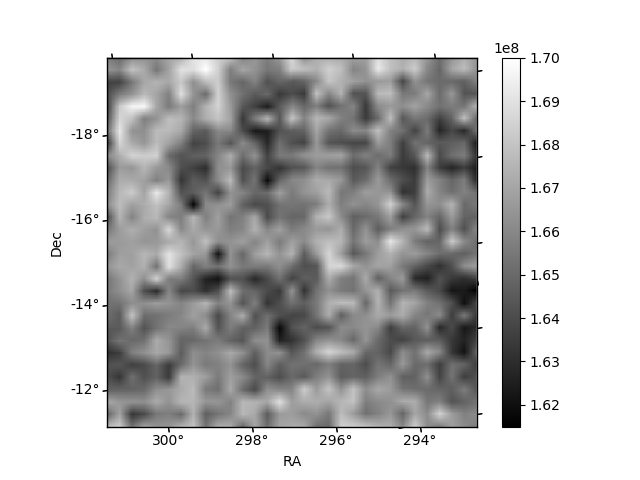
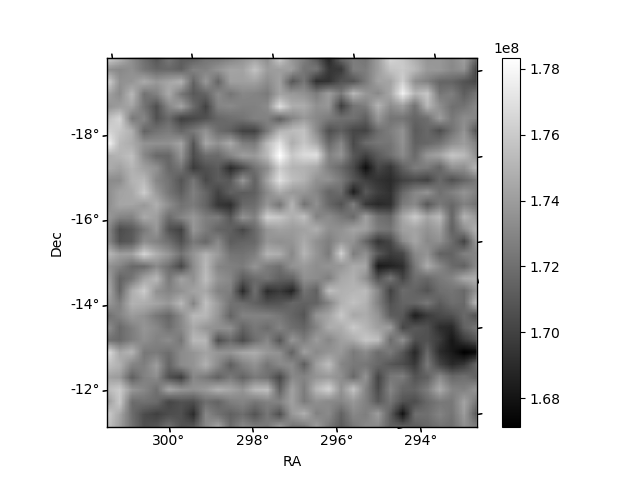
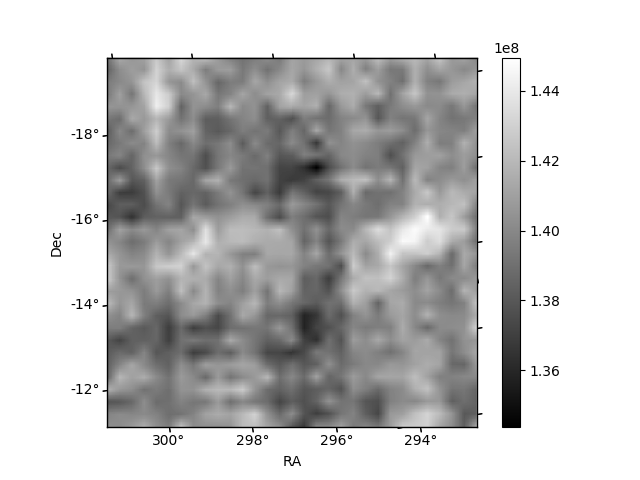
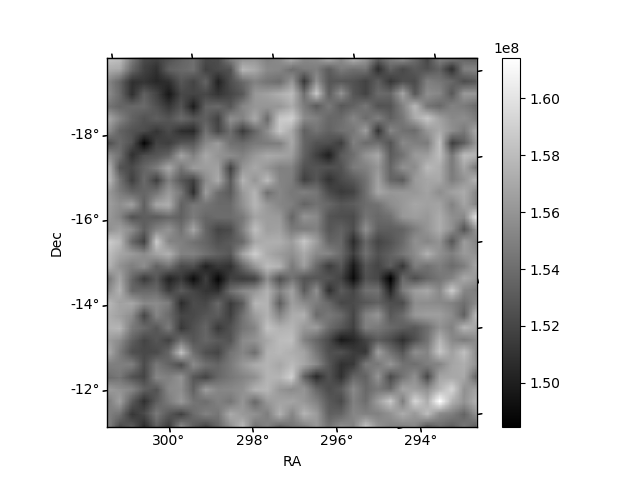
Histogram calculated using DETX and DETY for each event in the final _common_clean file
| Quadrant A | 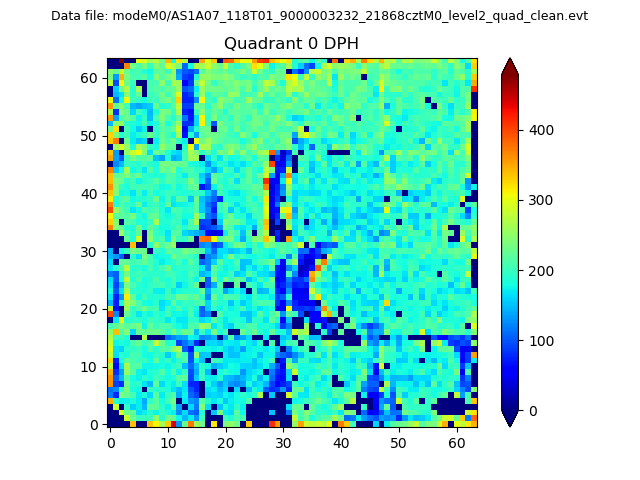 |
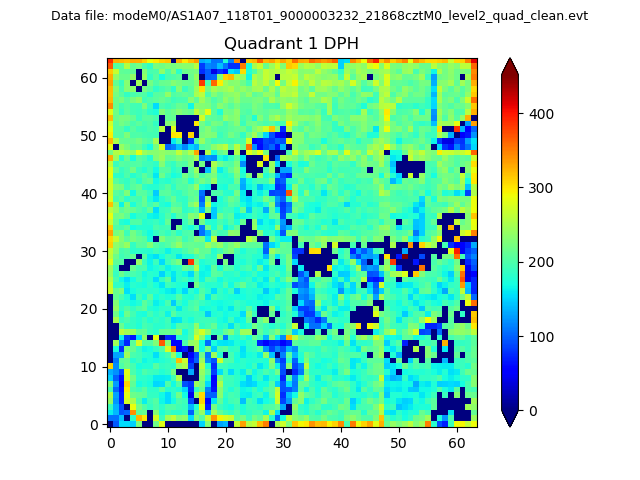 |
Quadrant B |
|---|---|---|---|
| Quadrant D | 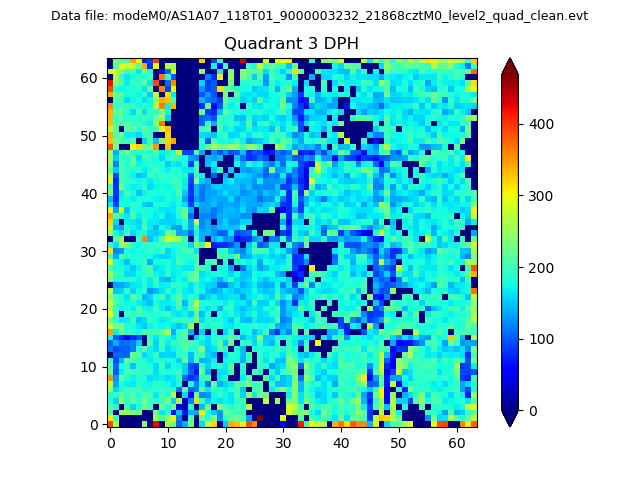 |
 |
Quadrant C |
| Plot type | Count rate plots | Images |
|---|---|---|
| Comparison with Poisson distribution Blue bars denote a histogram of data divided into 1 sec bins. Red curve is a Poisson curve with rate = median count rate of data. |
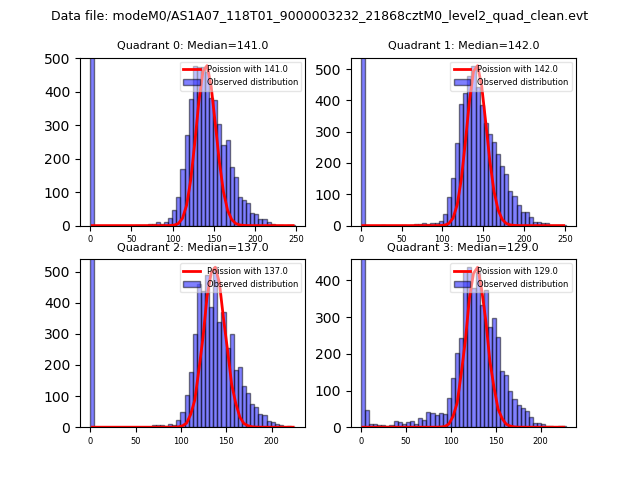 |
 |
| Quadrant-wise count rates Data is divided into 100 sec bins |
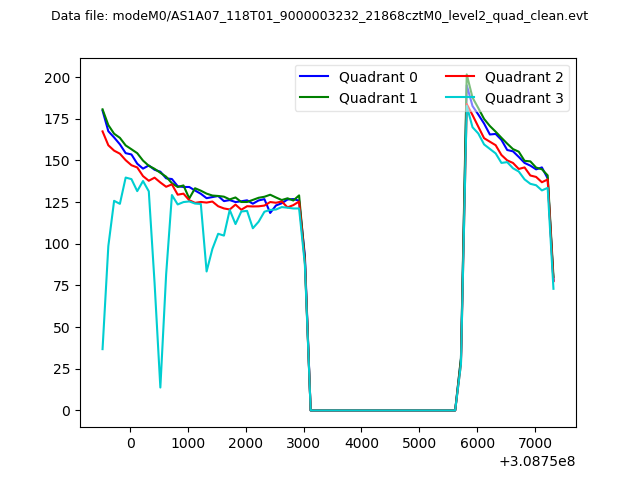 |
|
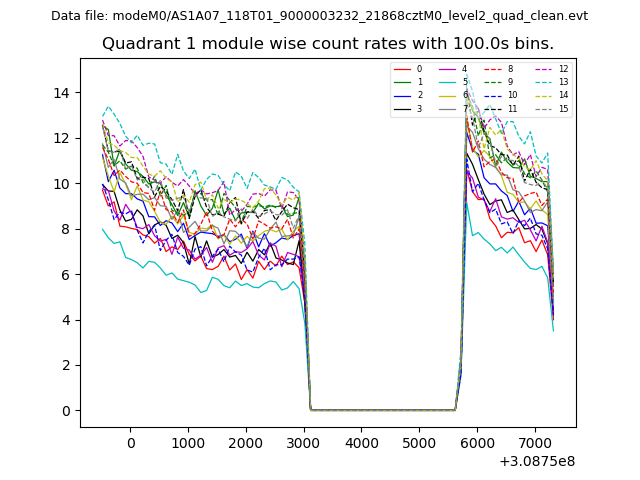
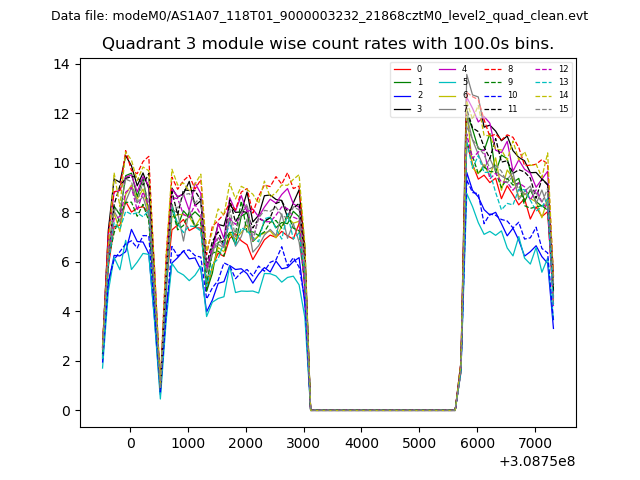
| Module-wise count rates for Quadrant A Data is divided into 100 sec bins |
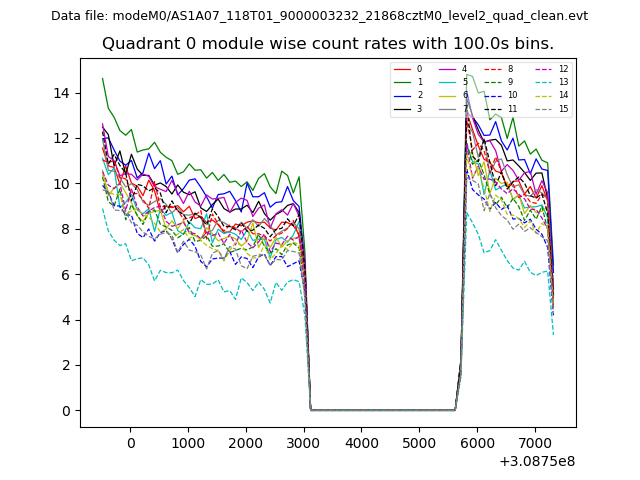 |
 |
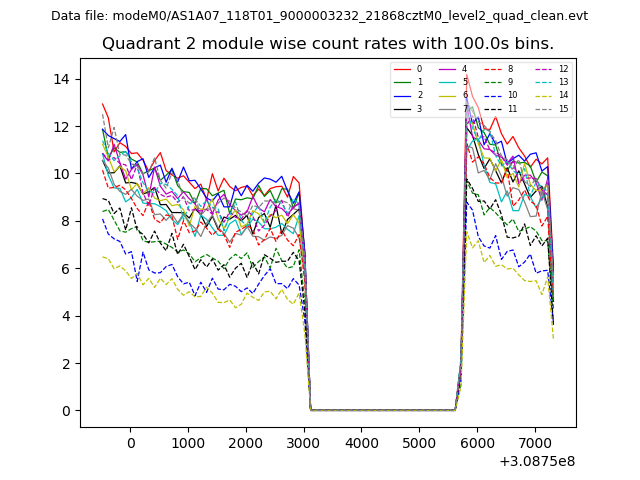
| Module-wise count rates for Quadrant B Data is divided into 100 sec bins |
 |
 |
| Module-wise count rates for Quadrant C Data is divided into 100 sec bins |
 |
 |
| Module-wise count rates for Quadrant D Data is divided into 100 sec bins |
 |
 |
| Parameter | Plot |
|---|---|
| CZT HV Monitor | 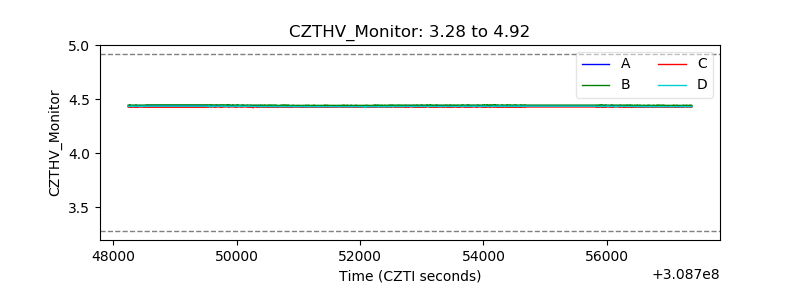 |
| D_VDD | 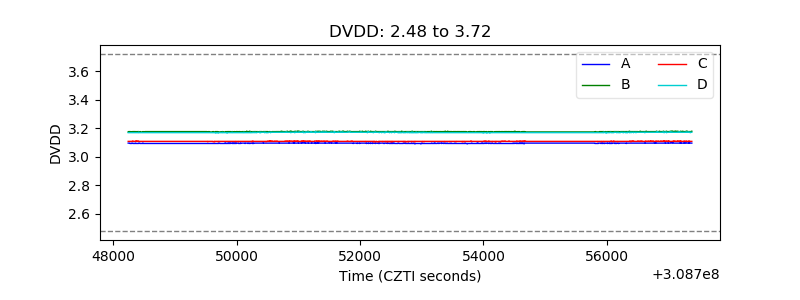 |
| Temperature 1 | 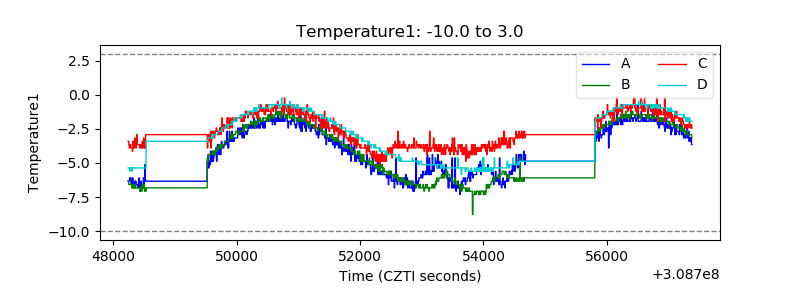 |
| Veto HV Monitor |  |
| Veto LLD | 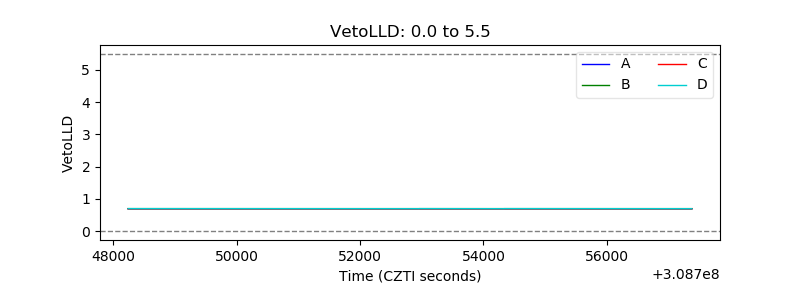 |
| Alpha Counter | 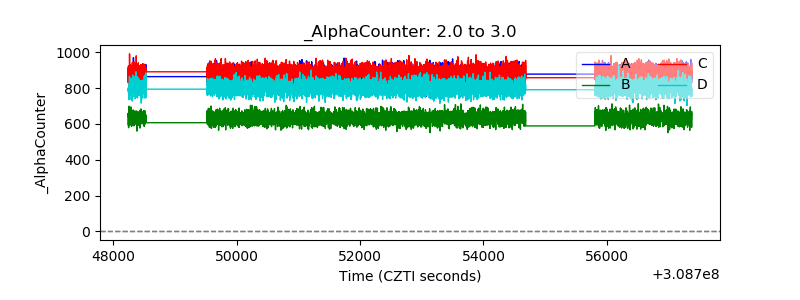 |
| _CPM_Rate | 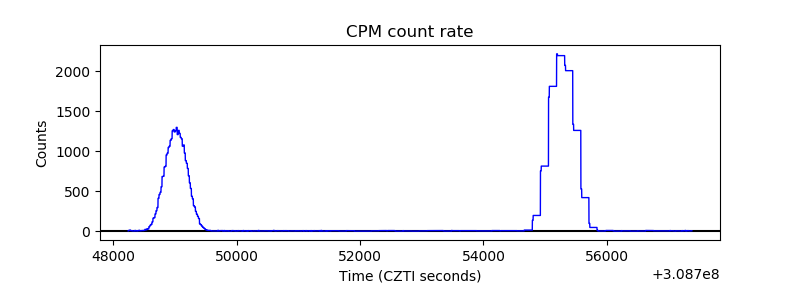 |
| CZT Counter | 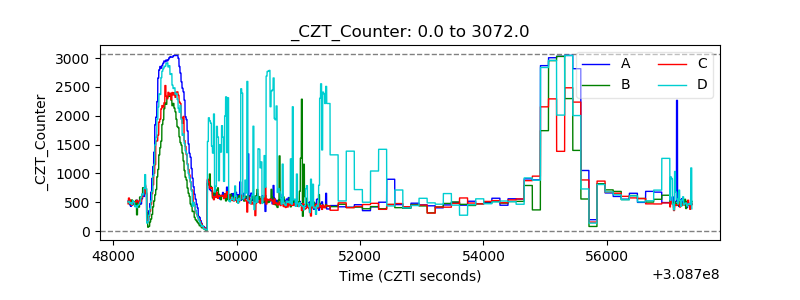 |
| +2.5 Volts monitor |  |
| +5 Volts monitor |  |
| _ROLL_ROT | 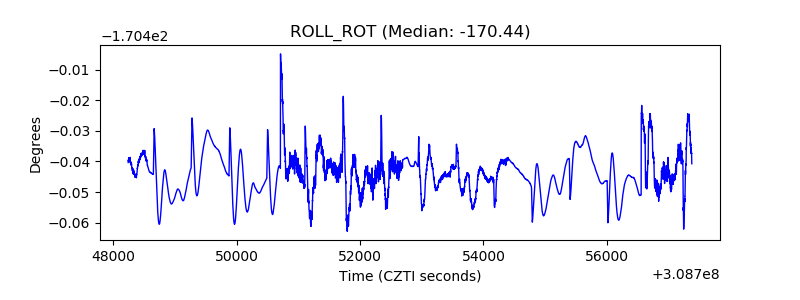 |
| _Roll_DEC | 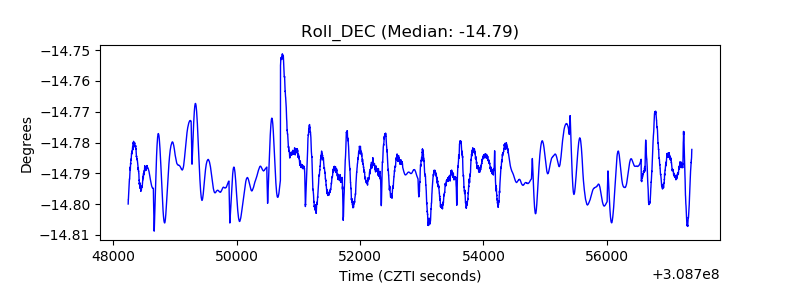 |
| _Roll_RA | 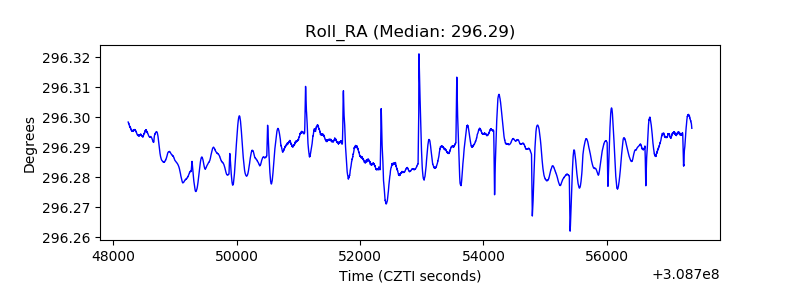 |
| Veto Counter | 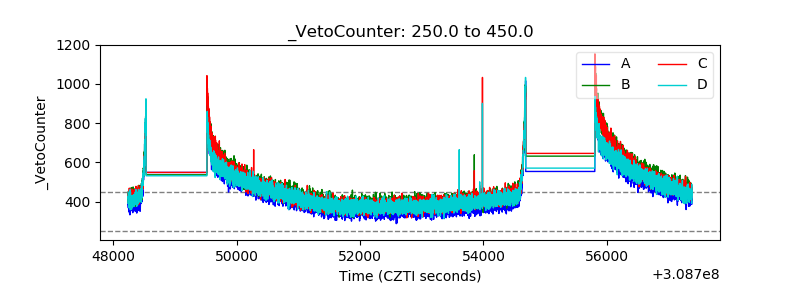 |