| Param | Original file | Final file |
|---|---|---|
| Filename | modeM0/AS1A07_118T01_9000003232_21869cztM0_level2.evt | modeM0/AS1A07_118T01_9000003232_21869cztM0_level2_quad_clean.evt |
| Size (bytes) | 472,999,680 | 106,110,720 |
| Size | 451.1 MB | 101.2 MB |
| Events in quadrant A | 3,474,041 | 704,445 |
| Events in quadrant B | 3,511,629 | 714,433 |
| Events in quadrant C | 3,307,886 | 679,520 |
| Events in quadrant D | 3,589,513 | 661,358 |
| Mode SS | |||
|---|---|---|---|
| Quadrant | BADHDUFLAG | Total packets | Discarded packets |
| A | 0 | 132 | 0 |
| B | 0 | 132 | 0 |
| C | 0 | 132 | 0 |
| D | 0 | 132 | 0 |
| Mode M9 | |||
|---|---|---|---|
| Quadrant | BADHDUFLAG | Total packets | Discarded packets |
| A | 0 | 12 | 0 |
| B | 0 | 13 | 0 |
| C | 0 | 13 | 0 |
| D | 0 | 13 | 0 |
| Mode M0 | |||
|---|---|---|---|
| Quadrant | BADHDUFLAG | Total packets | Discarded packets |
| A | 0 | 14542 | 2 |
| B | 0 | 14685 | 2 |
| C | 0 | 13974 | 2 |
| D | 0 | 14984 | 2 |
| Quadrant | Total seconds | Saturated seconds | Saturation percentage |
|---|---|---|---|
| A | 6508 | 74 | 1.137062% |
| B | 6508 | 77 | 1.183159% |
| C | 6508 | 99 | 1.521205% |
| D | 6508 | 71 | 1.090965% |
Noise dominated data is calculated using 1-second bins in cleaned event files. If a bin has >2000 counts, and if more than 50% of those come from <1% of pixels, then it is considered to be noise-dominated and hence unusable.
| Quadrant | # 1 sec bins | Bins with >0 counts | Bins with >2000 counts | High rate bins dominated by noise | Noise dominated (total time) | Noise dominated (detector-on time) | Marked lightcurve |
|---|---|---|---|---|---|---|---|
| A | 7749 | 6508 | 4 | 4 | 0.05% | 0.06% | 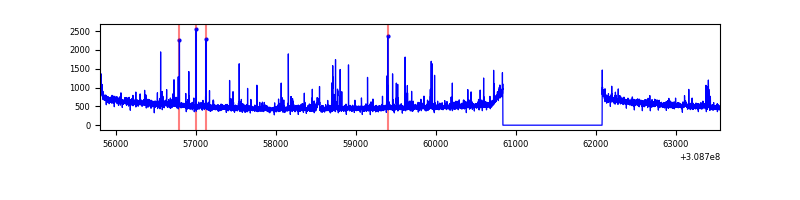 |
| B | 7749 | 6508 | 10 | 10 | 0.13% | 0.15% | 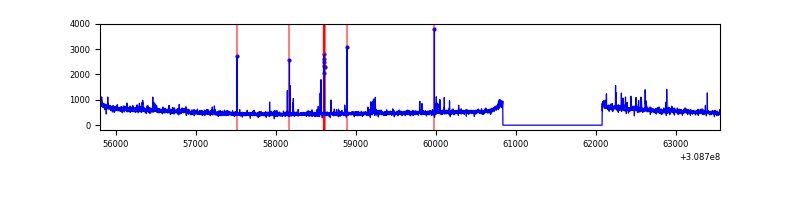 |
| C | 7749 | 6508 | 0 | 0 | 0.00% | 0.00% | 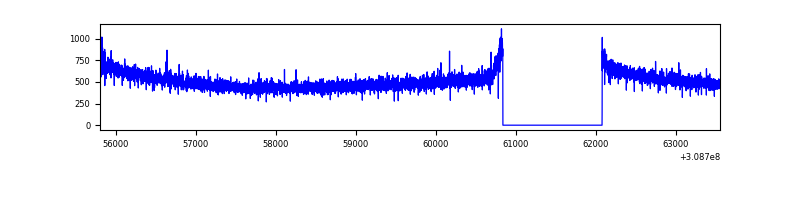 |
| D | 7749 | 6508 | 17 | 17 | 0.22% | 0.26% | 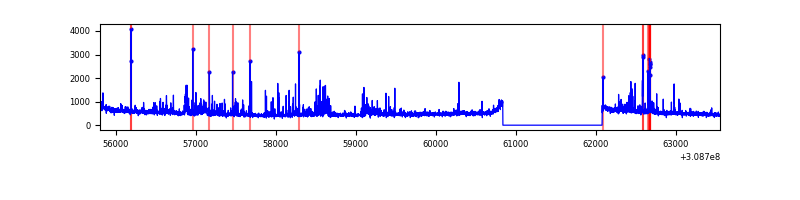 |
Top three noisy pixels from each quadrant. If the there are fewer than three noisy pixels in the level2.evt file, extra rows are filled as -1
| Pixel properties | Quadrant properties | ||||||
|---|---|---|---|---|---|---|---|
| Quadrant | DetID | PixID | Counts | Sigma | Mean | Median | Sigma |
| A | 6 | 16 | 84260 | 480.36 | 863 | 847 | 173.6 |
| A | 4 | 2 | 33838 | 189.99 | 863 | 847 | 173.6 |
| A | 5 | 16 | 26283 | 146.48 | 863 | 847 | 173.6 |
| B | 3 | 64 | 63644 | 392.44 | 857 | 839 | 160.0 |
| B | 0 | 190 | 35176 | 214.55 | 857 | 839 | 160.0 |
| B | 0 | 230 | 26215 | 158.56 | 857 | 839 | 160.0 |
| C | 14 | 238 | 129184 | 677.35 | 815 | 820 | 189.5 |
| C | 13 | 61 | 5570 | 25.06 | 815 | 820 | 189.5 |
| C | 4 | 191 | 2295 | 7.78 | 815 | 820 | 189.5 |
| D | 2 | 136 | 143707 | 712.6 | 829 | 806 | 200.5 |
| D | 1 | 52 | 139538 | 691.81 | 829 | 806 | 200.5 |
| D | 13 | 172 | 49279 | 241.72 | 829 | 806 | 200.5 |
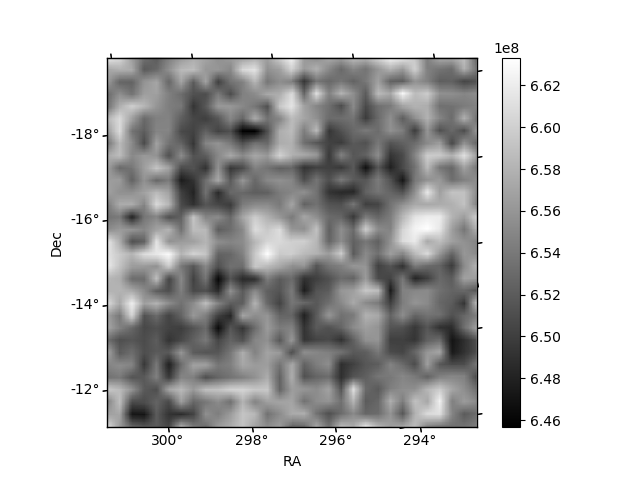
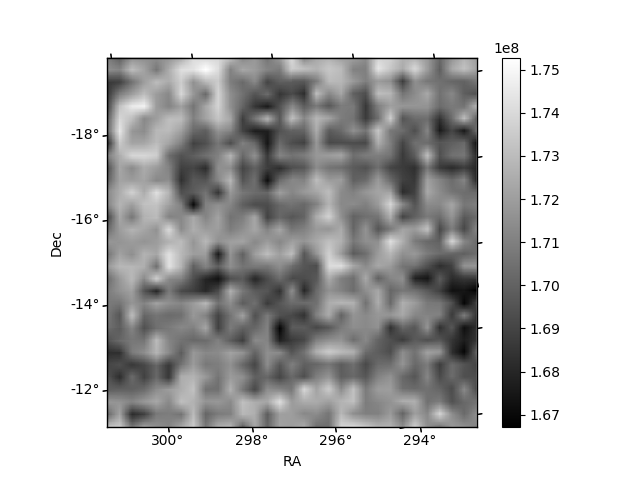
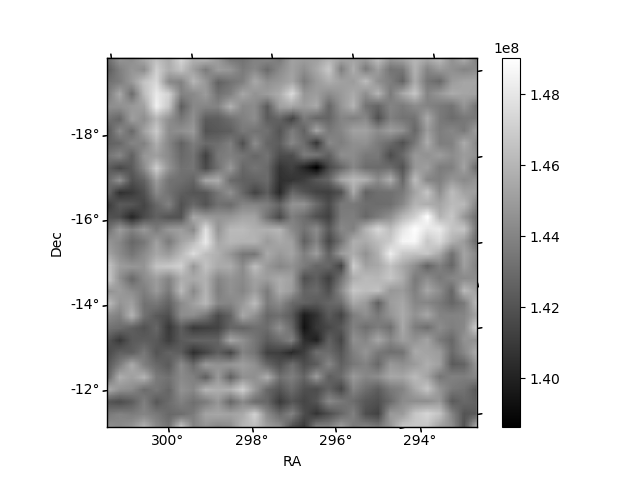
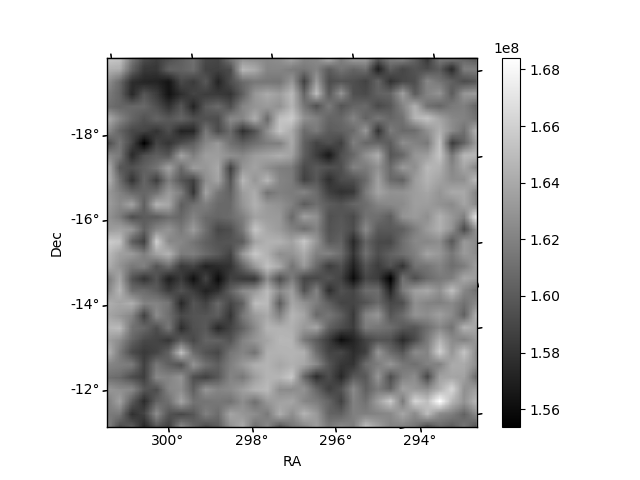
Histogram calculated using DETX and DETY for each event in the final _common_clean file
| Quadrant A | 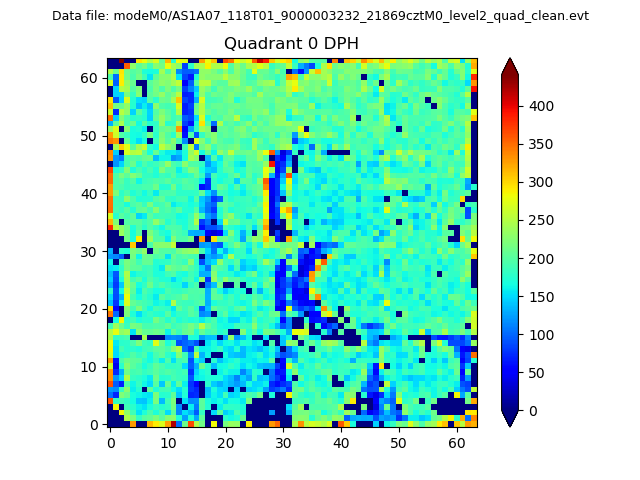 |
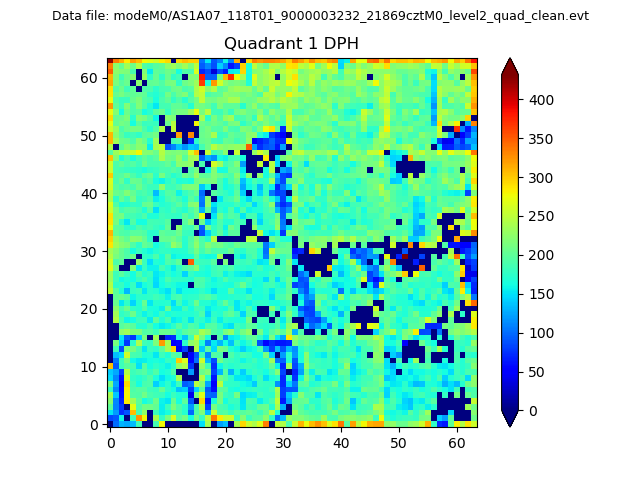 |
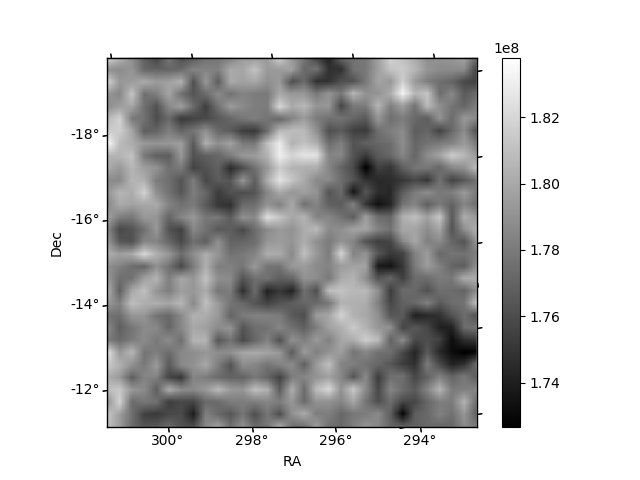
Quadrant B |
|---|---|---|---|
| Quadrant D | 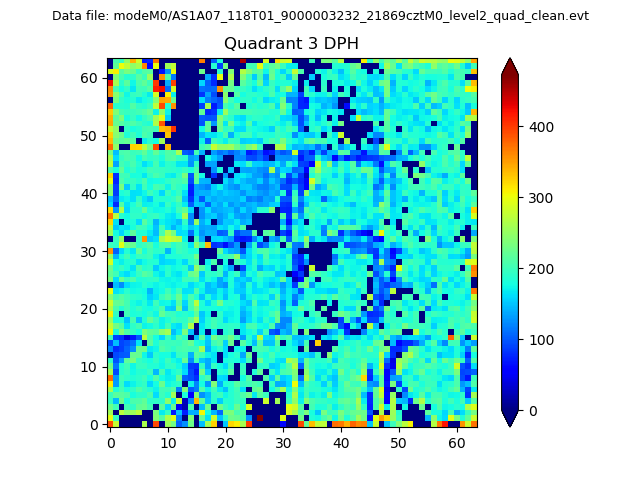 |
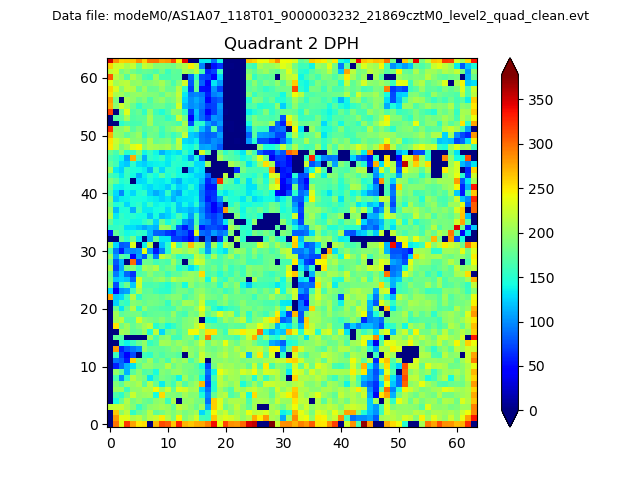 |
Quadrant C |
| Plot type | Count rate plots | Images |
|---|---|---|
| Comparison with Poisson distribution Blue bars denote a histogram of data divided into 1 sec bins. Red curve is a Poisson curve with rate = median count rate of data. |
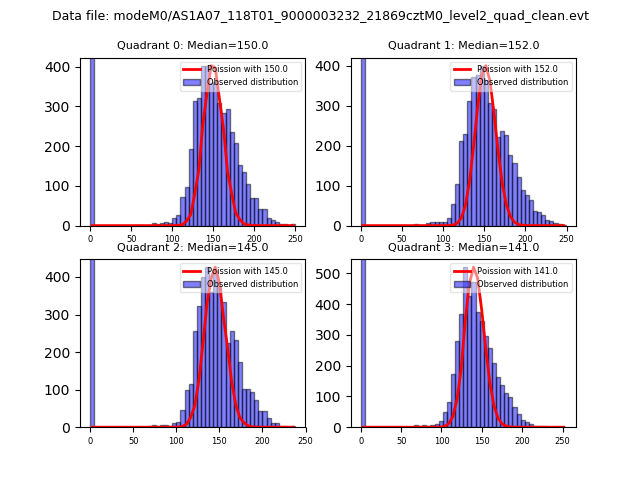 |
 |
| Quadrant-wise count rates Data is divided into 100 sec bins |
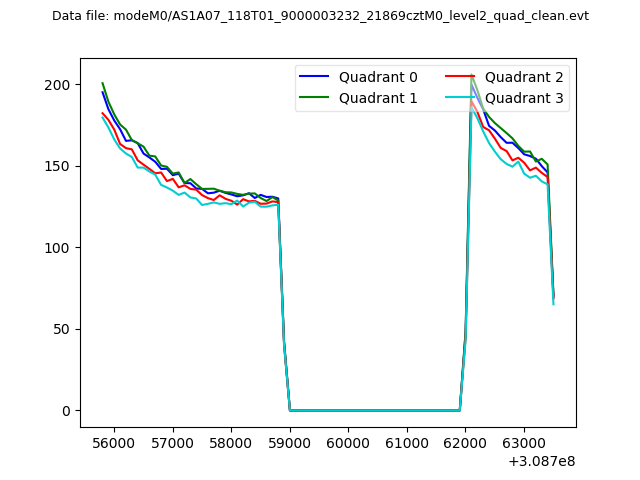 |
|
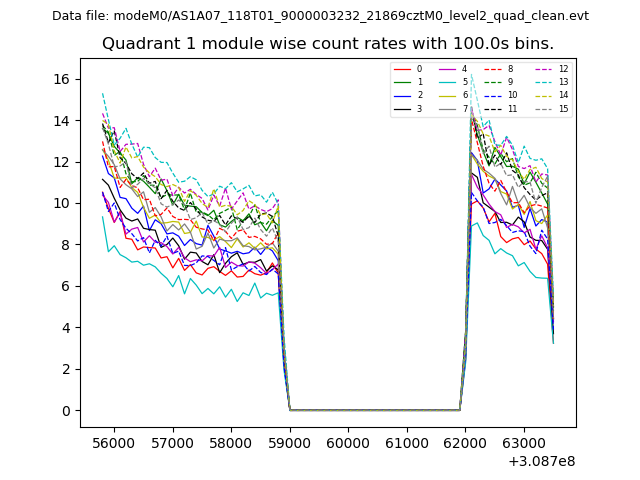
| Module-wise count rates for Quadrant A Data is divided into 100 sec bins |
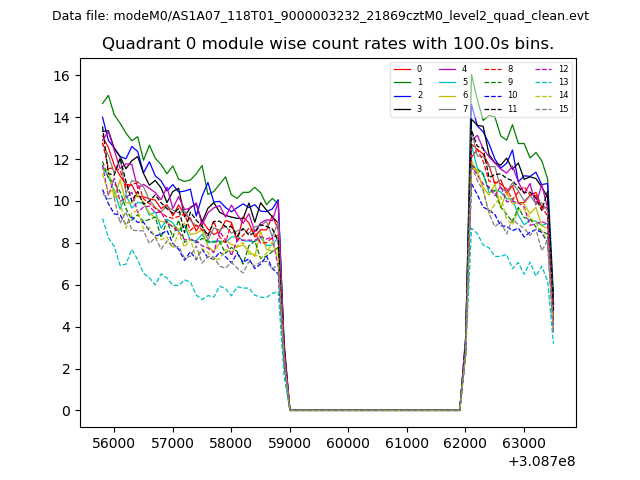 |
 |
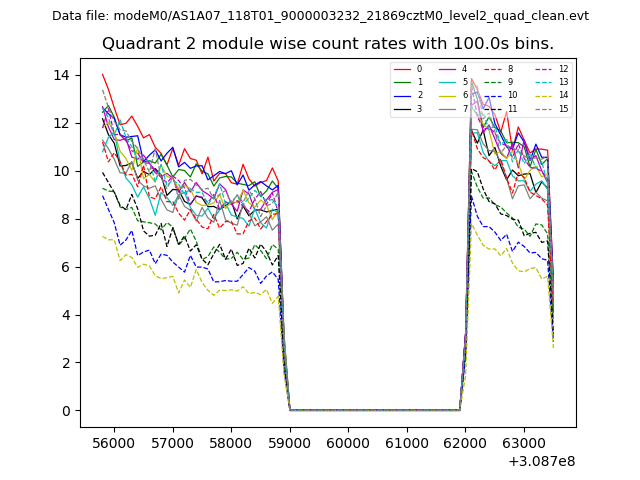
| Module-wise count rates for Quadrant B Data is divided into 100 sec bins |
 |
 |
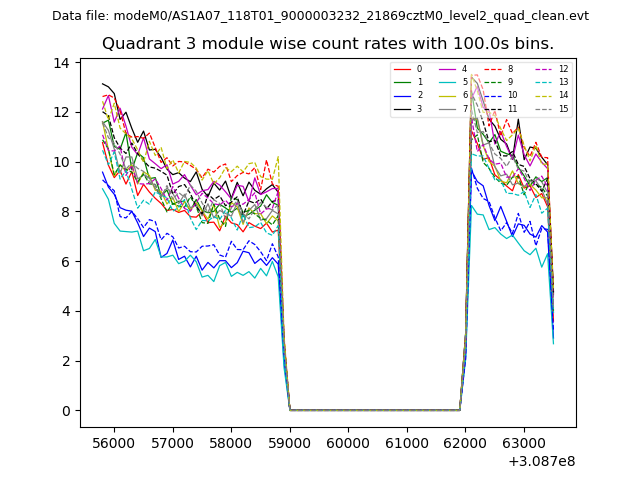
| Module-wise count rates for Quadrant C Data is divided into 100 sec bins |
 |
 |
| Module-wise count rates for Quadrant D Data is divided into 100 sec bins |
 |
 |
| Parameter | Plot |
|---|---|
| CZT HV Monitor |  |
| D_VDD | 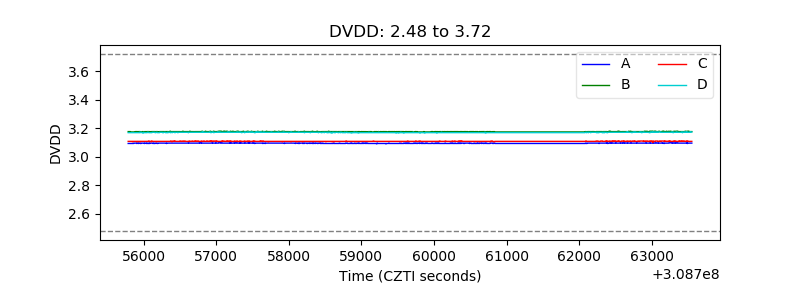 |
| Temperature 1 | 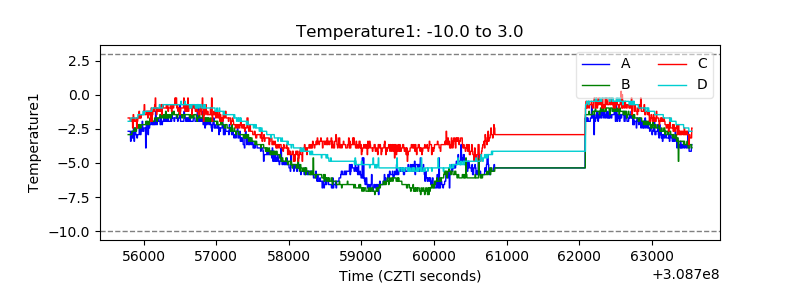 |
| Veto HV Monitor | 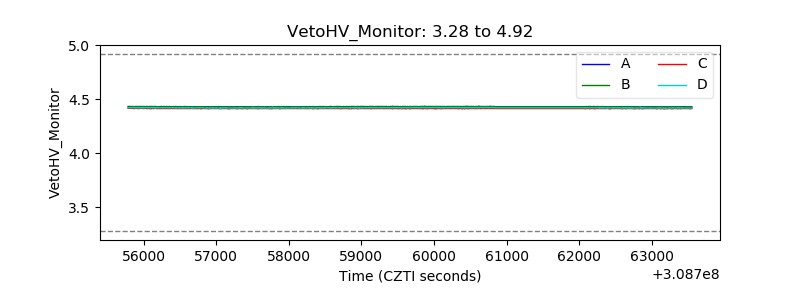 |
| Veto LLD | 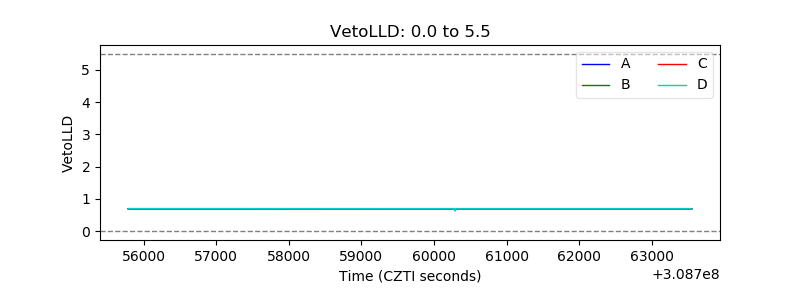 |
| Alpha Counter | 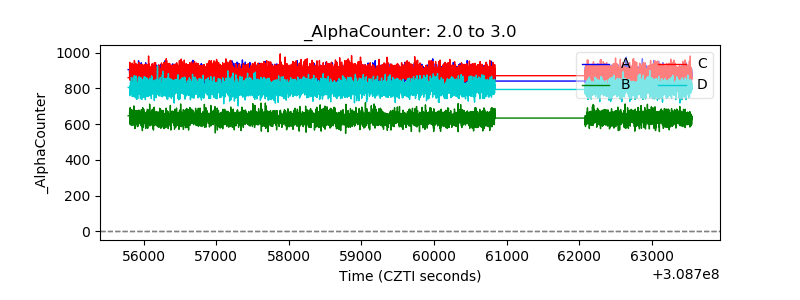 |
| _CPM_Rate | 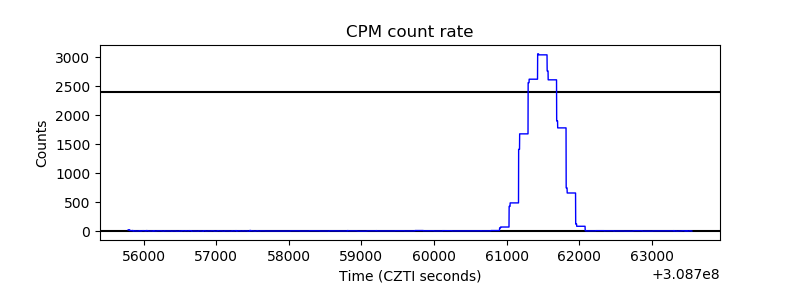 |
| CZT Counter | 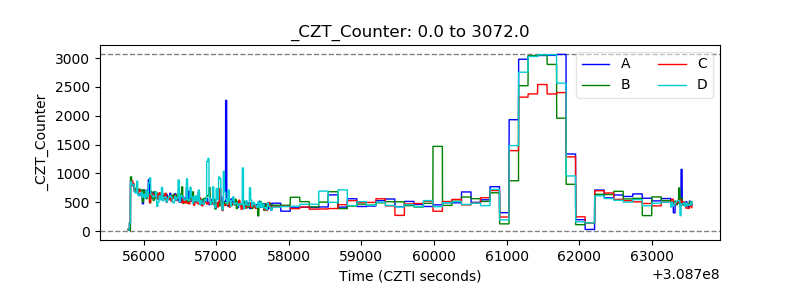 |
| +2.5 Volts monitor |  |
| +5 Volts monitor | 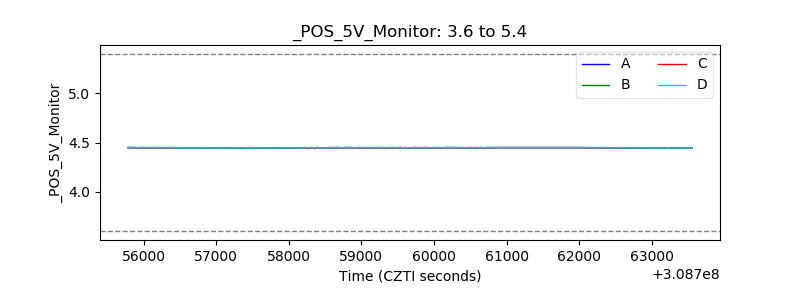 |
| _ROLL_ROT | 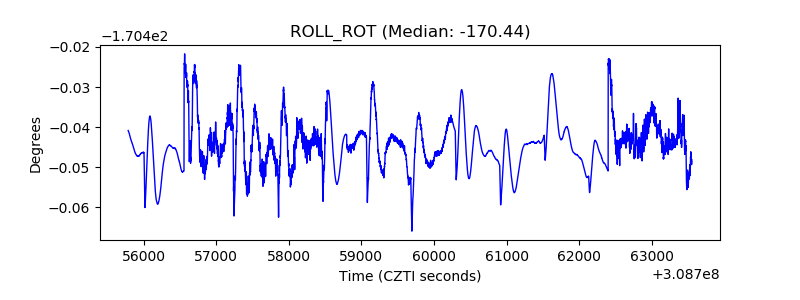 |
| _Roll_DEC |  |
| _Roll_RA | 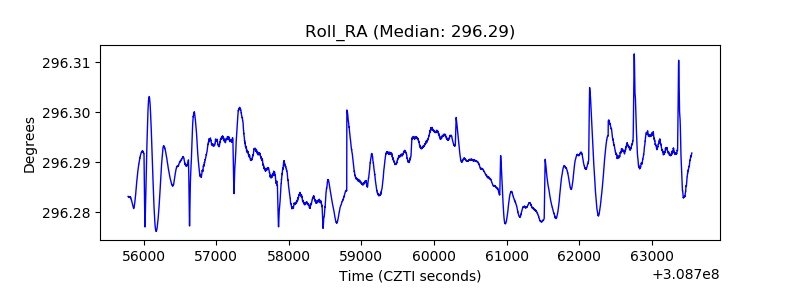 |
| Veto Counter | 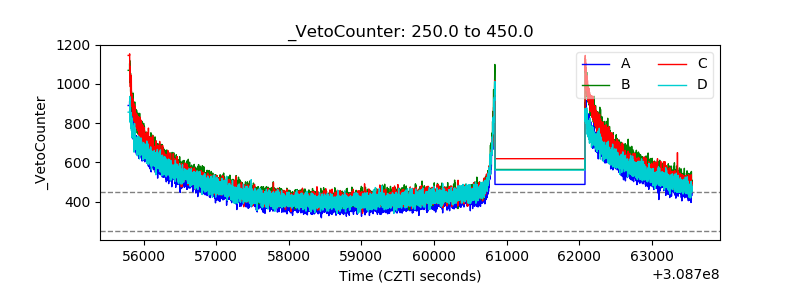 |