| Param | Original file | Final file |
|---|---|---|
| Filename | modeM0/AS1A07_041T01_9000003234cztM0_level2.fits | modeM0/AS1A07_041T01_9000003234cztM0_level2_quad_clean.evt |
| Size (bytes) | 917,853,120 | 765,325,440 |
| Size | 875.3 MB | 729.9 MB |
| Events in quadrant A | 4,750,702 | 4,326,542 |
| Events in quadrant B | 4,551,620 | 4,354,273 |
| Events in quadrant C | 9,093,487 | 5,287,146 |
| Events in quadrant D | 3,969,634 | 3,777,887 |
| Mode SS | |||
|---|---|---|---|
| Quadrant | BADHDUFLAG | Total packets | Discarded packets |
| A | 0 | 1622 | 0 |
| B | 0 | 1620 | 0 |
| C | 0 | 1655 | 0 |
| D | 0 | 1645 | 0 |
| Mode M9 | |||
|---|---|---|---|
| Quadrant | BADHDUFLAG | Total packets | Discarded packets |
| A | 0 | 127 | 0 |
| B | 0 | 126 | 0 |
| C | 0 | 130 | 0 |
| D | 0 | 126 | 0 |
| Mode M0 | |||
|---|---|---|---|
| Quadrant | BADHDUFLAG | Total packets | Discarded packets |
| A | 0 | 166764 | 0 |
| B | 0 | 171262 | 0 |
| C | 0 | 161356 | 0 |
| D | 0 | 197014 | 0 |
| Quadrant | Total seconds | Saturated seconds | Saturation percentage |
|---|---|---|---|
| A | 79892 | 736 | 0.921244% |
| B | 79854 | 949 | 1.188419% |
| C | 77015 | 1237 | 1.606181% |
| D | 79854 | 2455 | 3.074361% |
Noise dominated data is calculated using 1-second bins in cleaned event files. If a bin has >2000 counts, and if more than 50% of those come from <1% of pixels, then it is considered to be noise-dominated and hence unusable.
| Quadrant | # 1 sec bins | Bins with >0 counts | Bins with >2000 counts | High rate bins dominated by noise | Noise dominated (total time) | Noise dominated (detector-on time) | Marked lightcurve |
|---|---|---|---|---|---|---|---|
| A | 97851 | 80844 | 0 | 0 | 0.00% | 0.00% |  |
| B | 97851 | 80824 | 0 | 0 | 0.00% | 0.00% |  |
| C | 97851 | 78040 | 0 | 0 | 0.00% | 0.00% |  |
| D | 97851 | 80822 | 0 | 0 | 0.00% | 0.00% |  |
Top three noisy pixels from each quadrant. If the there are fewer than three noisy pixels in the level2.evt file, extra rows are filled as -1
| Pixel properties | Quadrant properties | ||||||
|---|---|---|---|---|---|---|---|
| Quadrant | DetID | PixID | Counts | Sigma | Mean | Median | Sigma |
| A | 0 | 29 | 4822 | 11.89 | 1237 | 1162 | 307.8 |
| A | 7 | 110 | 3813 | 8.61 | 1237 | 1162 | 307.8 |
| A | 0 | 30 | 3810 | 8.6 | 1237 | 1162 | 307.8 |
| B | 2 | 9 | 3679 | 10.69 | 1206 | 1155 | 236.1 |
| B | 2 | 8 | 3089 | 8.19 | 1206 | 1155 | 236.1 |
| B | 14 | 254 | 2931 | 7.52 | 1206 | 1155 | 236.1 |
| C | 9 | 209 | 5583 | 6.16 | 2426 | 2408 | 515.7 |
| C | 2 | 254 | 5323 | 5.65 | 2426 | 2408 | 515.7 |
| C | 3 | 203 | 5090 | 5.2 | 2426 | 2408 | 515.7 |
| D | 15 | 46 | 2815 | 5.94 | 1134 | 1031 | 300.4 |
| D | 6 | 231 | 2797 | 5.88 | 1134 | 1031 | 300.4 |
| D | 7 | 3 | 2764 | 5.77 | 1134 | 1031 | 300.4 |
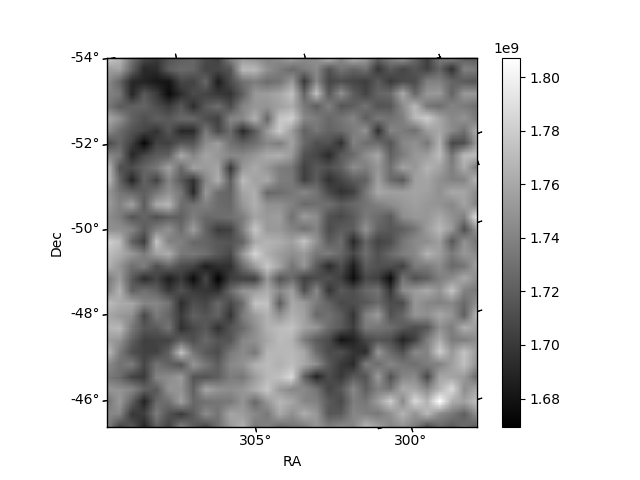
Histogram calculated using DETX and DETY for each event in the final _common_clean file
| Quadrant A |  |
 |
Quadrant B |
|---|---|---|---|
| Quadrant D |  |
 |
Quadrant C |
| Plot type | Count rate plots | Images |
|---|---|---|
| Comparison with Poisson distribution Blue bars denote a histogram of data divided into 1 sec bins. Red curve is a Poisson curve with rate = median count rate of data. |
 |
 |
| Quadrant-wise count rates Data is divided into 100 sec bins |
 |
|
| Module-wise count rates for Quadrant A Data is divided into 100 sec bins |
 |
 |
| Module-wise count rates for Quadrant B Data is divided into 100 sec bins |
 |
 |
| Module-wise count rates for Quadrant C Data is divided into 100 sec bins |
 |
 |
| Module-wise count rates for Quadrant D Data is divided into 100 sec bins |
 |
 |
| Parameter | Plot |
|---|---|
| CZT HV Monitor |  |
| D_VDD | 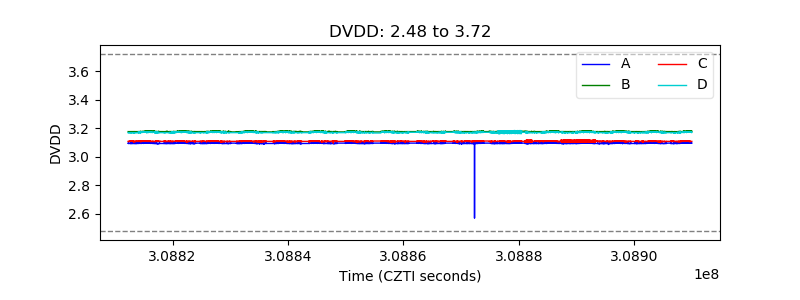 |
| Temperature 1 |  |
| Veto HV Monitor |  |
| Veto LLD |  |
| Alpha Counter |  |
| _CPM_Rate |  |
| CZT Counter |  |
| +2.5 Volts monitor |  |
| +5 Volts monitor |  |
| _ROLL_ROT |  |
| _Roll_DEC |  |
| _Roll_RA |  |
| Veto Counter |  |