| Param | Original file | Final file |
|---|---|---|
| Filename | modeM0/AS1A07_041T01_9000003234_21879cztM0_level2.evt | modeM0/AS1A07_041T01_9000003234_21879cztM0_level2_quad_clean.evt |
| Size (bytes) | 271,247,040 | 53,913,600 |
| Size | 258.7 MB | 51.4 MB |
| Events in quadrant A | 1,881,564 | 333,116 |
| Events in quadrant B | 1,998,189 | 332,139 |
| Events in quadrant C | 1,901,648 | 350,055 |
| Events in quadrant D | 2,144,214 | 320,267 |
| Mode SS | |||
|---|---|---|---|
| Quadrant | BADHDUFLAG | Total packets | Discarded packets |
| A | 0 | 221 | 143 |
| B | 0 | 216 | 138 |
| C | 0 | 220 | 135 |
| D | 0 | 221 | 118 |
| Mode M9 | |||
|---|---|---|---|
| Quadrant | BADHDUFLAG | Total packets | Discarded packets |
| A | 0 | 8 | 5 |
| B | 0 | 7 | 6 |
| C | 0 | 9 | 9 |
| D | 0 | 10 | 9 |
| Mode M0 | |||
|---|---|---|---|
| Quadrant | BADHDUFLAG | Total packets | Discarded packets |
| A | 0 | 23003 | 14565 |
| B | 0 | 23096 | 14493 |
| C | 0 | 22286 | 13856 |
| D | 0 | 24264 | 15087 |
| Quadrant | Total seconds | Saturated seconds | Saturation percentage |
|---|---|---|---|
| A | 4190 | 4 | 0.095465% |
| B | 4197 | 13 | 0.309745% |
| C | 4205 | 20 | 0.475624% |
| D | 4155 | 58 | 1.395909% |
Noise dominated data is calculated using 1-second bins in cleaned event files. If a bin has >2000 counts, and if more than 50% of those come from <1% of pixels, then it is considered to be noise-dominated and hence unusable.
| Quadrant | # 1 sec bins | Bins with >0 counts | Bins with >2000 counts | High rate bins dominated by noise | Noise dominated (total time) | Noise dominated (detector-on time) | Marked lightcurve |
|---|---|---|---|---|---|---|---|
| A | 10203 | 5355 | 0 | 0 | 0.00% | 0.00% | 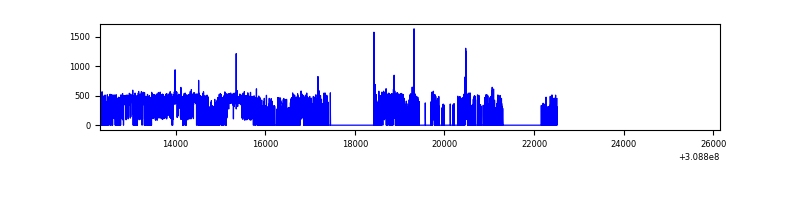 |
| B | 10222 | 5374 | 5 | 5 | 0.05% | 0.09% | 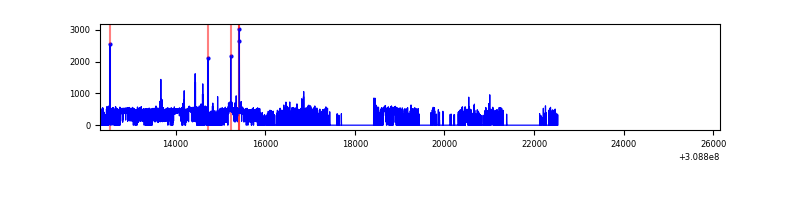 |
| C | 13841 | 5436 | 0 | 0 | 0.00% | 0.00% | 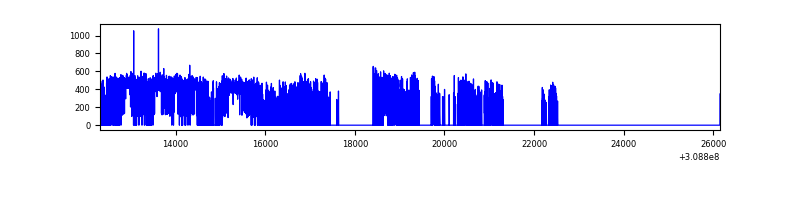 |
| D | 10229 | 5363 | 50 | 50 | 0.49% | 0.93% | 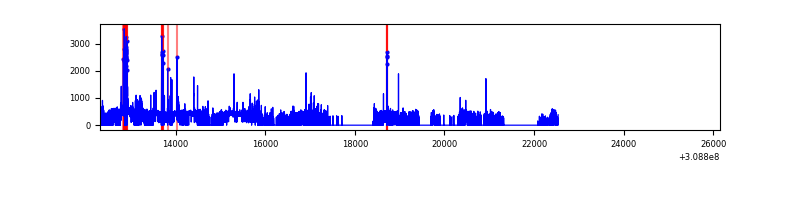 |
Top three noisy pixels from each quadrant. If the there are fewer than three noisy pixels in the level2.evt file, extra rows are filled as -1
| Pixel properties | Quadrant properties | ||||||
|---|---|---|---|---|---|---|---|
| Quadrant | DetID | PixID | Counts | Sigma | Mean | Median | Sigma |
| A | 5 | 16 | 16272 | 160.22 | 482 | 471 | 98.6 |
| A | 13 | 254 | 8031 | 76.66 | 482 | 471 | 98.6 |
| A | 0 | 226 | 4133 | 37.13 | 482 | 471 | 98.6 |
| B | 3 | 64 | 30675 | 320.56 | 482 | 469 | 94.2 |
| B | 0 | 230 | 25534 | 266.0 | 482 | 469 | 94.2 |
| B | 0 | 190 | 18062 | 186.7 | 482 | 469 | 94.2 |
| C | 14 | 238 | 74183 | 665.77 | 467 | 468 | 110.7 |
| C | 10 | 91 | 5070 | 41.56 | 467 | 468 | 110.7 |
| C | 13 | 61 | 3245 | 25.08 | 467 | 468 | 110.7 |
| D | 2 | 136 | 188071 | 1688.71 | 460 | 447 | 111.1 |
| D | 7 | 238 | 95748 | 857.76 | 460 | 447 | 111.1 |
| D | 1 | 52 | 70755 | 632.81 | 460 | 447 | 111.1 |
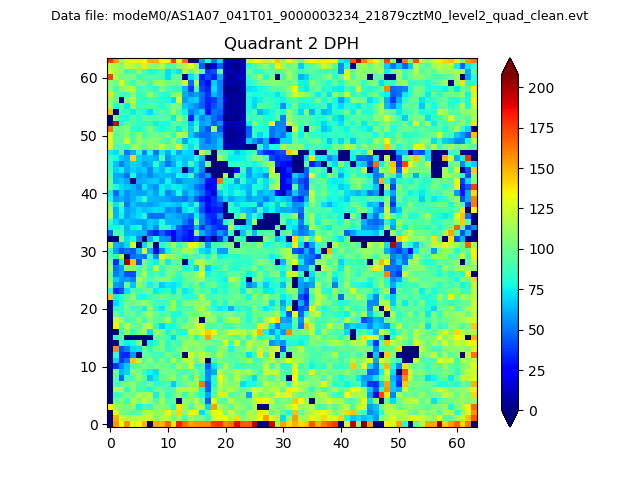
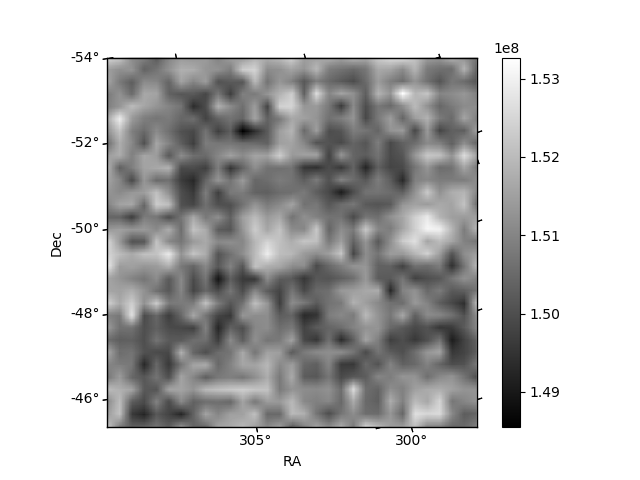
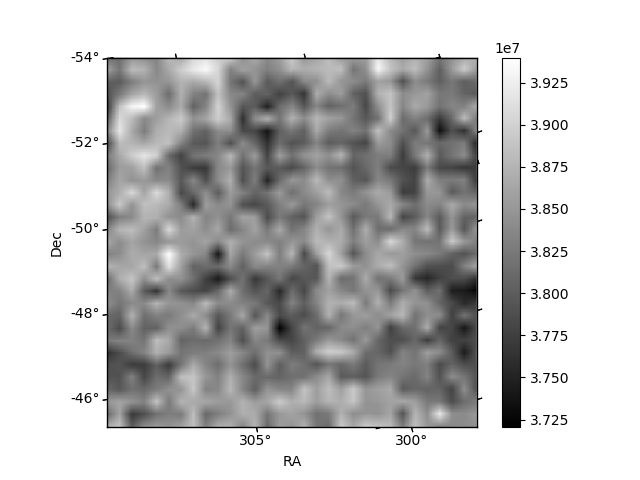
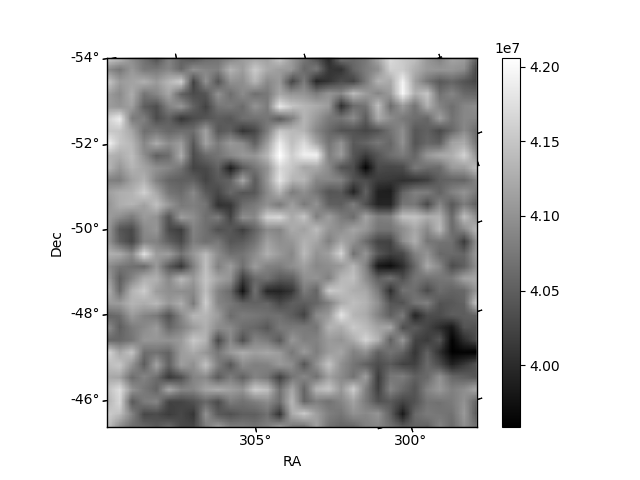
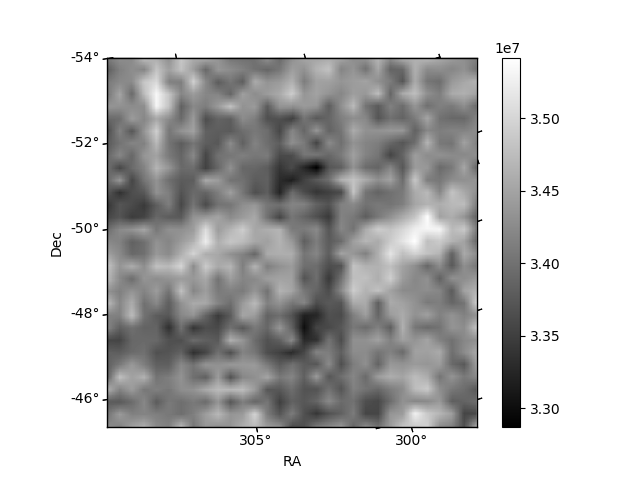
Histogram calculated using DETX and DETY for each event in the final _common_clean file
| Quadrant A | 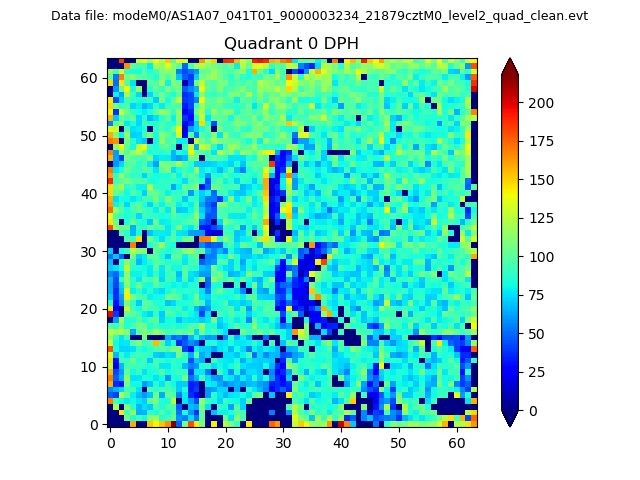 |
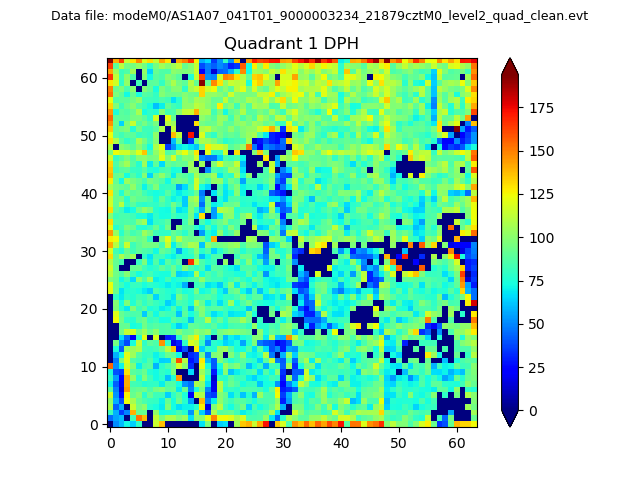 |
Quadrant B |
|---|---|---|---|
| Quadrant D | 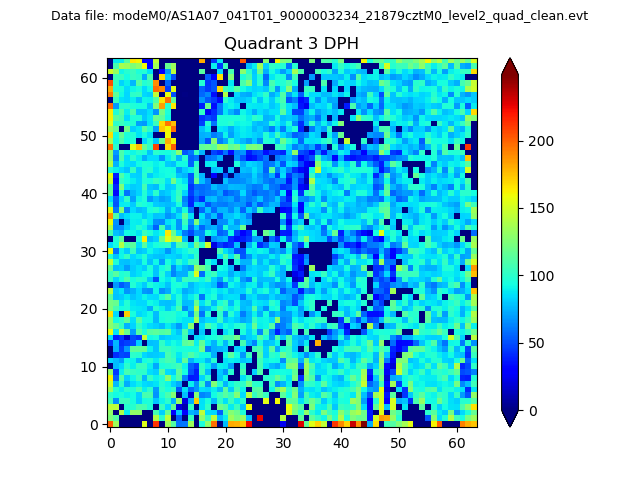 |
 |
Quadrant C |
| Plot type | Count rate plots | Images |
|---|---|---|
| Comparison with Poisson distribution Blue bars denote a histogram of data divided into 1 sec bins. Red curve is a Poisson curve with rate = median count rate of data. |
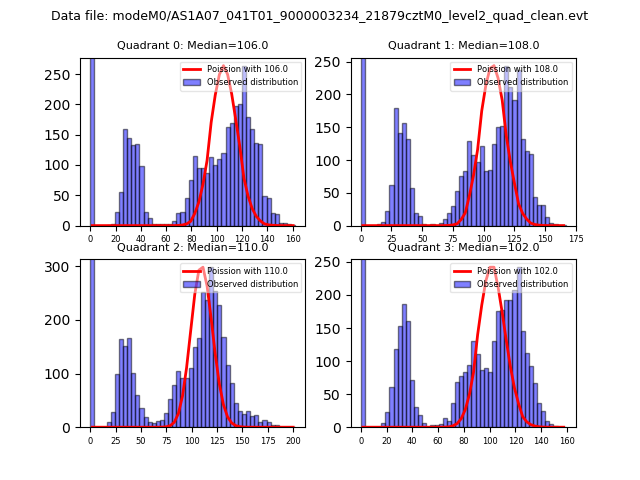 |
 |
| Quadrant-wise count rates Data is divided into 100 sec bins |
 |
|
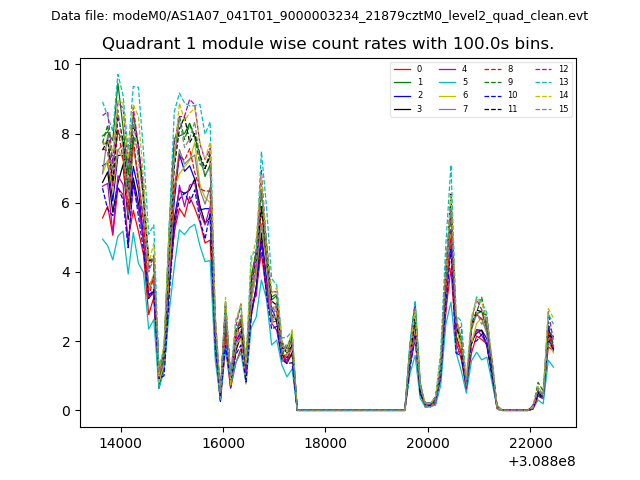
| Module-wise count rates for Quadrant A Data is divided into 100 sec bins |
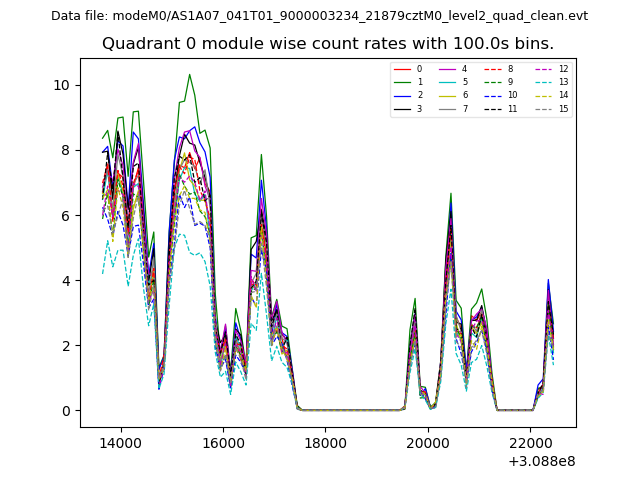 |
 |
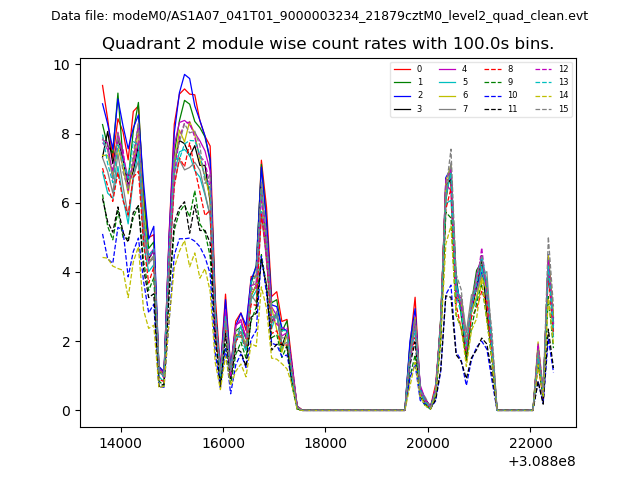
| Module-wise count rates for Quadrant B Data is divided into 100 sec bins |
 |
 |
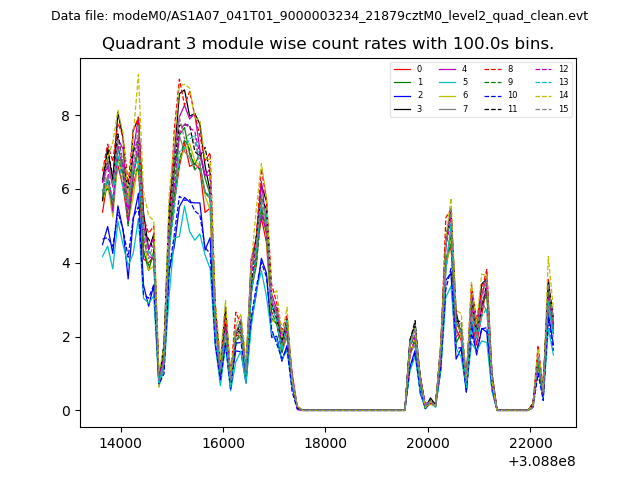
| Module-wise count rates for Quadrant C Data is divided into 100 sec bins |
 |
 |
| Module-wise count rates for Quadrant D Data is divided into 100 sec bins |
 |
 |
| Parameter | Plot |
|---|---|
| CZT HV Monitor | 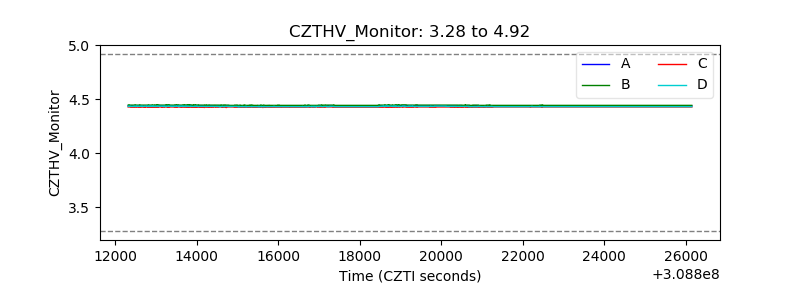 |
| D_VDD | 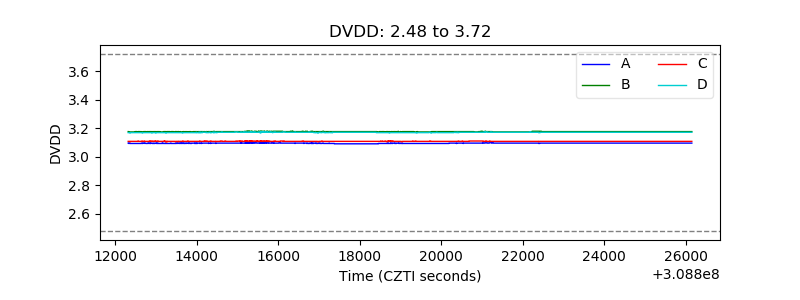 |
| Temperature 1 | 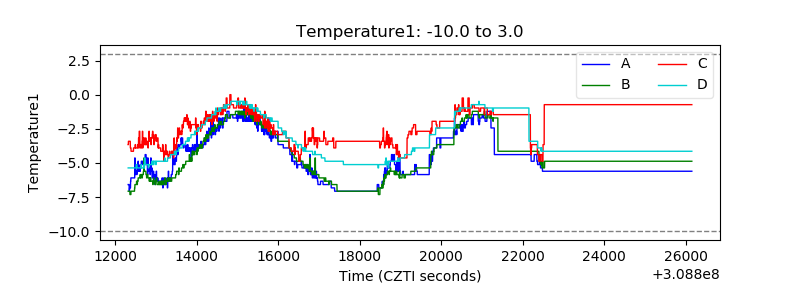 |
| Veto HV Monitor | 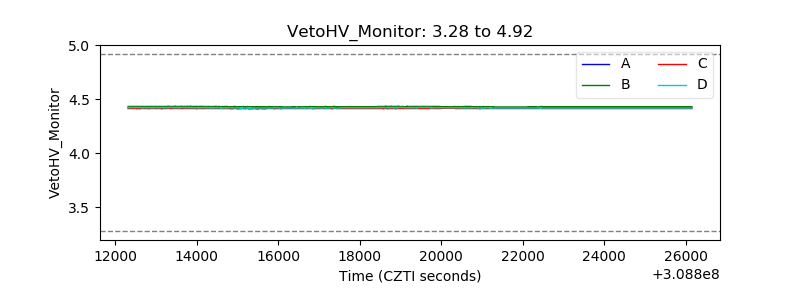 |
| Veto LLD | 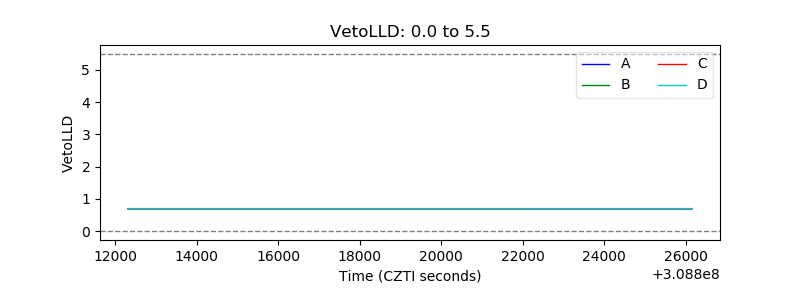 |
| Alpha Counter | 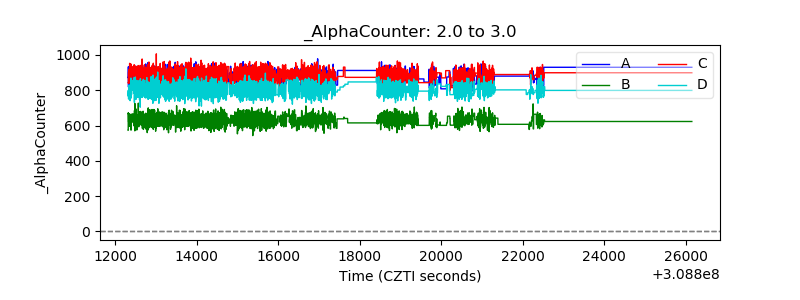 |
| _CPM_Rate | 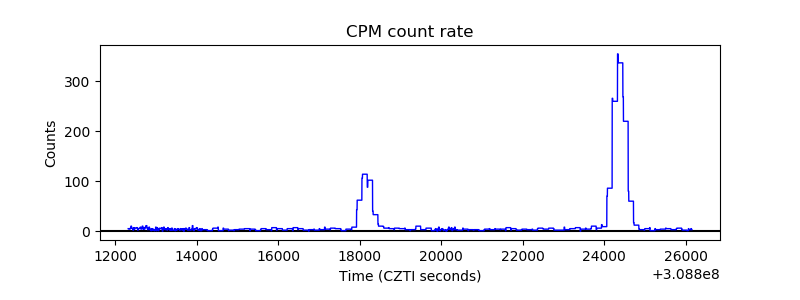 |
| CZT Counter | 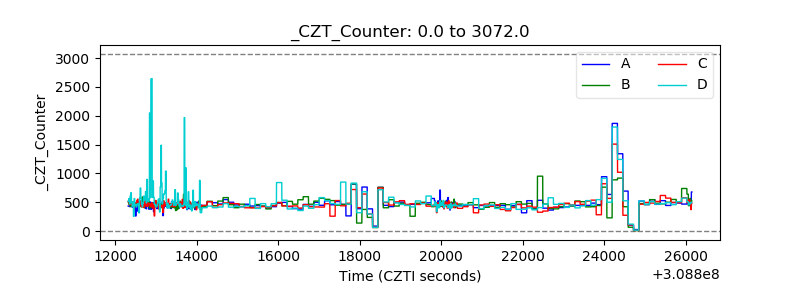 |
| +2.5 Volts monitor |  |
| +5 Volts monitor |  |
| _ROLL_ROT | 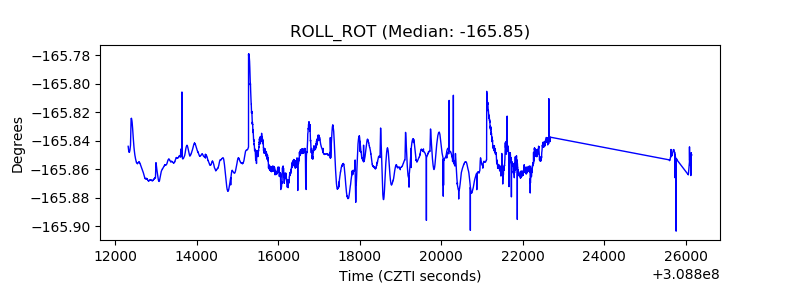 |
| _Roll_DEC | 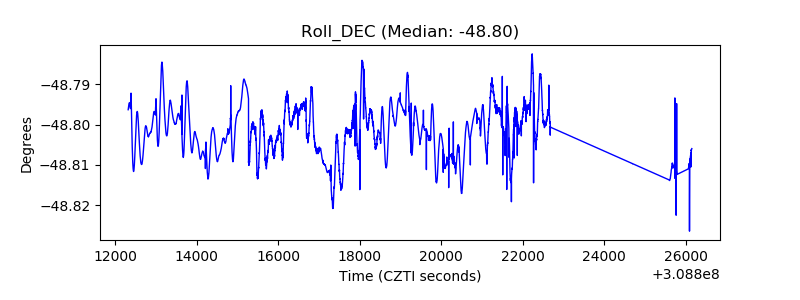 |
| _Roll_RA |  |
| Veto Counter | 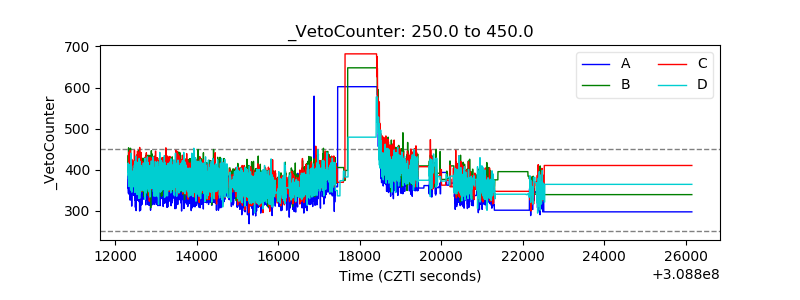 |