| Param | Original file | Final file |
|---|---|---|
| Filename | modeM0/AS1A07_041T01_9000003234_21880cztM0_level2.evt | modeM0/AS1A07_041T01_9000003234_21880cztM0_level2_quad_clean.evt |
| Size (bytes) | 410,474,880 | 98,665,920 |
| Size | 391.5 MB | 94.1 MB |
| Events in quadrant A | 2,814,306 | 647,674 |
| Events in quadrant B | 3,225,453 | 656,791 |
| Events in quadrant C | 2,825,487 | 639,916 |
| Events in quadrant D | 3,155,273 | 622,152 |
| Mode SS | |||
|---|---|---|---|
| Quadrant | BADHDUFLAG | Total packets | Discarded packets |
| A | 0 | 124 | 0 |
| B | 0 | 124 | 0 |
| C | 0 | 124 | 0 |
| D | 0 | 124 | 0 |
| Mode M9 | |||
|---|---|---|---|
| Quadrant | BADHDUFLAG | Total packets | Discarded packets |
| A | 0 | 9 | 0 |
| B | 0 | 9 | 0 |
| C | 0 | 9 | 0 |
| D | 0 | 9 | 0 |
| Mode M0 | |||
|---|---|---|---|
| Quadrant | BADHDUFLAG | Total packets | Discarded packets |
| A | 0 | 12354 | 1 |
| B | 0 | 13373 | 1 |
| C | 0 | 12383 | 1 |
| D | 0 | 13403 | 1 |
| Quadrant | Total seconds | Saturated seconds | Saturation percentage |
|---|---|---|---|
| A | 6033 | 33 | 0.546992% |
| B | 6034 | 63 | 1.044084% |
| C | 6033 | 65 | 1.077408% |
| D | 6033 | 80 | 1.326040% |
Noise dominated data is calculated using 1-second bins in cleaned event files. If a bin has >2000 counts, and if more than 50% of those come from <1% of pixels, then it is considered to be noise-dominated and hence unusable.
| Quadrant | # 1 sec bins | Bins with >0 counts | Bins with >2000 counts | High rate bins dominated by noise | Noise dominated (total time) | Noise dominated (detector-on time) | Marked lightcurve |
|---|---|---|---|---|---|---|---|
| A | 6998 | 6033 | 0 | 0 | 0.00% | 0.00% | 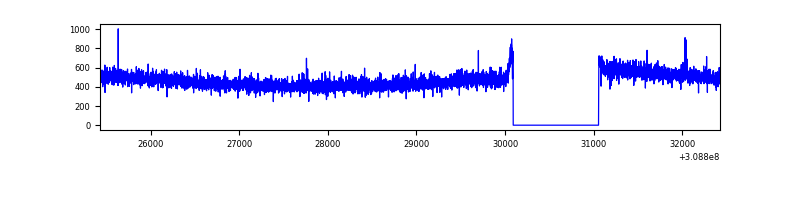 |
| B | 6999 | 6034 | 24 | 24 | 0.34% | 0.40% | 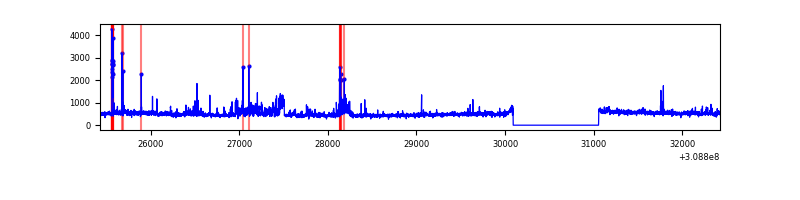 |
| C | 6998 | 6033 | 0 | 0 | 0.00% | 0.00% | 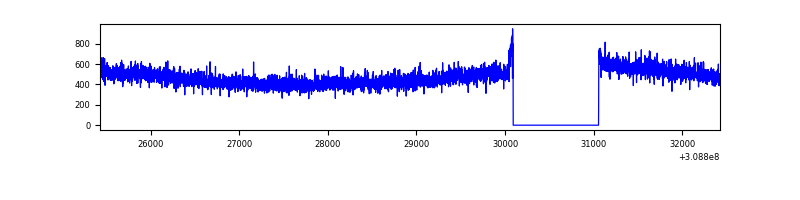 |
| D | 6998 | 6033 | 54 | 54 | 0.77% | 0.90% | 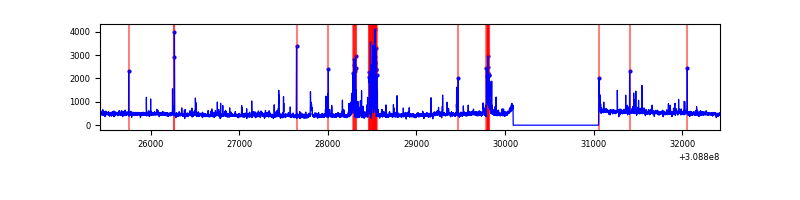 |
Top three noisy pixels from each quadrant. If the there are fewer than three noisy pixels in the level2.evt file, extra rows are filled as -1
| Pixel properties | Quadrant properties | ||||||
|---|---|---|---|---|---|---|---|
| Quadrant | DetID | PixID | Counts | Sigma | Mean | Median | Sigma |
| A | 13 | 254 | 10551 | 67.15 | 727 | 713 | 146.5 |
| A | 3 | 137 | 6214 | 37.55 | 727 | 713 | 146.5 |
| A | 0 | 226 | 6202 | 37.47 | 727 | 713 | 146.5 |
| B | 0 | 190 | 142546 | 1017.67 | 724 | 706 | 139.4 |
| B | 3 | 64 | 105030 | 748.5 | 724 | 706 | 139.4 |
| B | 0 | 197 | 46237 | 326.67 | 724 | 706 | 139.4 |
| C | 14 | 238 | 110097 | 670.35 | 697 | 701 | 163.2 |
| C | 13 | 61 | 4854 | 25.45 | 697 | 701 | 163.2 |
| C | 3 | 202 | 1695 | 6.09 | 697 | 701 | 163.2 |
| D | 1 | 52 | 338593 | 1941.49 | 707 | 684 | 174.0 |
| D | 2 | 234 | 25389 | 141.94 | 707 | 684 | 174.0 |
| D | 7 | 238 | 22921 | 127.76 | 707 | 684 | 174.0 |
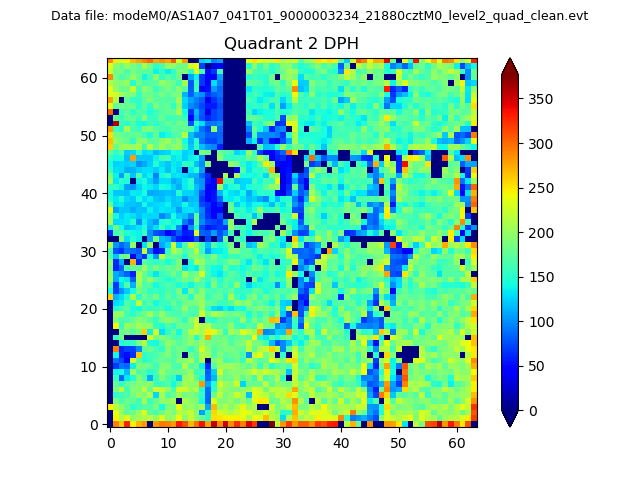
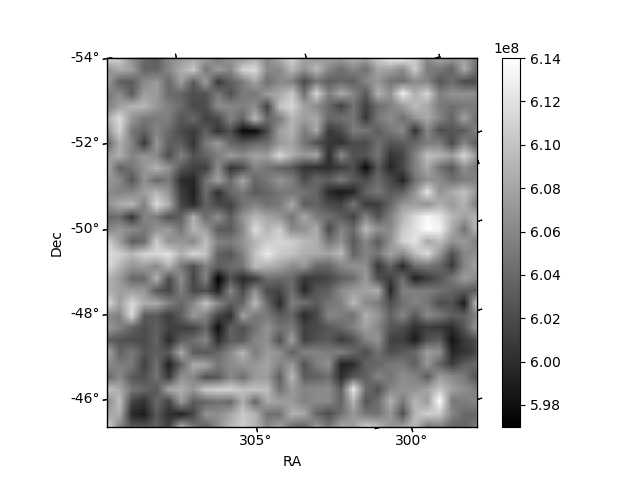
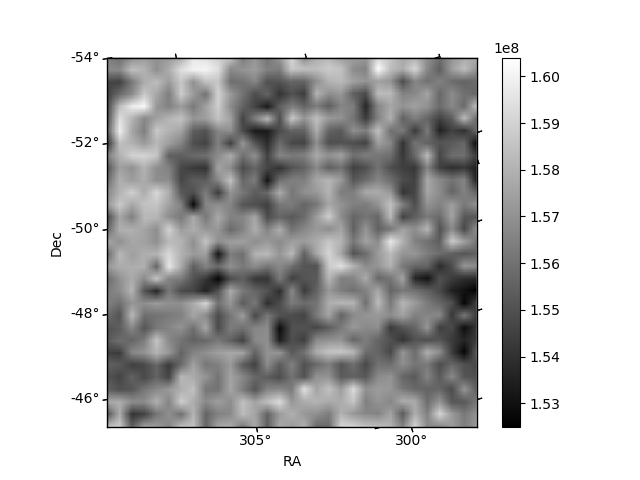
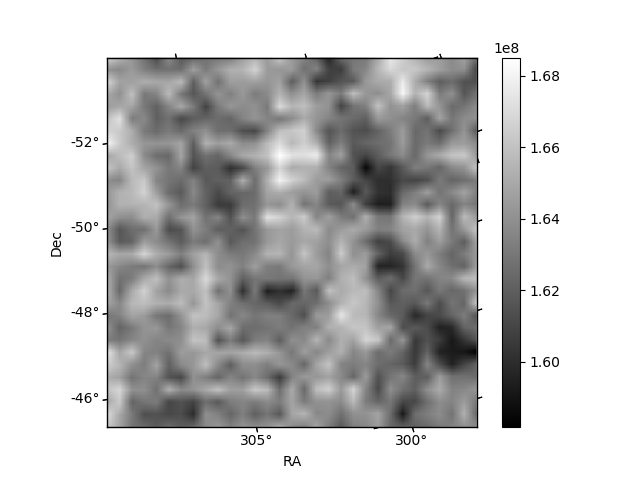
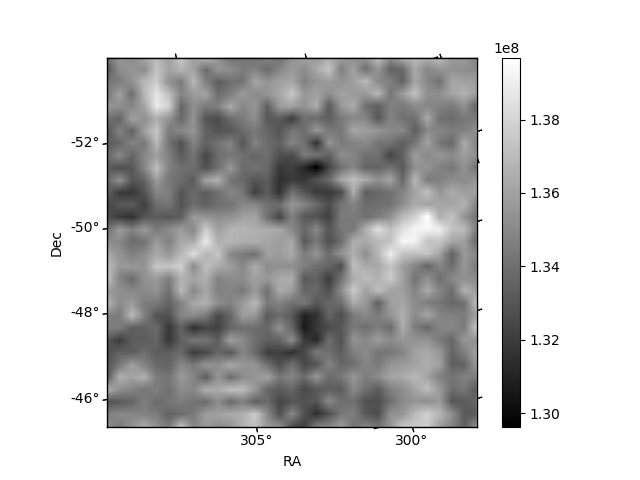
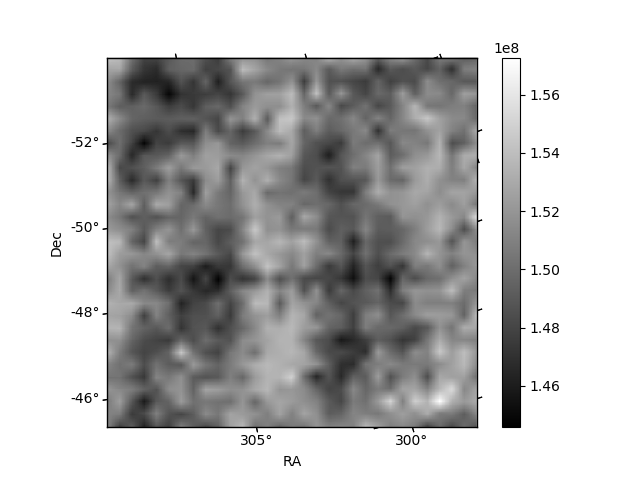
Histogram calculated using DETX and DETY for each event in the final _common_clean file
| Quadrant A | 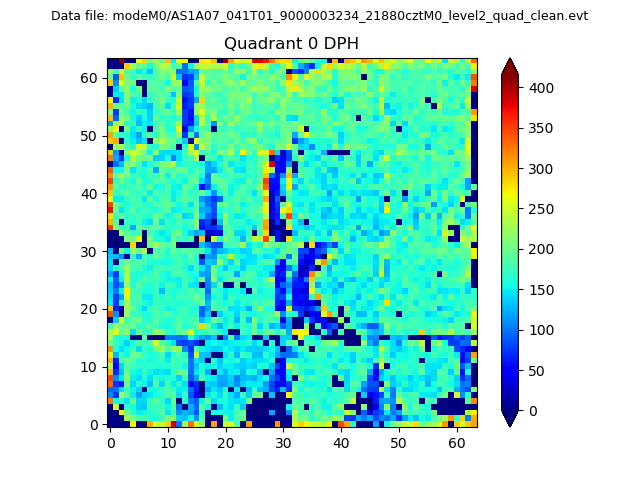 |
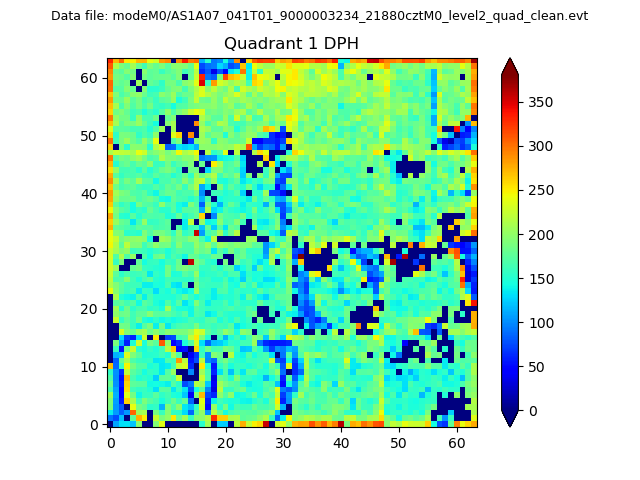 |
Quadrant B |
|---|---|---|---|
| Quadrant D | 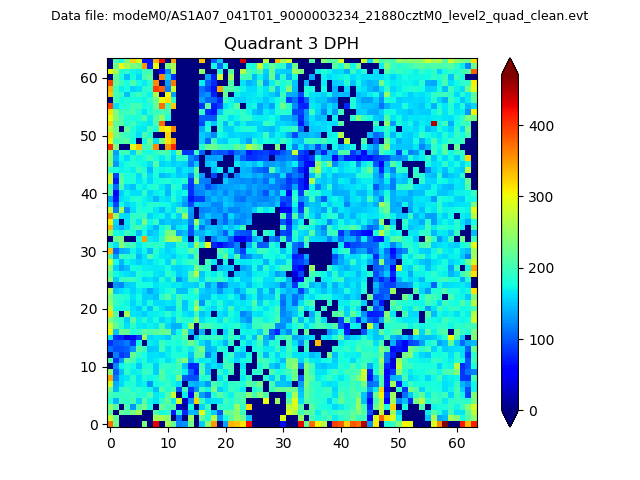 |
 |
Quadrant C |
| Plot type | Count rate plots | Images |
|---|---|---|
| Comparison with Poisson distribution Blue bars denote a histogram of data divided into 1 sec bins. Red curve is a Poisson curve with rate = median count rate of data. |
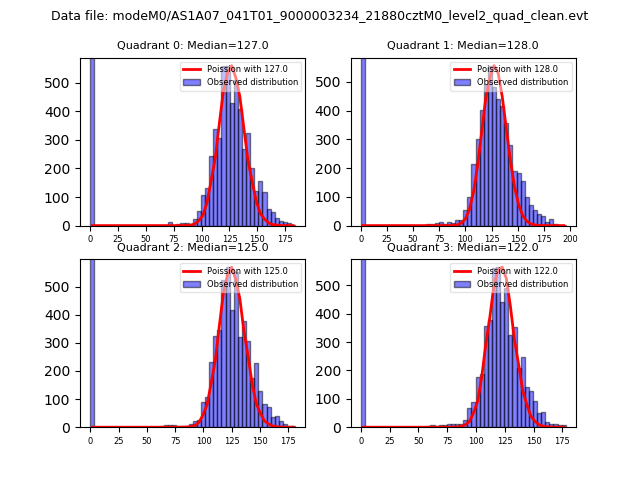 |
 |
| Quadrant-wise count rates Data is divided into 100 sec bins |
 |
|
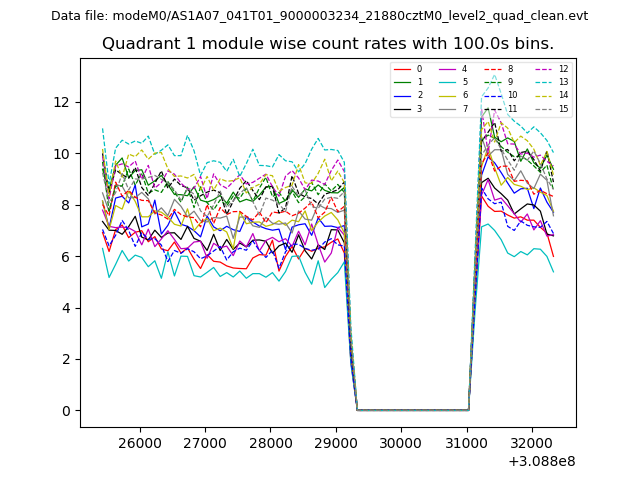
| Module-wise count rates for Quadrant A Data is divided into 100 sec bins |
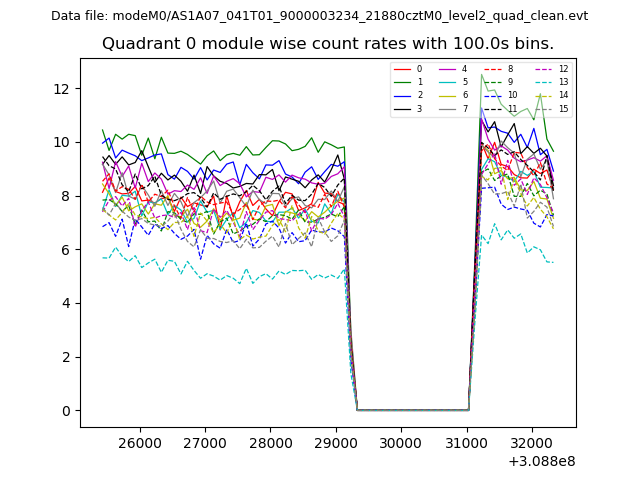 |
 |
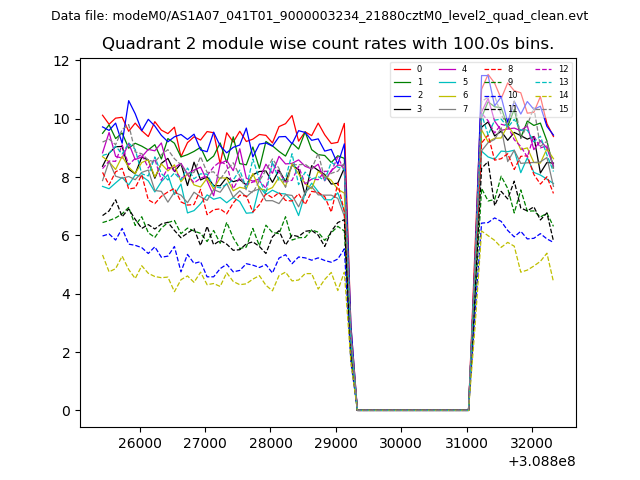
| Module-wise count rates for Quadrant B Data is divided into 100 sec bins |
 |
 |
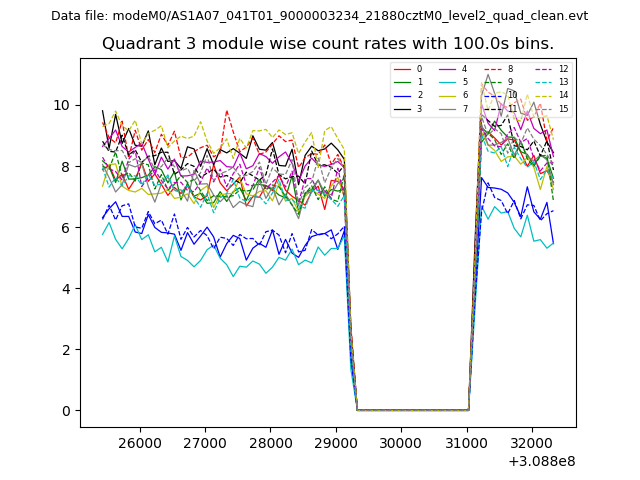
| Module-wise count rates for Quadrant C Data is divided into 100 sec bins |
 |
 |
| Module-wise count rates for Quadrant D Data is divided into 100 sec bins |
 |
 |
| Parameter | Plot |
|---|---|
| CZT HV Monitor | 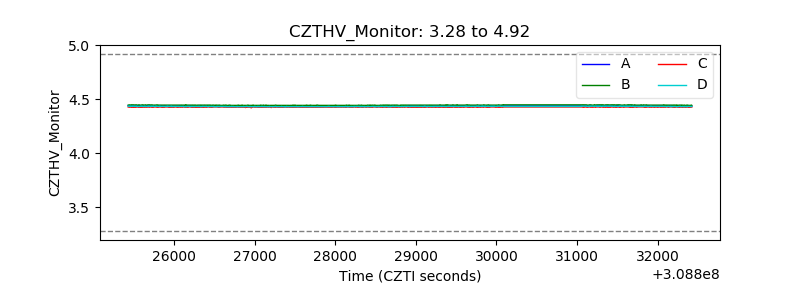 |
| D_VDD | 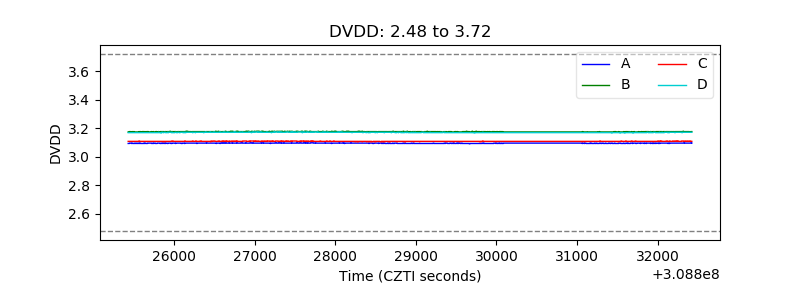 |
| Temperature 1 | 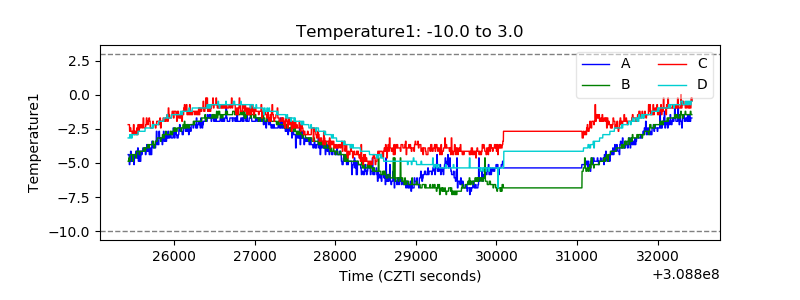 |
| Veto HV Monitor | 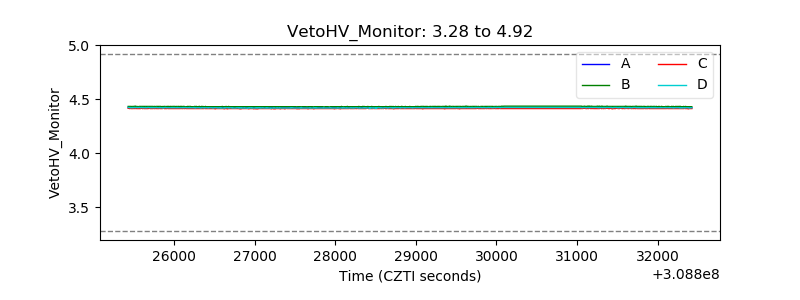 |
| Veto LLD | 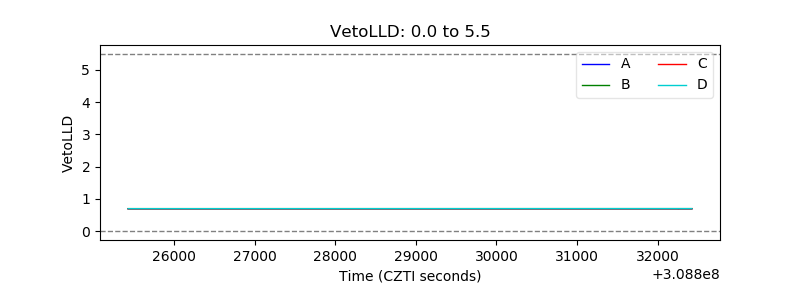 |
| Alpha Counter |  |
| _CPM_Rate | 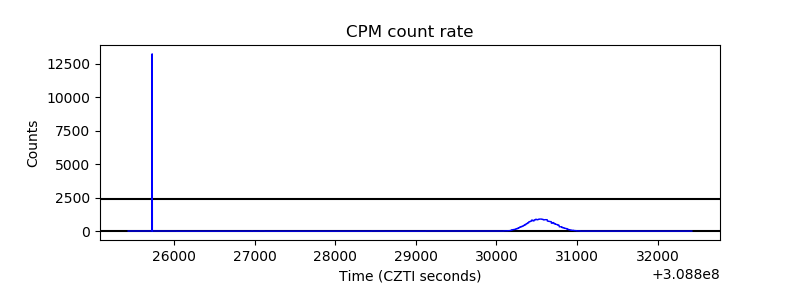 |
| CZT Counter | 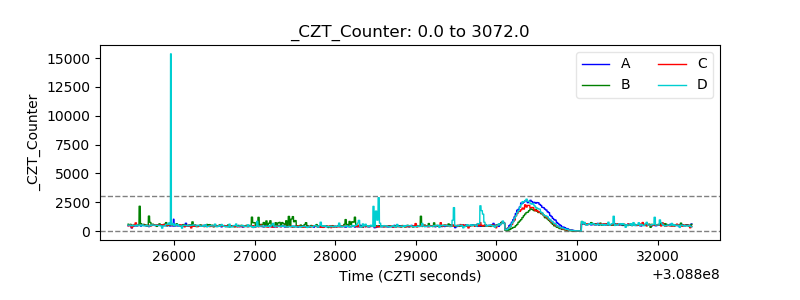 |
| +2.5 Volts monitor |  |
| +5 Volts monitor |  |
| _ROLL_ROT | 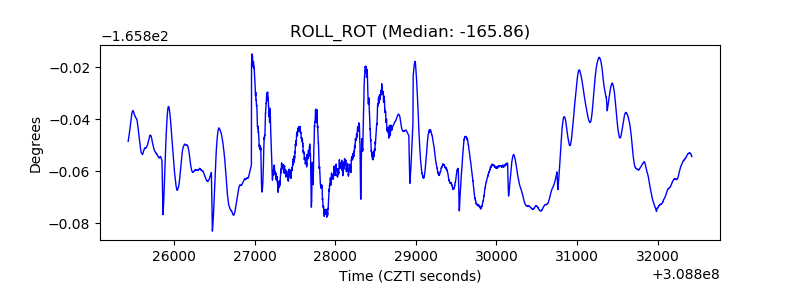 |
| _Roll_DEC | 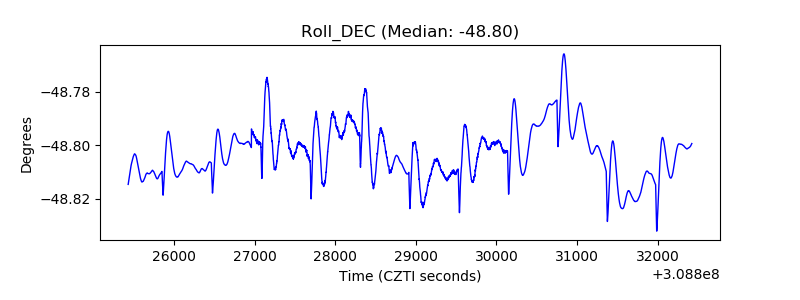 |
| _Roll_RA | 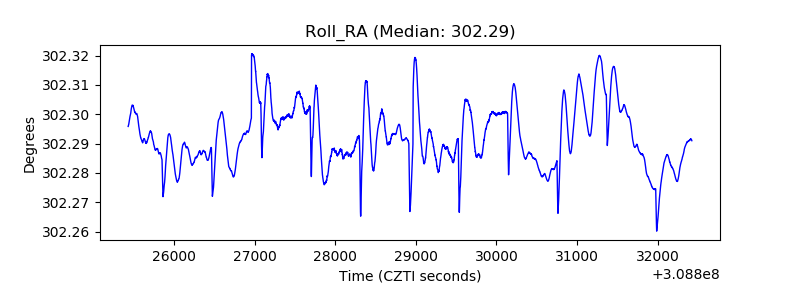 |
| Veto Counter | 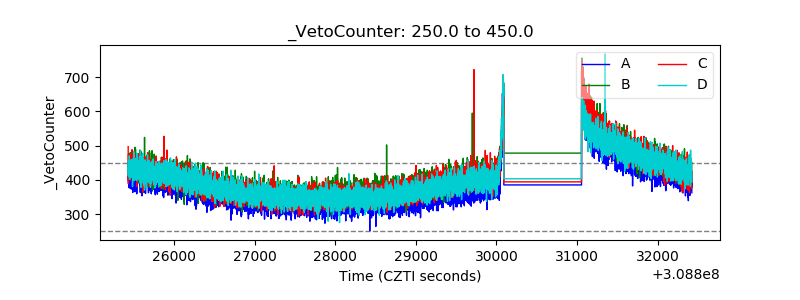 |