| Param | Original file | Final file |
|---|---|---|
| Filename | modeM0/AS1A07_041T01_9000003234_21883cztM0_level2.evt | modeM0/AS1A07_041T01_9000003234_21883cztM0_level2_quad_clean.evt |
| Size (bytes) | 1,897,485,120 | 418,112,640 |
| Size | 1.8 GB | 398.7 MB |
| Events in quadrant A | 13,508,599 | 2,709,981 |
| Events in quadrant B | 14,368,057 | 2,749,381 |
| Events in quadrant C | 13,260,659 | 2,663,398 |
| Events in quadrant D | 14,416,410 | 2,597,402 |
| Mode SS | |||
|---|---|---|---|
| Quadrant | BADHDUFLAG | Total packets | Discarded packets |
| A | 0 | 576 | 0 |
| B | 0 | 576 | 0 |
| C | 0 | 576 | 0 |
| D | 0 | 576 | 0 |
| Mode M9 | |||
|---|---|---|---|
| Quadrant | BADHDUFLAG | Total packets | Discarded packets |
| A | 0 | 45 | 0 |
| B | 0 | 45 | 0 |
| C | 0 | 45 | 0 |
| D | 0 | 45 | 0 |
| Mode M0 | |||
|---|---|---|---|
| Quadrant | BADHDUFLAG | Total packets | Discarded packets |
| A | 0 | 59266 | 5 |
| B | 0 | 60927 | 5 |
| C | 0 | 58405 | 5 |
| D | 0 | 62213 | 5 |
| Quadrant | Total seconds | Saturated seconds | Saturation percentage |
|---|---|---|---|
| A | 28289 | 341 | 1.205416% |
| B | 28289 | 369 | 1.304394% |
| C | 28289 | 408 | 1.442257% |
| D | 28290 | 446 | 1.576529% |
Noise dominated data is calculated using 1-second bins in cleaned event files. If a bin has >2000 counts, and if more than 50% of those come from <1% of pixels, then it is considered to be noise-dominated and hence unusable.
| Quadrant | # 1 sec bins | Bins with >0 counts | Bins with >2000 counts | High rate bins dominated by noise | Noise dominated (total time) | Noise dominated (detector-on time) | Marked lightcurve |
|---|---|---|---|---|---|---|---|
| A | 32804 | 28289 | 38 | 38 | 0.12% | 0.13% | 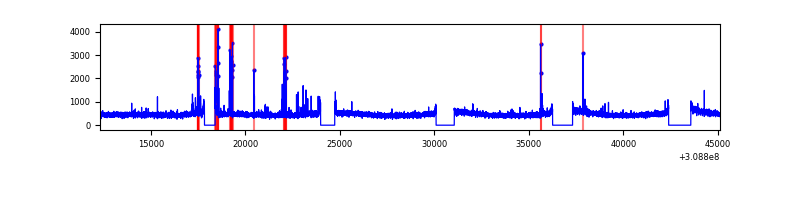 |
| B | 32804 | 28289 | 52 | 52 | 0.16% | 0.18% | 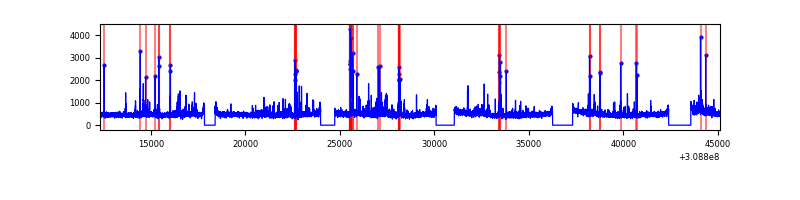 |
| C | 32804 | 28289 | 0 | 0 | 0.00% | 0.00% | 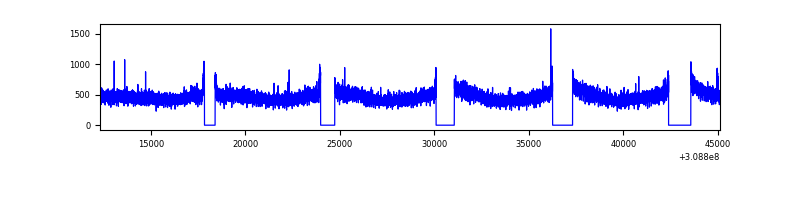 |
| D | 32805 | 28290 | 214 | 214 | 0.65% | 0.76% | 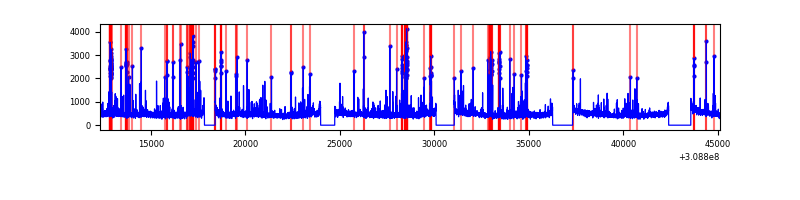 |
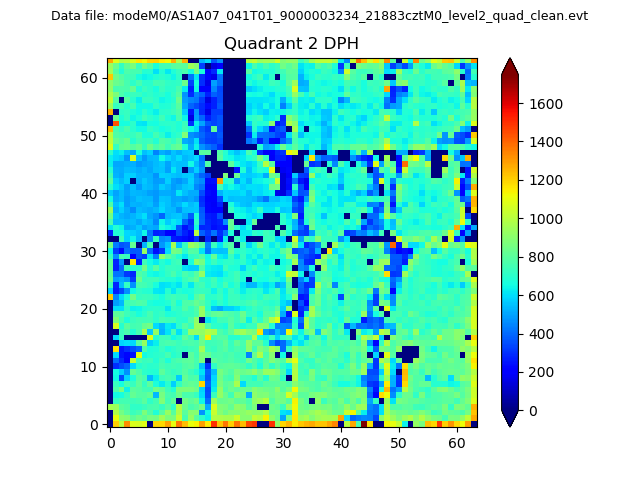
Top three noisy pixels from each quadrant. If the there are fewer than three noisy pixels in the level2.evt file, extra rows are filled as -1
| Pixel properties | Quadrant properties | ||||||
|---|---|---|---|---|---|---|---|
| Quadrant | DetID | PixID | Counts | Sigma | Mean | Median | Sigma |
| A | 5 | 16 | 266971 | 388.37 | 3412 | 3343 | 678.8 |
| A | 14 | 235 | 65691 | 91.85 | 3412 | 3343 | 678.8 |
| A | 13 | 254 | 52349 | 72.19 | 3412 | 3343 | 678.8 |
| B | 3 | 64 | 311996 | 483.95 | 3406 | 3326 | 637.8 |
| B | 0 | 190 | 228786 | 353.49 | 3406 | 3326 | 637.8 |
| B | 0 | 230 | 169269 | 260.17 | 3406 | 3326 | 637.8 |
| C | 14 | 238 | 515837 | 679.22 | 3261 | 3280 | 754.6 |
| C | 8 | 208 | 26961 | 31.38 | 3261 | 3280 | 754.6 |
| C | 13 | 61 | 23110 | 26.28 | 3261 | 3280 | 754.6 |
| D | 1 | 52 | 708786 | 880.17 | 3304 | 3204 | 801.6 |
| D | 2 | 136 | 569829 | 706.83 | 3304 | 3204 | 801.6 |
| D | 7 | 238 | 234129 | 288.06 | 3304 | 3204 | 801.6 |
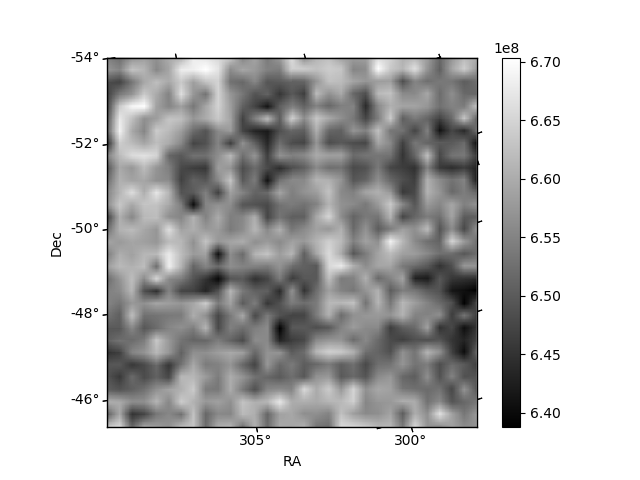
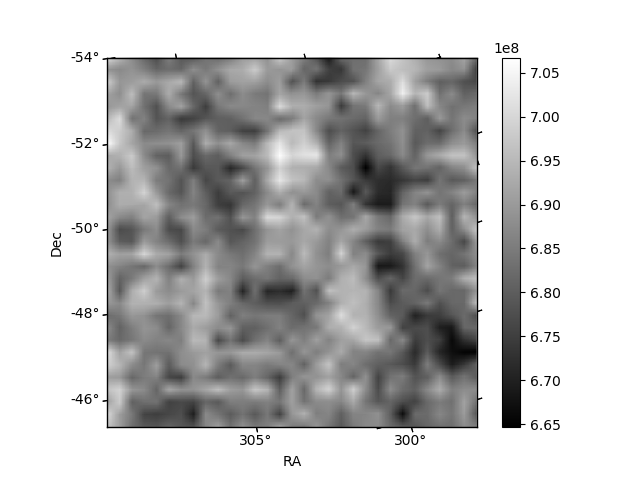
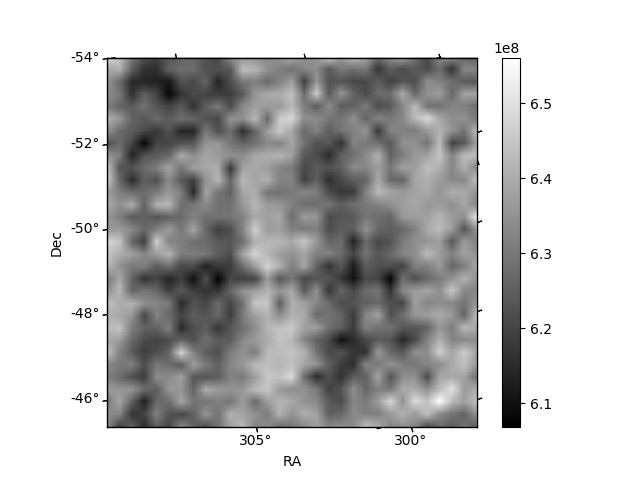
Histogram calculated using DETX and DETY for each event in the final _common_clean file
| Quadrant A |  |
 |
Quadrant B |
|---|---|---|---|
| Quadrant D | 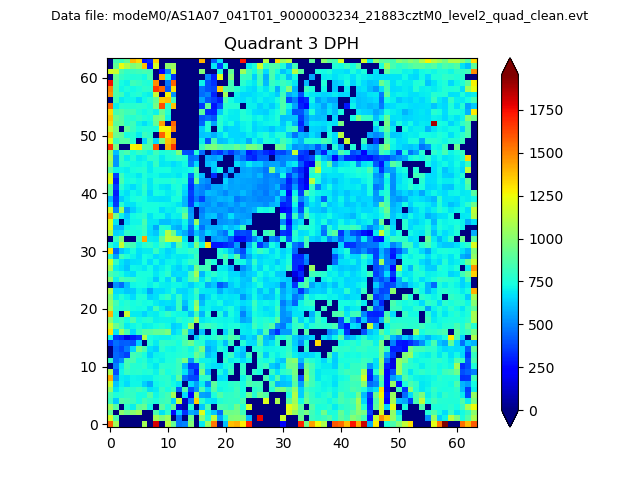 |
 |
Quadrant C |
| Plot type | Count rate plots | Images |
|---|---|---|
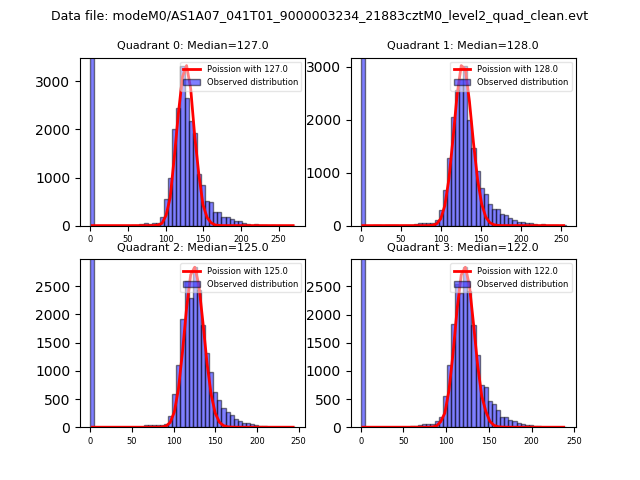
| Comparison with Poisson distribution Blue bars denote a histogram of data divided into 1 sec bins. Red curve is a Poisson curve with rate = median count rate of data. |
 |
 |
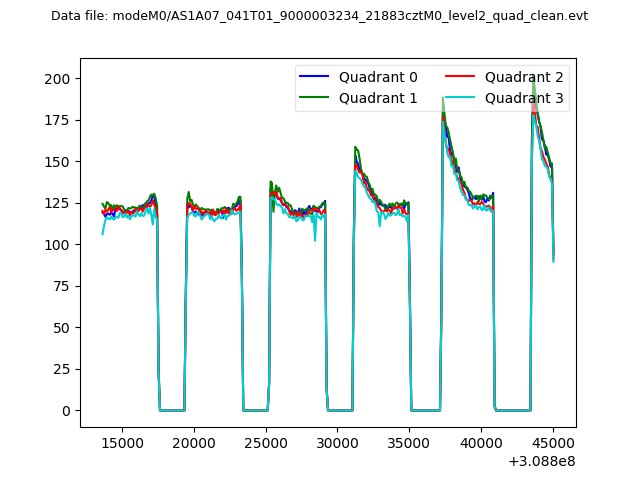
| Quadrant-wise count rates Data is divided into 100 sec bins |
 |
|
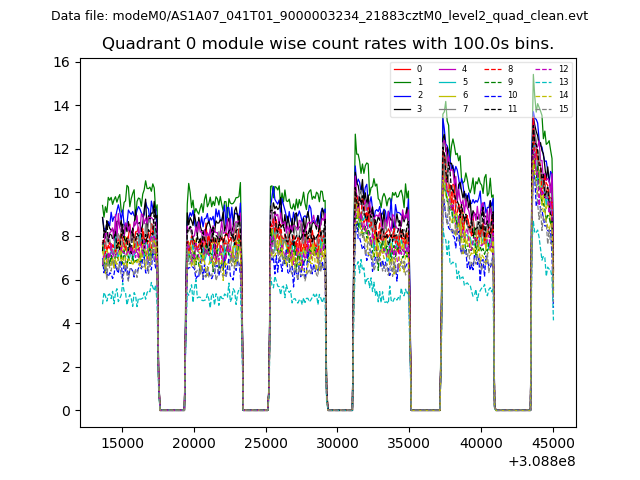
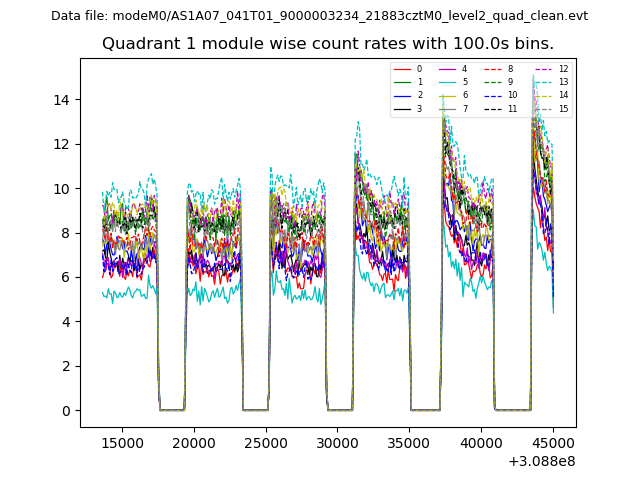
| Module-wise count rates for Quadrant A Data is divided into 100 sec bins |
 |
 |
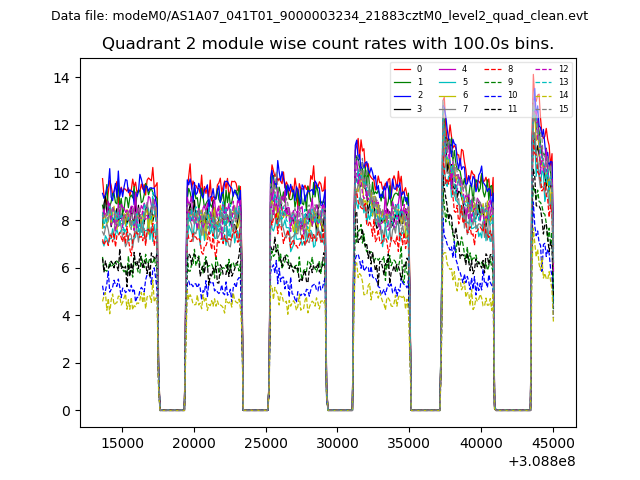
| Module-wise count rates for Quadrant B Data is divided into 100 sec bins |
 |
 |
| Module-wise count rates for Quadrant C Data is divided into 100 sec bins |
 |
 |
| Module-wise count rates for Quadrant D Data is divided into 100 sec bins |
 |
 |
| Parameter | Plot |
|---|---|
| CZT HV Monitor | 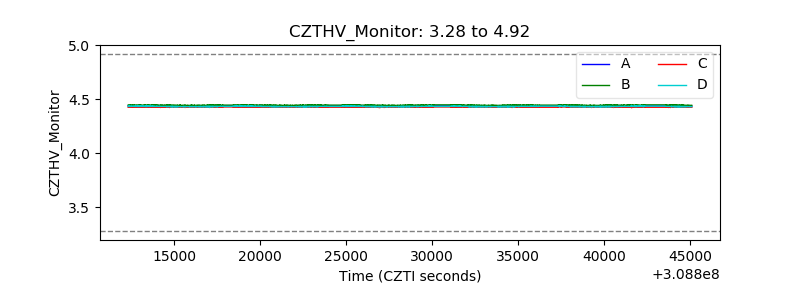 |
| D_VDD | 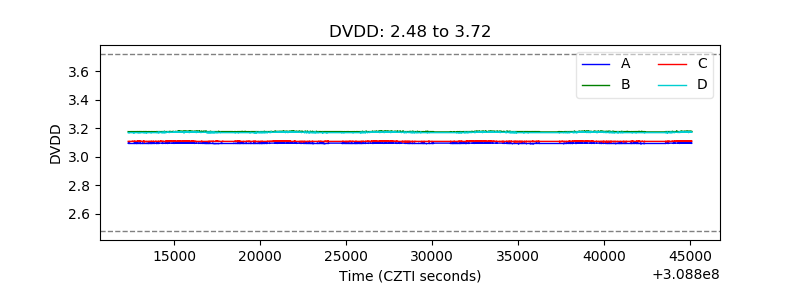 |
| Temperature 1 | 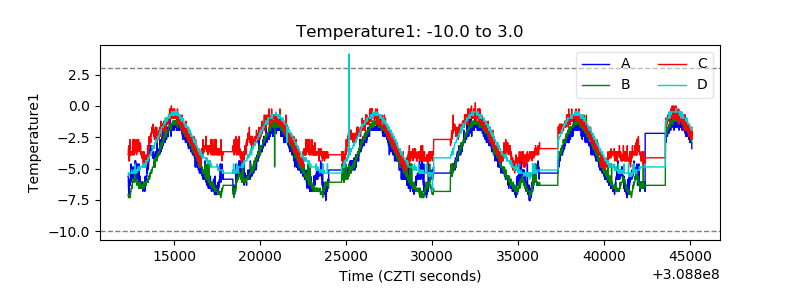 |
| Veto HV Monitor | 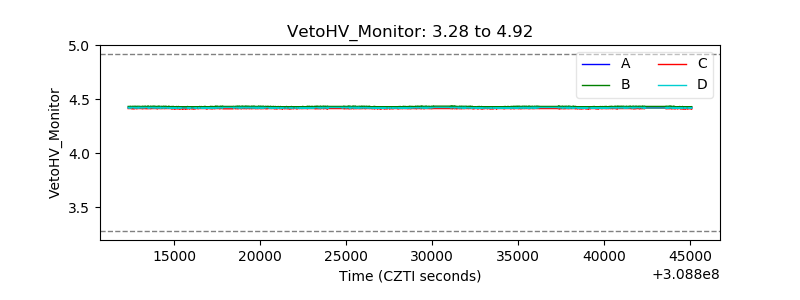 |
| Veto LLD | 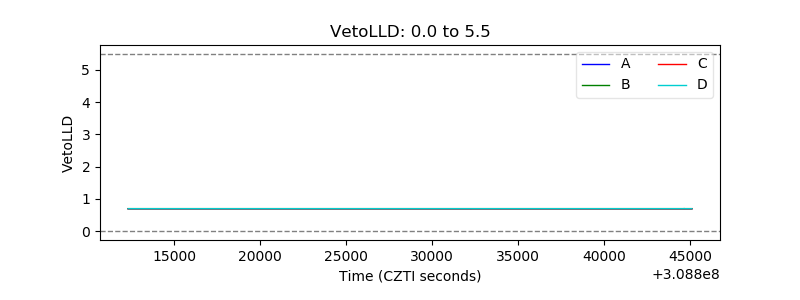 |
| Alpha Counter | 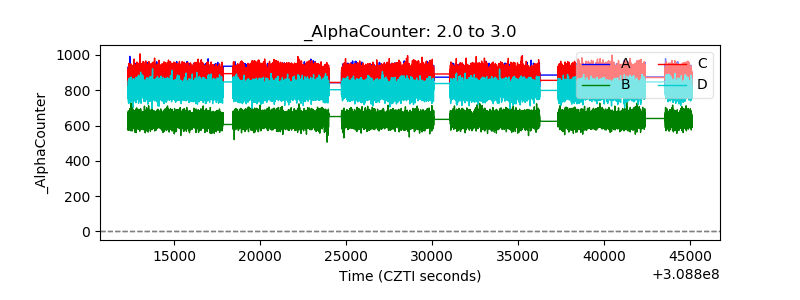 |
| _CPM_Rate | 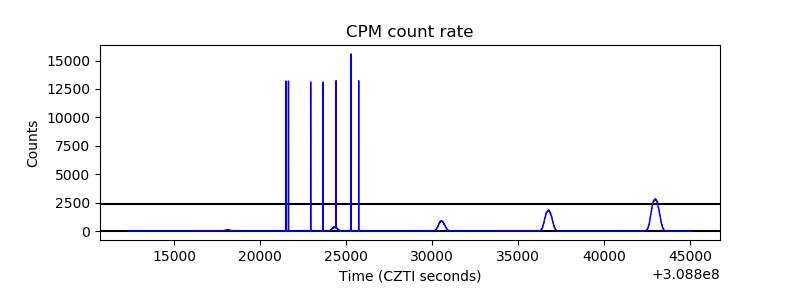 |
| CZT Counter | 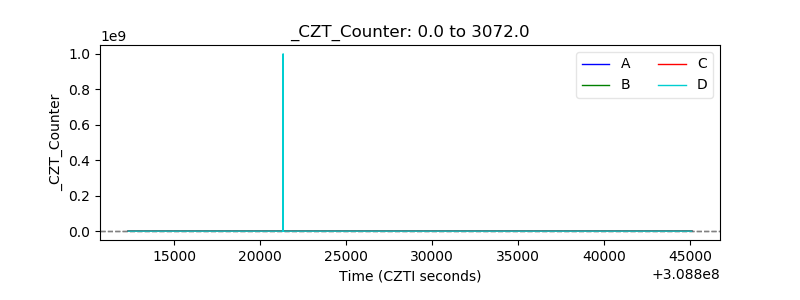 |
| +2.5 Volts monitor | 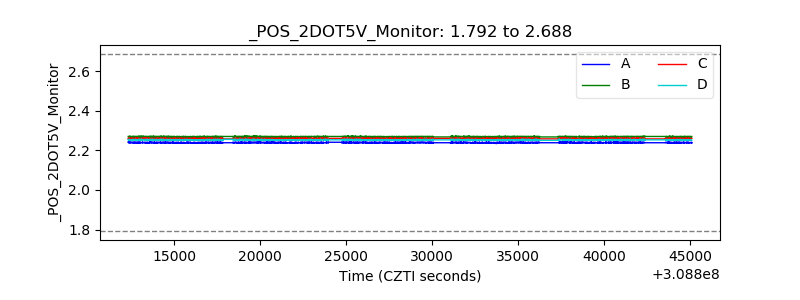 |
| +5 Volts monitor | 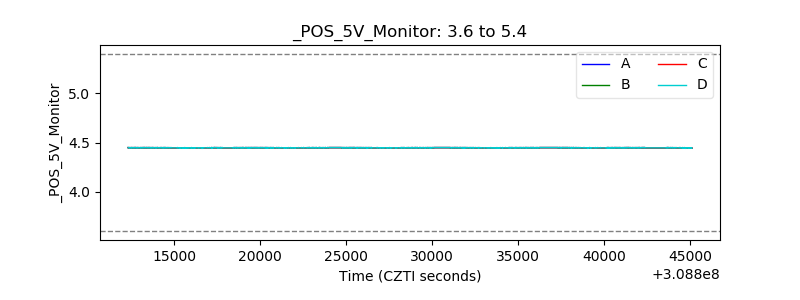 |
| _ROLL_ROT |  |
| _Roll_DEC | 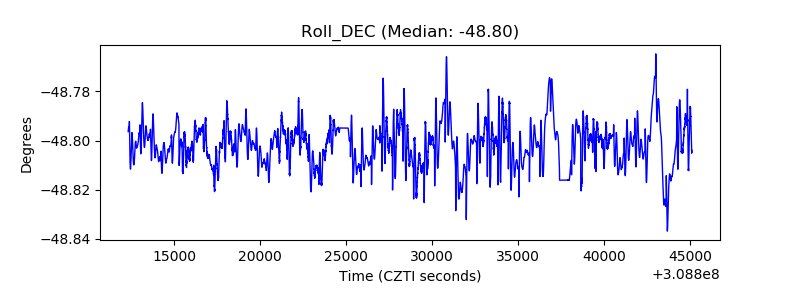 |
| _Roll_RA | 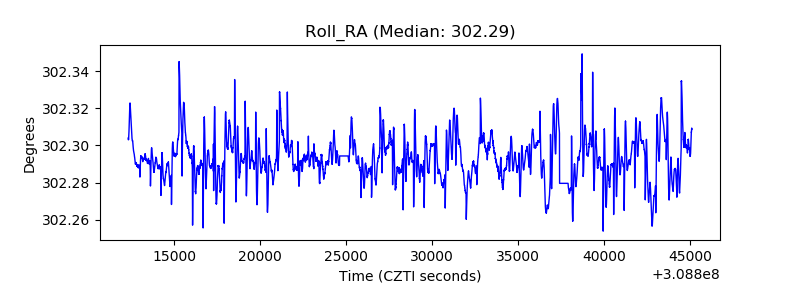 |
| Veto Counter | 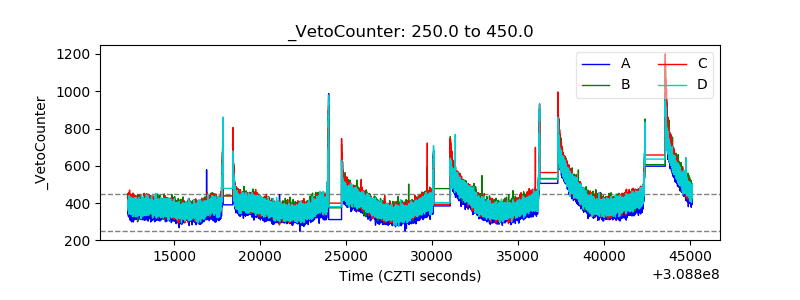 |