| Param | Original file | Final file |
|---|---|---|
| Filename | modeM0/AS1A07_041T01_9000003234_21884cztM0_level2.evt | modeM0/AS1A07_041T01_9000003234_21884cztM0_level2_quad_clean.evt |
| Size (bytes) | 425,364,480 | 90,720,000 |
| Size | 405.7 MB | 86.5 MB |
| Events in quadrant A | 2,866,574 | 611,076 |
| Events in quadrant B | 3,038,789 | 617,388 |
| Events in quadrant C | 2,838,664 | 577,716 |
| Events in quadrant D | 3,747,500 | 539,465 |
| Mode SS | |||
|---|---|---|---|
| Quadrant | BADHDUFLAG | Total packets | Discarded packets |
| A | 0 | 116 | 0 |
| B | 0 | 116 | 0 |
| C | 0 | 116 | 0 |
| D | 0 | 116 | 0 |
| Mode M9 | |||
|---|---|---|---|
| Quadrant | BADHDUFLAG | Total packets | Discarded packets |
| A | 0 | 13 | 0 |
| B | 0 | 13 | 0 |
| C | 0 | 13 | 0 |
| D | 0 | 13 | 0 |
| Mode M0 | |||
|---|---|---|---|
| Quadrant | BADHDUFLAG | Total packets | Discarded packets |
| A | 0 | 12202 | 1 |
| B | 0 | 12689 | 1 |
| C | 0 | 12116 | 1 |
| D | 0 | 15150 | 1 |
| Quadrant | Total seconds | Saturated seconds | Saturation percentage |
|---|---|---|---|
| A | 5748 | 35 | 0.608907% |
| B | 5749 | 46 | 0.800139% |
| C | 5749 | 48 | 0.834928% |
| D | 5749 | 308 | 5.357453% |
Noise dominated data is calculated using 1-second bins in cleaned event files. If a bin has >2000 counts, and if more than 50% of those come from <1% of pixels, then it is considered to be noise-dominated and hence unusable.
| Quadrant | # 1 sec bins | Bins with >0 counts | Bins with >2000 counts | High rate bins dominated by noise | Noise dominated (total time) | Noise dominated (detector-on time) | Marked lightcurve |
|---|---|---|---|---|---|---|---|
| A | 7058 | 5749 | 1 | 1 | 0.01% | 0.02% | 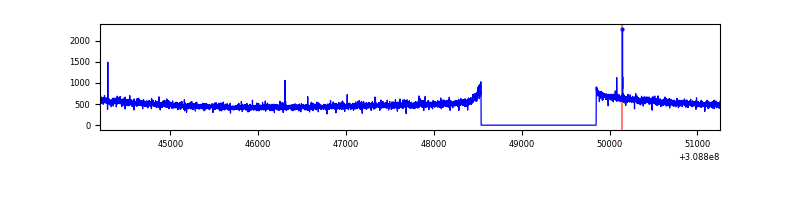 |
| B | 7059 | 5750 | 6 | 6 | 0.08% | 0.10% | 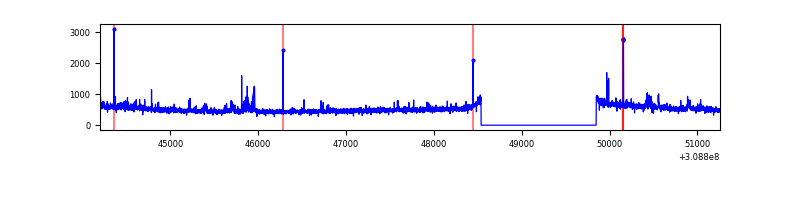 |
| C | 7059 | 5750 | 0 | 0 | 0.00% | 0.00% | 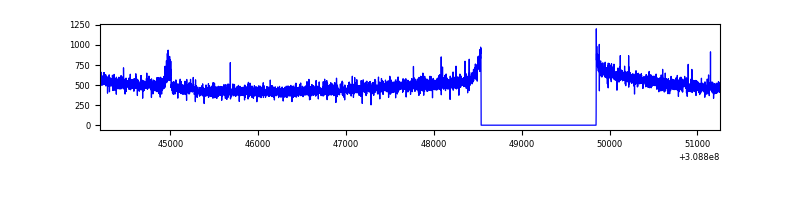 |
| D | 7059 | 5750 | 262 | 262 | 3.71% | 4.56% | 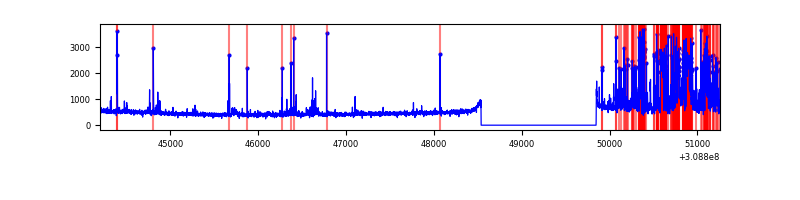 |
Top three noisy pixels from each quadrant. If the there are fewer than three noisy pixels in the level2.evt file, extra rows are filled as -1
| Pixel properties | Quadrant properties | ||||||
|---|---|---|---|---|---|---|---|
| Quadrant | DetID | PixID | Counts | Sigma | Mean | Median | Sigma |
| A | 13 | 254 | 10976 | 69.5 | 739 | 725 | 147.5 |
| A | 4 | 2 | 7871 | 48.45 | 739 | 725 | 147.5 |
| A | 8 | 6 | 7279 | 44.44 | 739 | 725 | 147.5 |
| B | 0 | 197 | 41465 | 295.93 | 737 | 722 | 137.7 |
| B | 3 | 64 | 32149 | 228.27 | 737 | 722 | 137.7 |
| B | 0 | 190 | 29529 | 209.24 | 737 | 722 | 137.7 |
| C | 14 | 238 | 113978 | 710.33 | 691 | 695 | 159.5 |
| C | 8 | 208 | 26530 | 162.0 | 691 | 695 | 159.5 |
| C | 13 | 61 | 4993 | 26.95 | 691 | 695 | 159.5 |
| D | 1 | 52 | 883071 | 5300.41 | 684 | 665 | 166.5 |
| D | 7 | 238 | 104168 | 621.72 | 684 | 665 | 166.5 |
| D | 13 | 174 | 51360 | 304.51 | 684 | 665 | 166.5 |
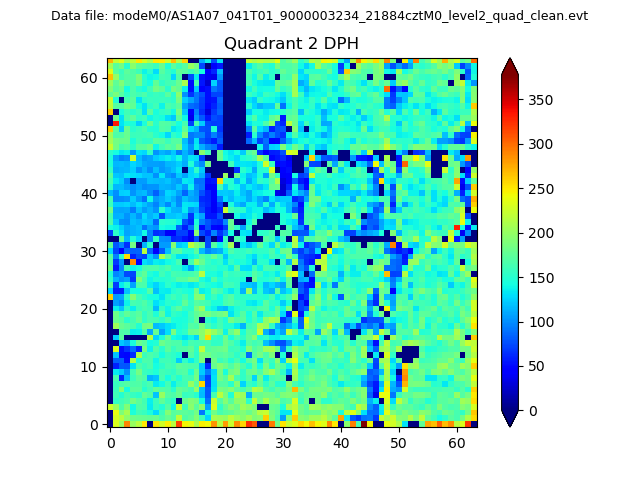
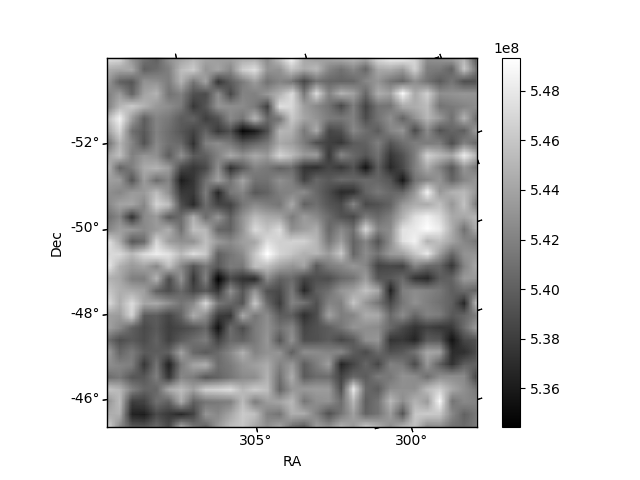
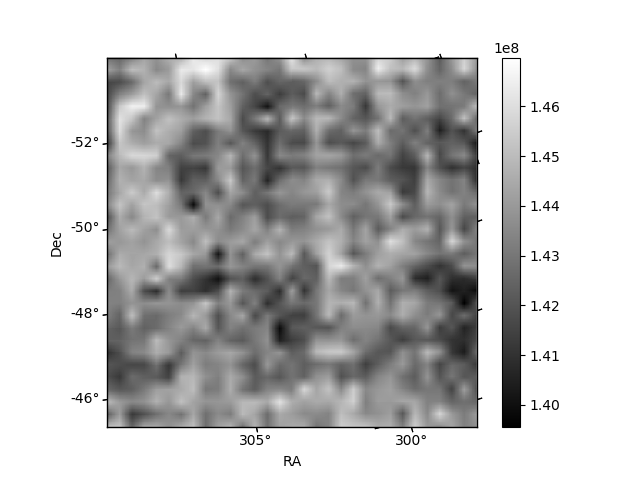
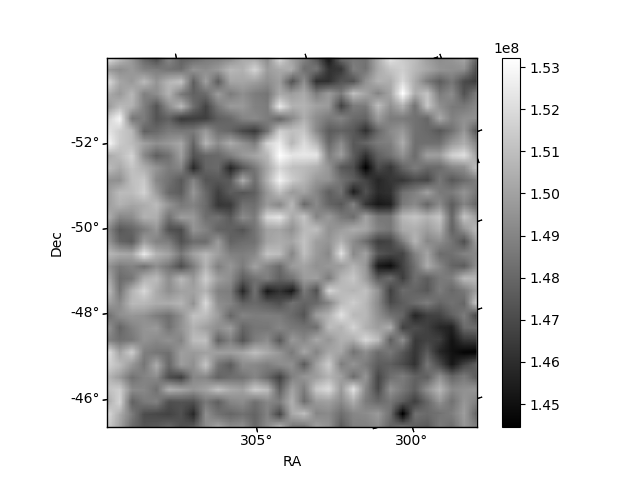
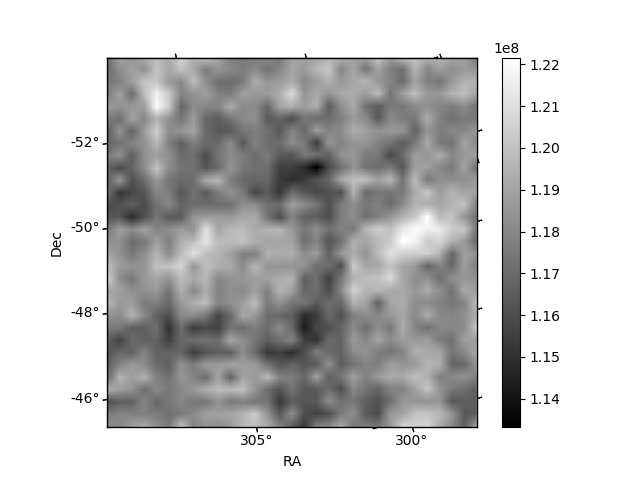
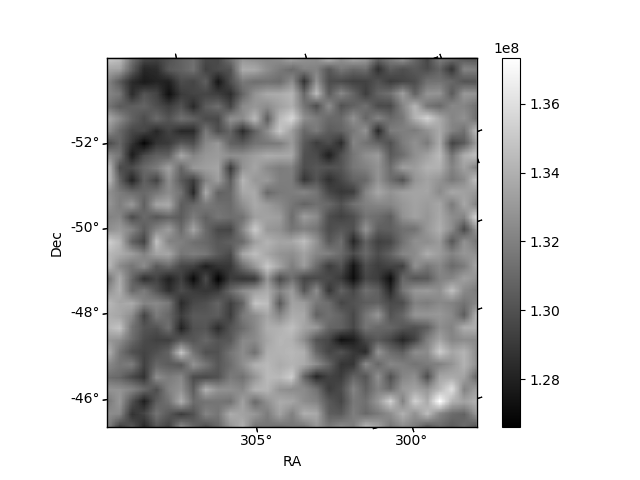
Histogram calculated using DETX and DETY for each event in the final _common_clean file
| Quadrant A | 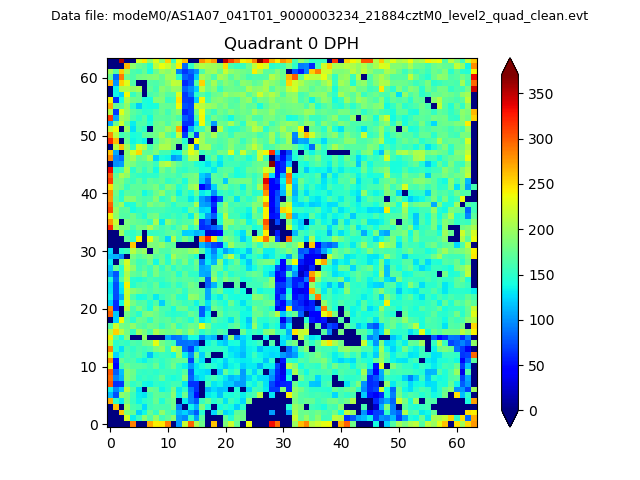 |
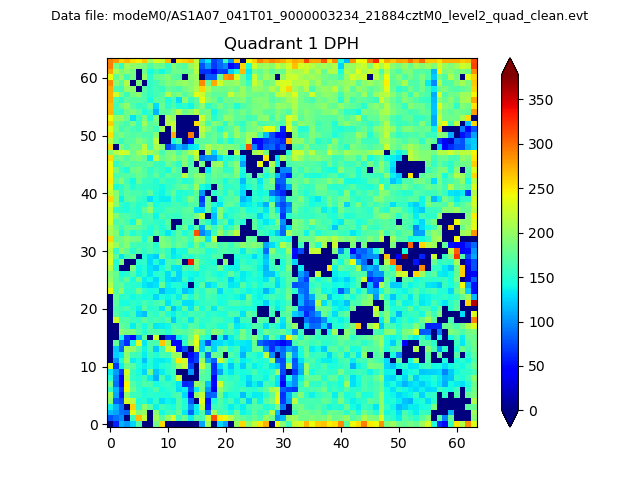 |
Quadrant B |
|---|---|---|---|
| Quadrant D | 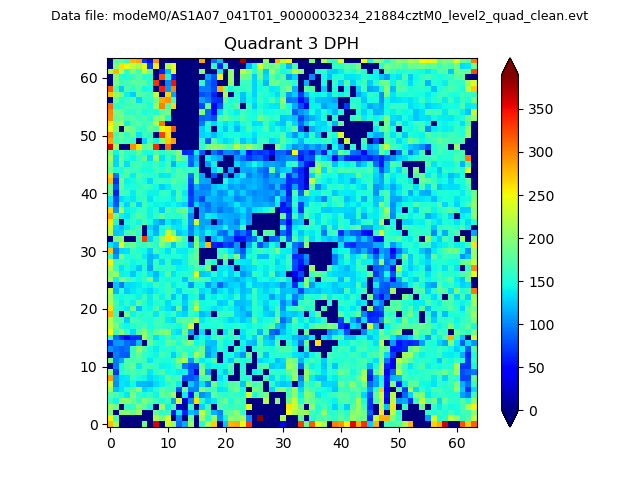 |
 |
Quadrant C |
| Plot type | Count rate plots | Images |
|---|---|---|
| Comparison with Poisson distribution Blue bars denote a histogram of data divided into 1 sec bins. Red curve is a Poisson curve with rate = median count rate of data. |
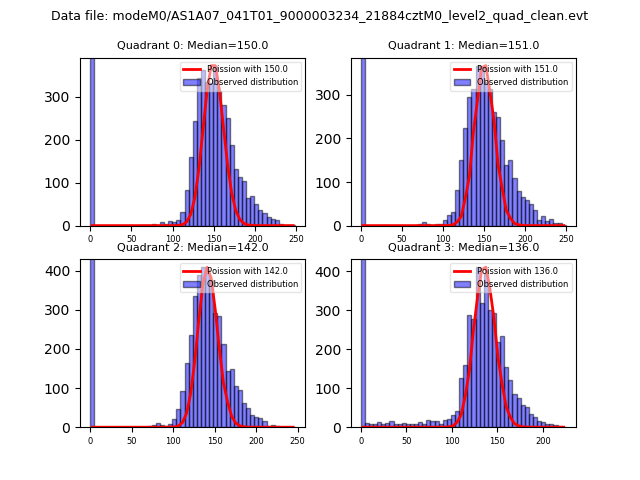 |
 |
| Quadrant-wise count rates Data is divided into 100 sec bins |
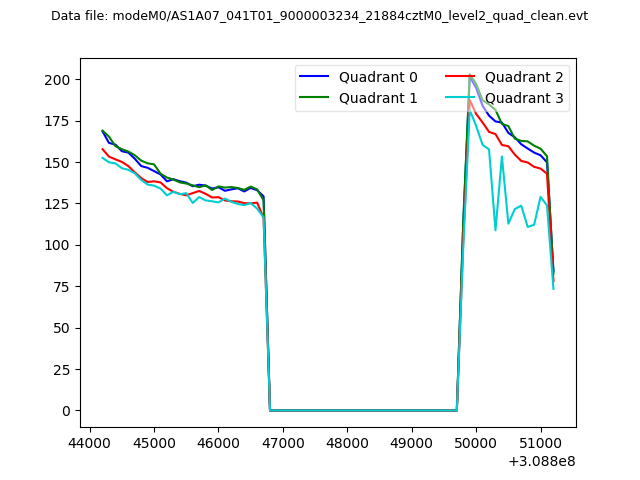 |
|
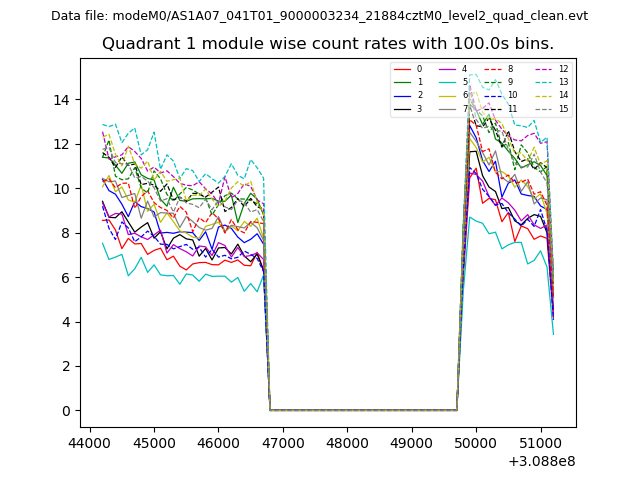
| Module-wise count rates for Quadrant A Data is divided into 100 sec bins |
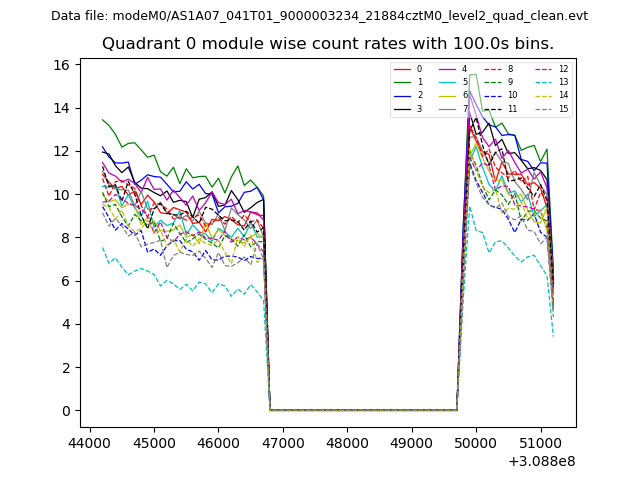 |
 |
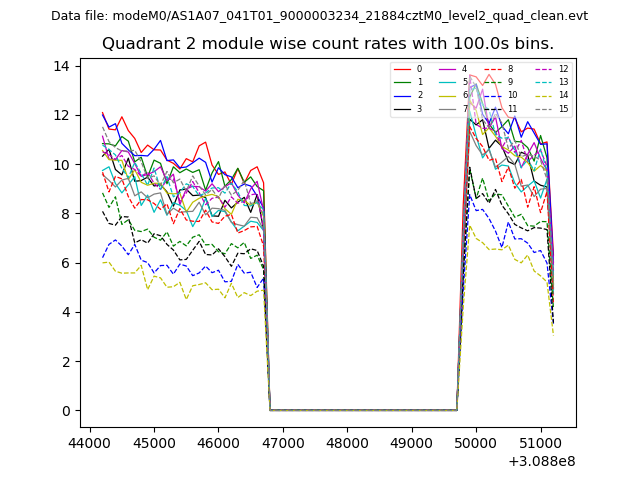
| Module-wise count rates for Quadrant B Data is divided into 100 sec bins |
 |
 |
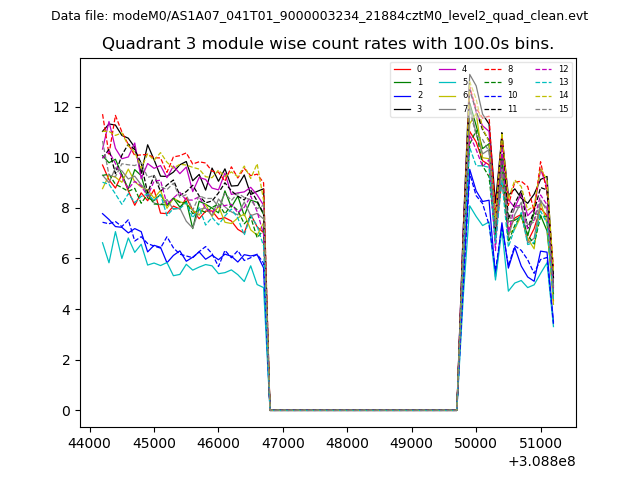
| Module-wise count rates for Quadrant C Data is divided into 100 sec bins |
 |
 |
| Module-wise count rates for Quadrant D Data is divided into 100 sec bins |
 |
 |
| Parameter | Plot |
|---|---|
| CZT HV Monitor | 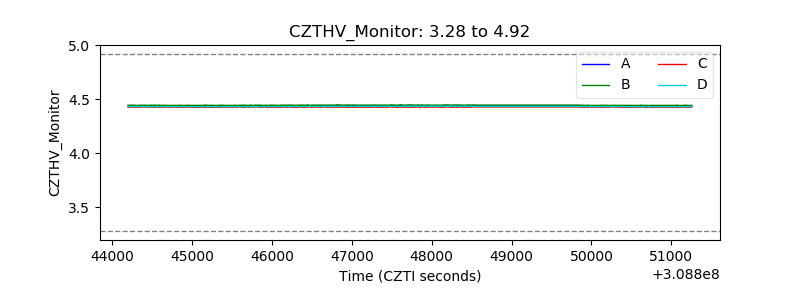 |
| D_VDD | 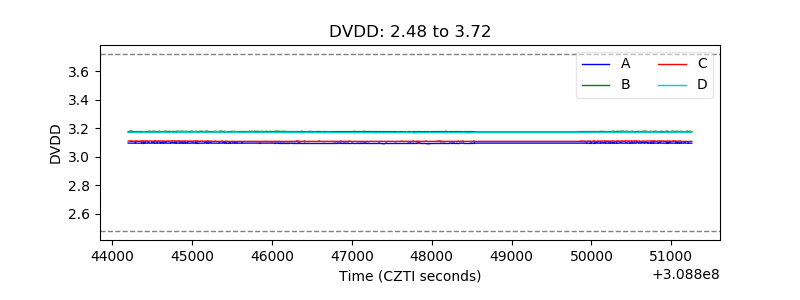 |
| Temperature 1 | 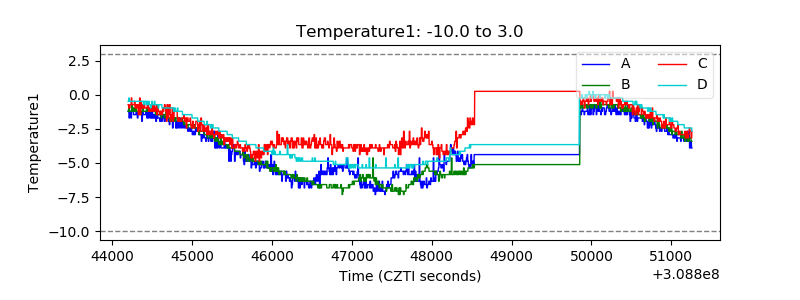 |
| Veto HV Monitor |  |
| Veto LLD | 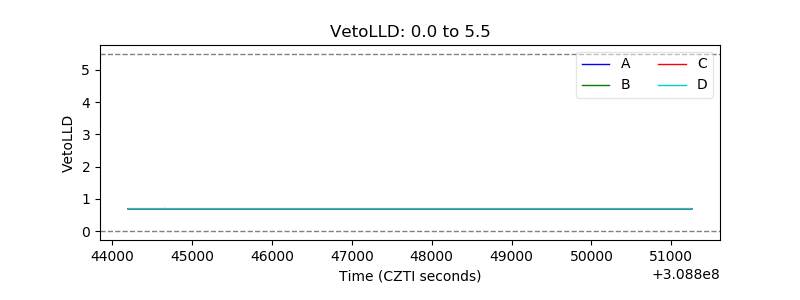 |
| Alpha Counter | 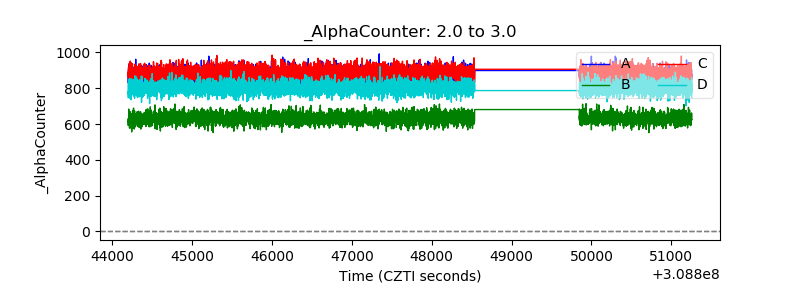 |
| _CPM_Rate | 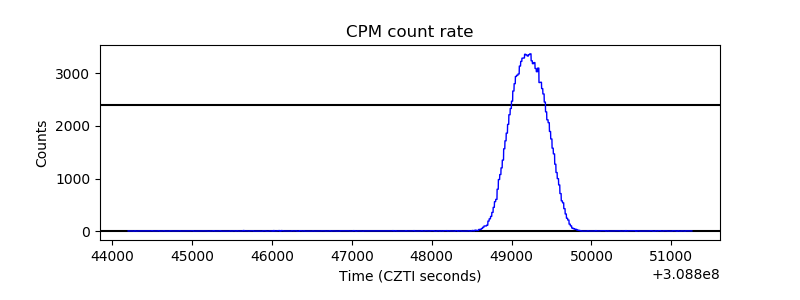 |
| CZT Counter | 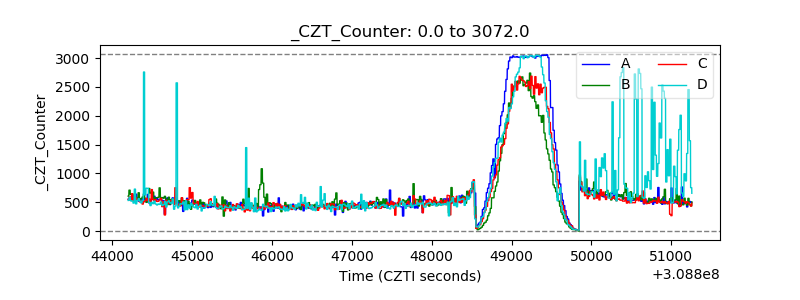 |
| +2.5 Volts monitor | 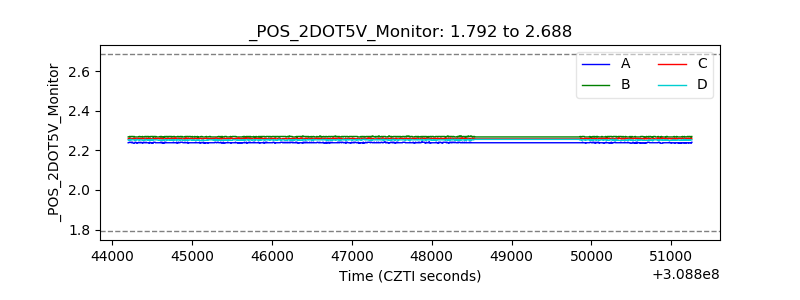 |
| +5 Volts monitor |  |
| _ROLL_ROT | 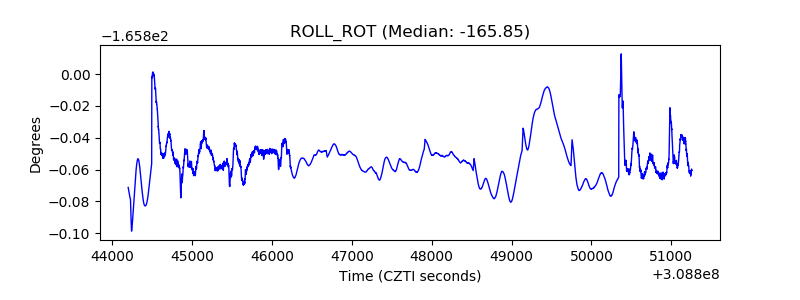 |
| _Roll_DEC | 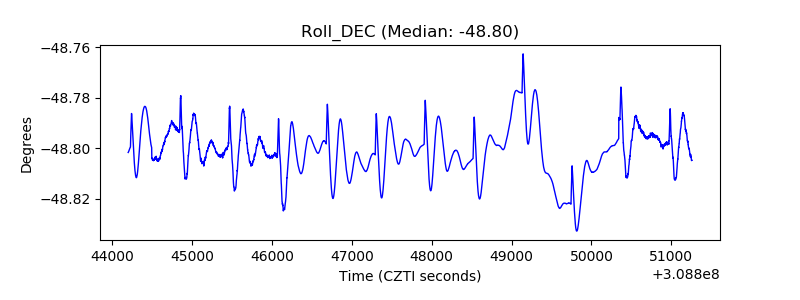 |
| _Roll_RA | 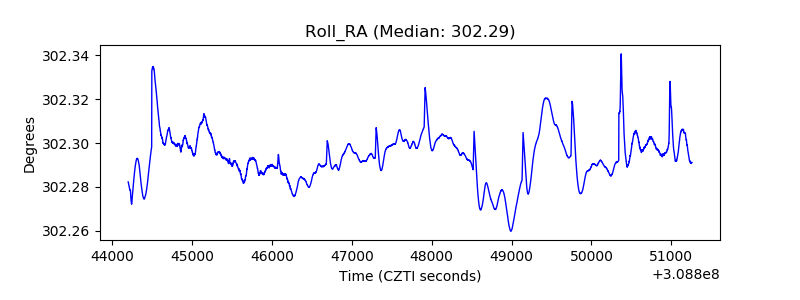 |
| Veto Counter | 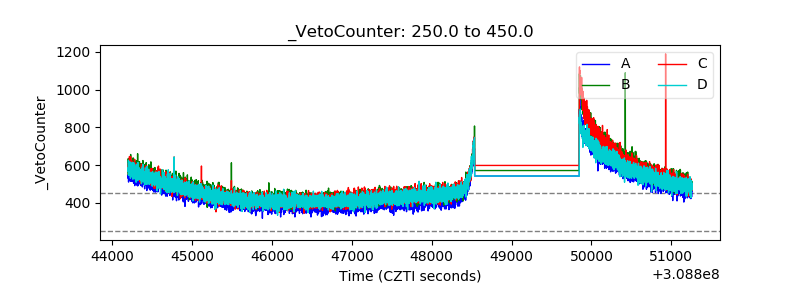 |