| Param | Original file | Final file |
|---|---|---|
| Filename | modeM0/AS1A07_041T01_9000003234_21885cztM0_level2.evt | modeM0/AS1A07_041T01_9000003234_21885cztM0_level2_quad_clean.evt |
| Size (bytes) | 492,733,440 | 93,009,600 |
| Size | 469.9 MB | 88.7 MB |
| Events in quadrant A | 3,016,309 | 628,908 |
| Events in quadrant B | 3,217,632 | 639,632 |
| Events in quadrant C | 2,960,729 | 598,087 |
| Events in quadrant D | 5,325,105 | 535,138 |
| Mode SS | |||
|---|---|---|---|
| Quadrant | BADHDUFLAG | Total packets | Discarded packets |
| A | 0 | 122 | 0 |
| B | 0 | 122 | 0 |
| C | 0 | 122 | 0 |
| D | 0 | 122 | 0 |
| Mode M9 | |||
|---|---|---|---|
| Quadrant | BADHDUFLAG | Total packets | Discarded packets |
| A | 0 | 13 | 0 |
| B | 0 | 13 | 0 |
| C | 0 | 13 | 0 |
| D | 0 | 13 | 0 |
| Mode M0 | |||
|---|---|---|---|
| Quadrant | BADHDUFLAG | Total packets | Discarded packets |
| A | 0 | 12706 | 1 |
| B | 0 | 13283 | 1 |
| C | 0 | 12523 | 1 |
| D | 0 | 19846 | 1 |
| Quadrant | Total seconds | Saturated seconds | Saturation percentage |
|---|---|---|---|
| A | 5932 | 39 | 0.657451% |
| B | 5933 | 63 | 1.061857% |
| C | 5933 | 70 | 1.179842% |
| D | 5933 | 527 | 8.882521% |
Noise dominated data is calculated using 1-second bins in cleaned event files. If a bin has >2000 counts, and if more than 50% of those come from <1% of pixels, then it is considered to be noise-dominated and hence unusable.
| Quadrant | # 1 sec bins | Bins with >0 counts | Bins with >2000 counts | High rate bins dominated by noise | Noise dominated (total time) | Noise dominated (detector-on time) | Marked lightcurve |
|---|---|---|---|---|---|---|---|
| A | 7287 | 5932 | 2 | 2 | 0.03% | 0.03% | 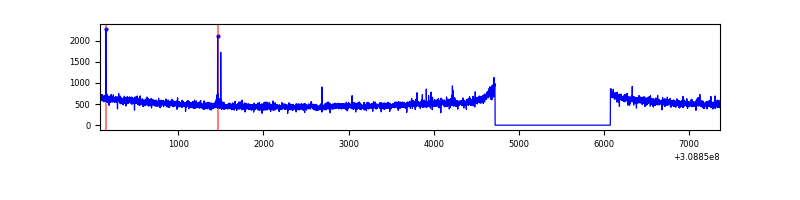 |
| B | 7288 | 5934 | 11 | 11 | 0.15% | 0.19% | 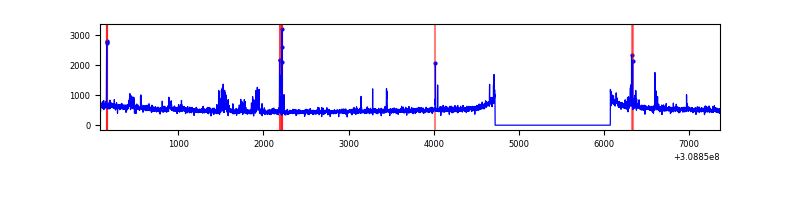 |
| C | 7288 | 5934 | 0 | 0 | 0.00% | 0.00% | 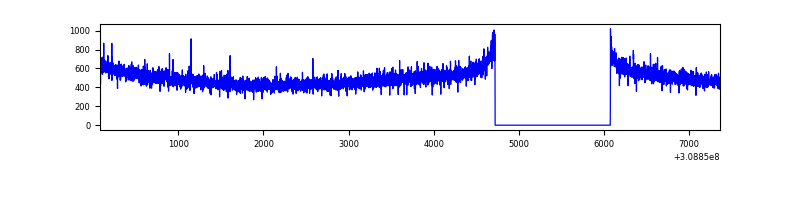 |
| D | 7288 | 5933 | 494 | 494 | 6.78% | 8.33% | 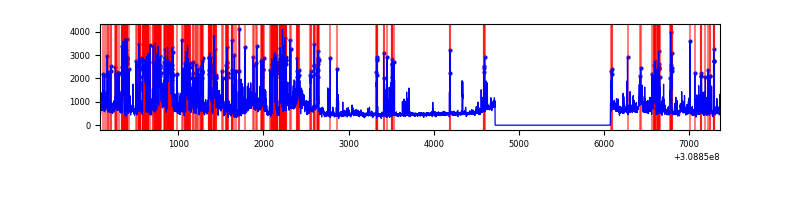 |
Top three noisy pixels from each quadrant. If the there are fewer than three noisy pixels in the level2.evt file, extra rows are filled as -1
| Pixel properties | Quadrant properties | ||||||
|---|---|---|---|---|---|---|---|
| Quadrant | DetID | PixID | Counts | Sigma | Mean | Median | Sigma |
| A | 4 | 2 | 16525 | 102.12 | 775 | 762 | 154.4 |
| A | 13 | 254 | 11841 | 71.78 | 775 | 762 | 154.4 |
| A | 5 | 16 | 7229 | 41.9 | 775 | 762 | 154.4 |
| B | 0 | 197 | 63648 | 439.62 | 772 | 757 | 143.1 |
| B | 3 | 64 | 54248 | 373.92 | 772 | 757 | 143.1 |
| B | 0 | 190 | 23728 | 160.57 | 772 | 757 | 143.1 |
| C | 14 | 238 | 123107 | 729.97 | 726 | 732 | 167.6 |
| C | 13 | 61 | 5159 | 26.41 | 726 | 732 | 167.6 |
| C | 14 | 219 | 4200 | 20.69 | 726 | 732 | 167.6 |
| D | 1 | 52 | 1990254 | 11637.1 | 705 | 685 | 171.0 |
| D | 7 | 238 | 464550 | 2713.17 | 705 | 685 | 171.0 |
| D | 13 | 174 | 63399 | 366.82 | 705 | 685 | 171.0 |
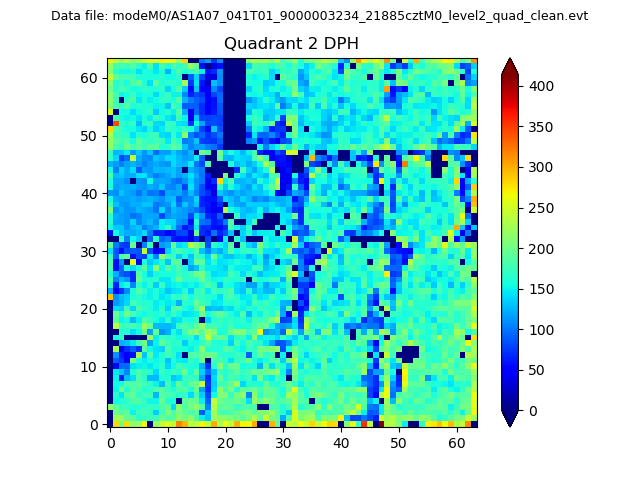
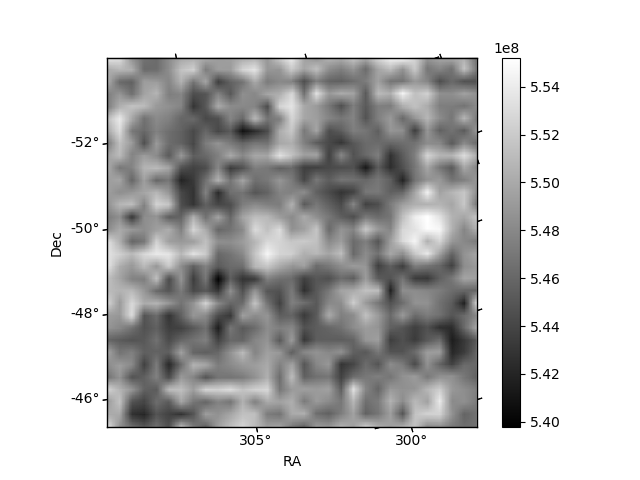
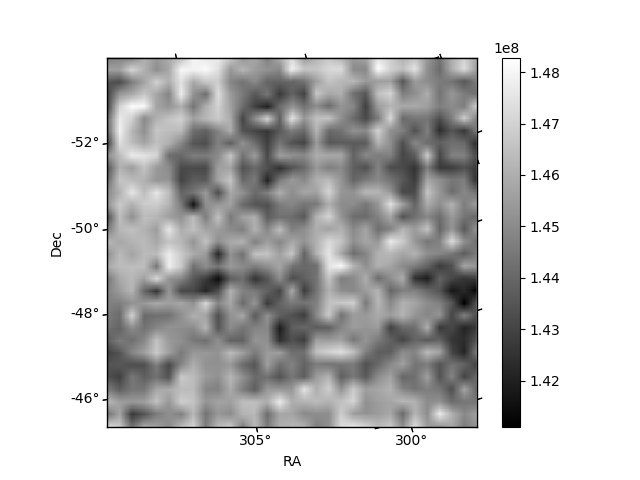
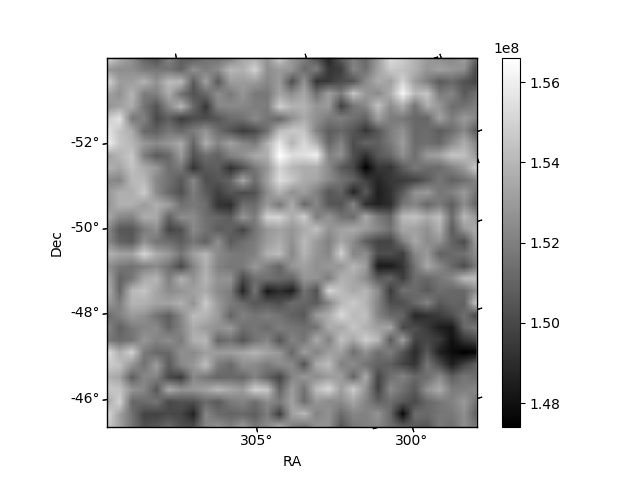
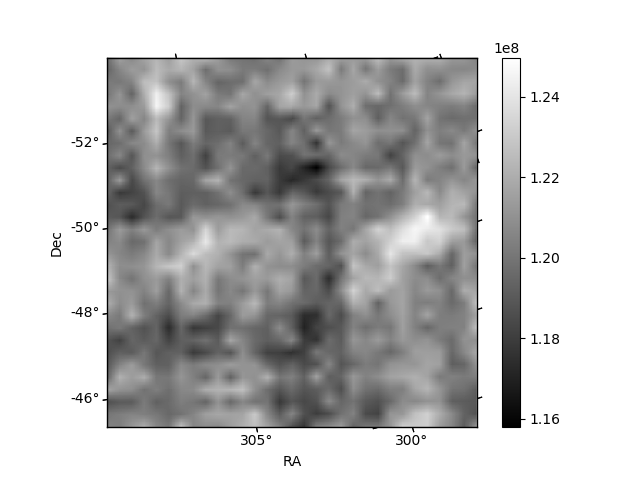
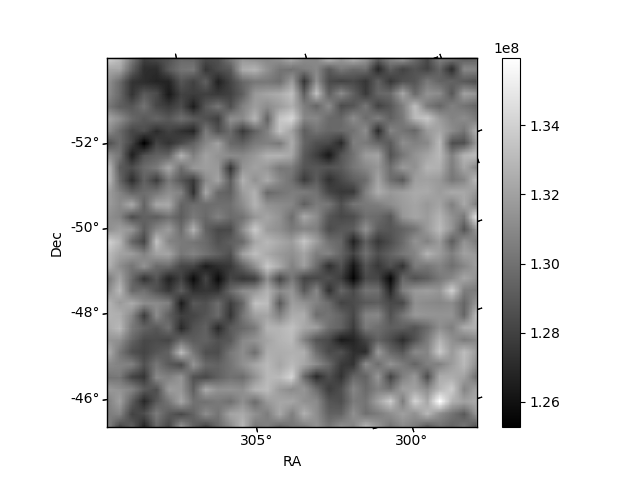
Histogram calculated using DETX and DETY for each event in the final _common_clean file
| Quadrant A | 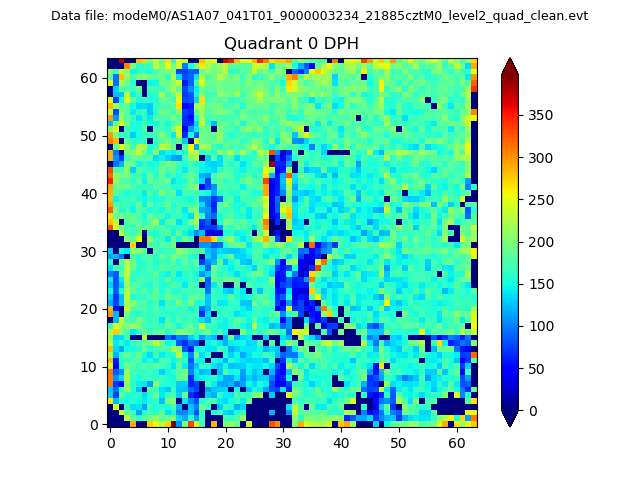 |
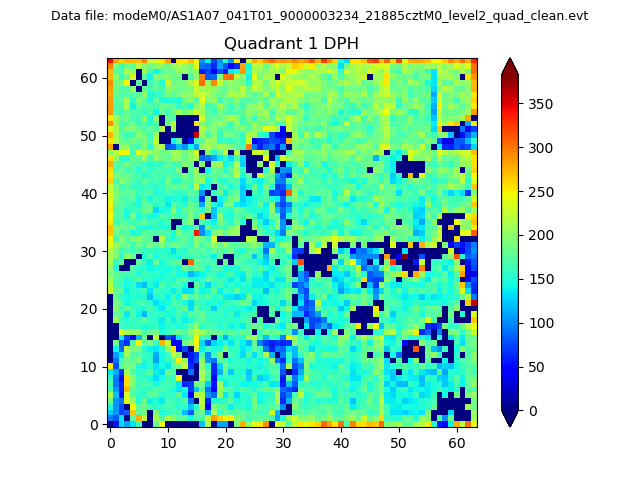 |
Quadrant B |
|---|---|---|---|
| Quadrant D | 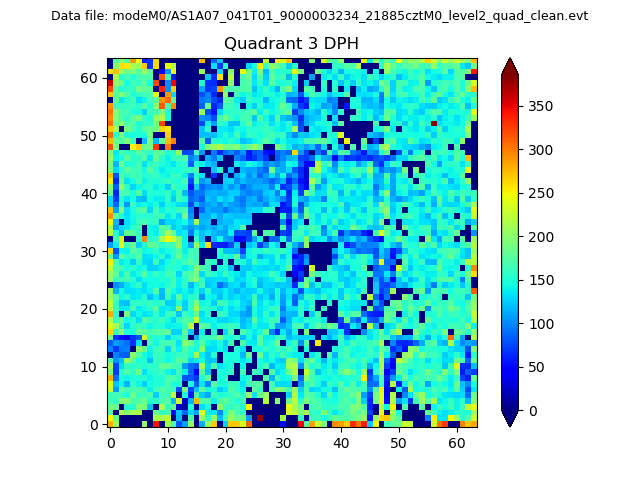 |
 |
Quadrant C |
| Plot type | Count rate plots | Images |
|---|---|---|
| Comparison with Poisson distribution Blue bars denote a histogram of data divided into 1 sec bins. Red curve is a Poisson curve with rate = median count rate of data. |
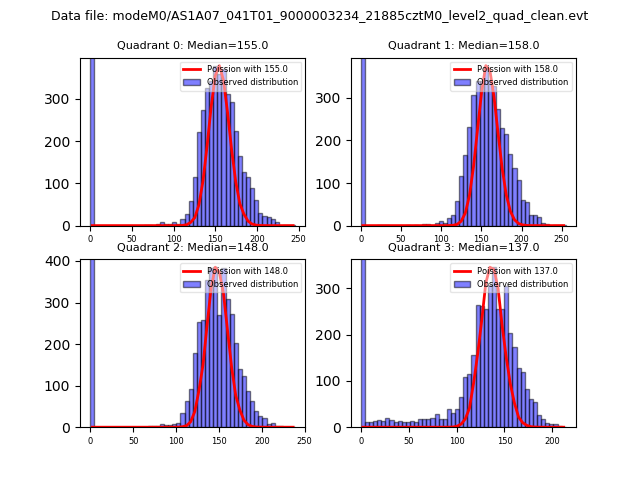 |
 |
| Quadrant-wise count rates Data is divided into 100 sec bins |
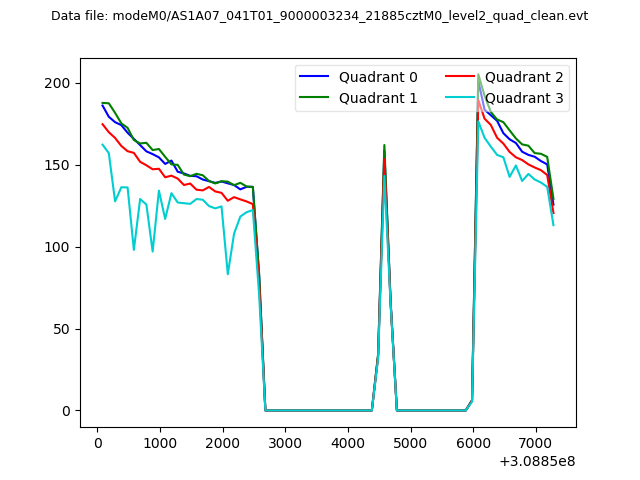 |
|
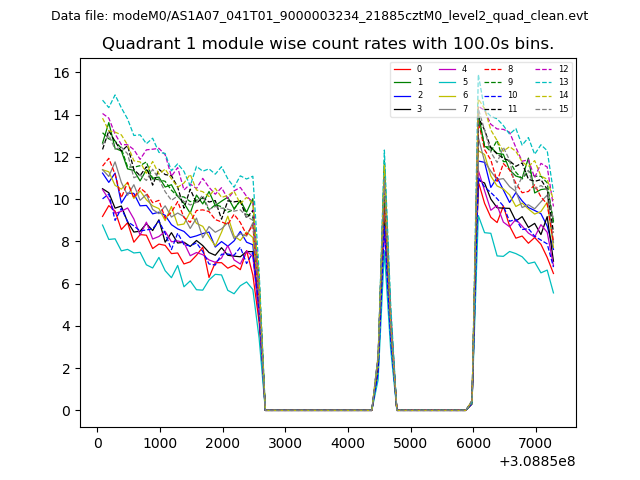
| Module-wise count rates for Quadrant A Data is divided into 100 sec bins |
 |
 |
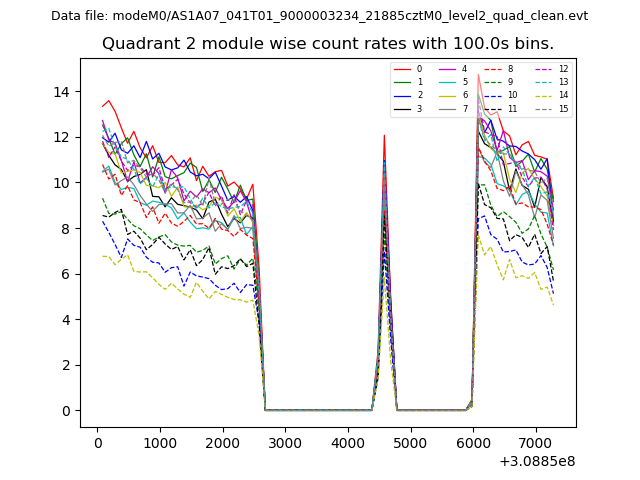
| Module-wise count rates for Quadrant B Data is divided into 100 sec bins |
 |
 |
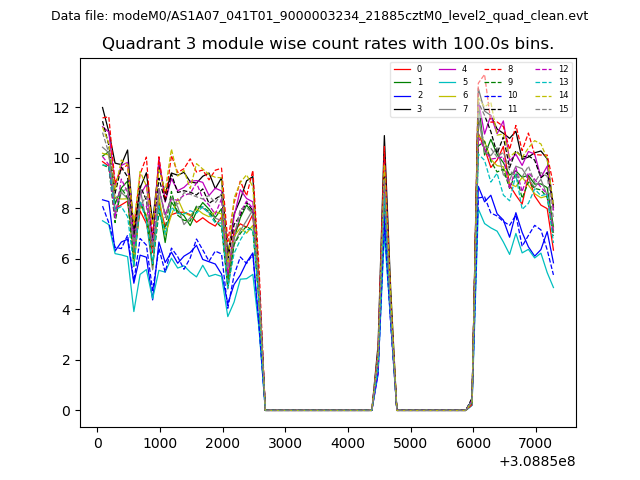
| Module-wise count rates for Quadrant C Data is divided into 100 sec bins |
 |
 |
| Module-wise count rates for Quadrant D Data is divided into 100 sec bins |
 |
 |
| Parameter | Plot |
|---|---|
| CZT HV Monitor | 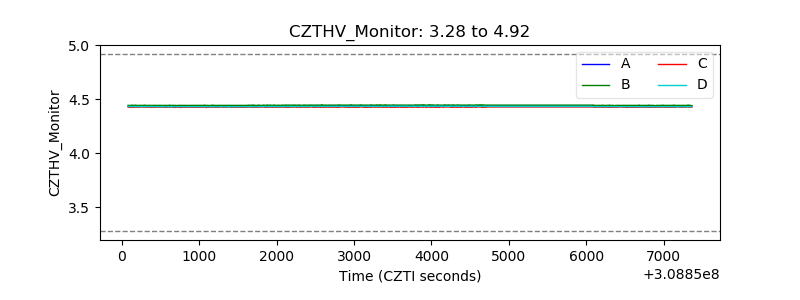 |
| D_VDD | 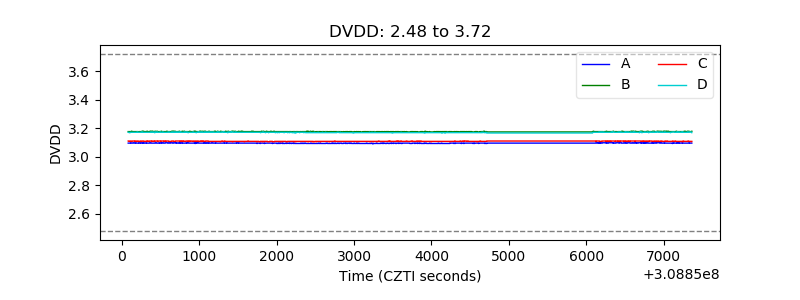 |
| Temperature 1 | 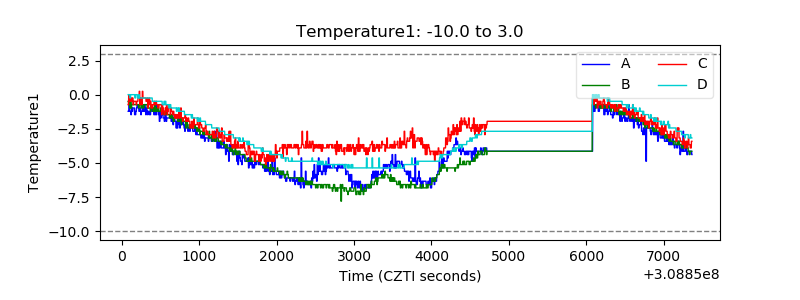 |
| Veto HV Monitor |  |
| Veto LLD |  |
| Alpha Counter |  |
| _CPM_Rate | 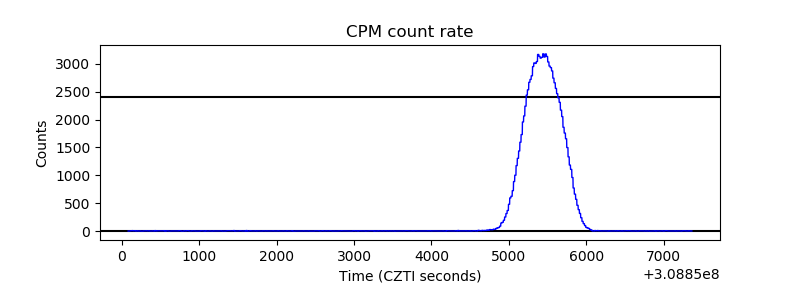 |
| CZT Counter | 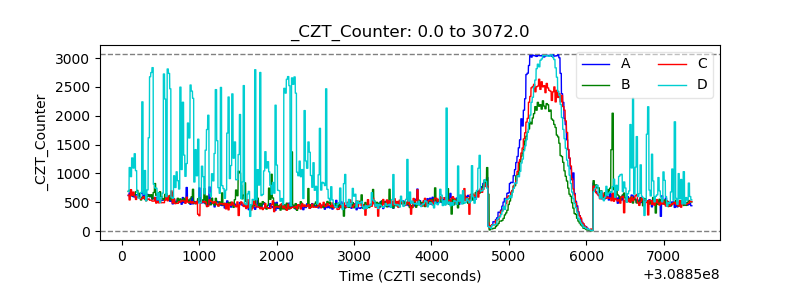 |
| +2.5 Volts monitor |  |
| +5 Volts monitor |  |
| _ROLL_ROT | 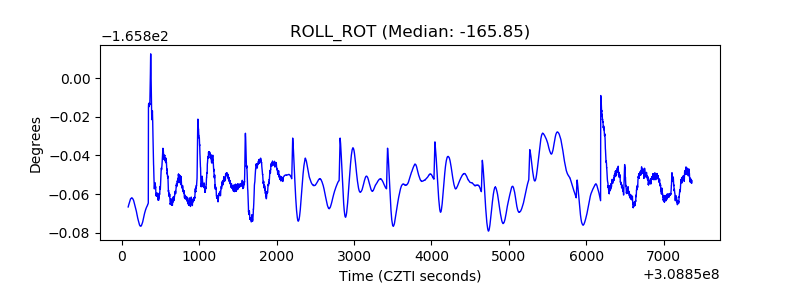 |
| _Roll_DEC | 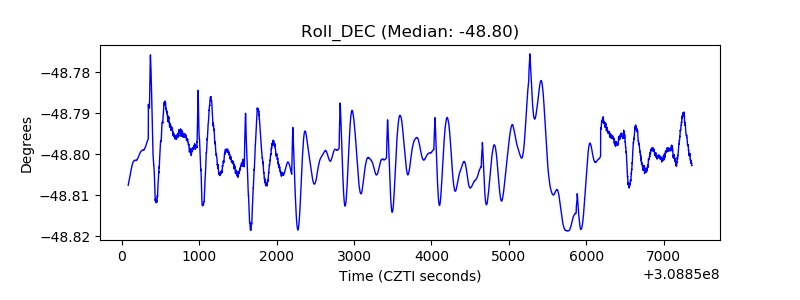 |
| _Roll_RA | 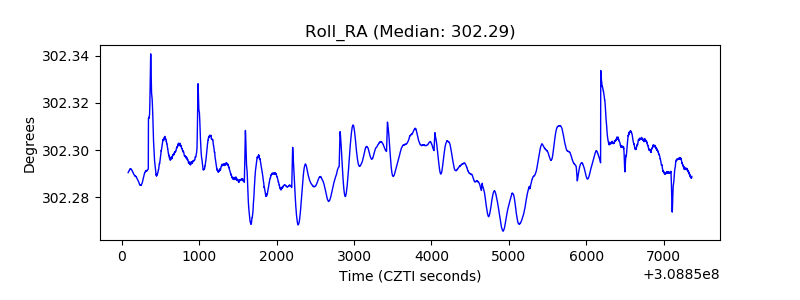 |
| Veto Counter | 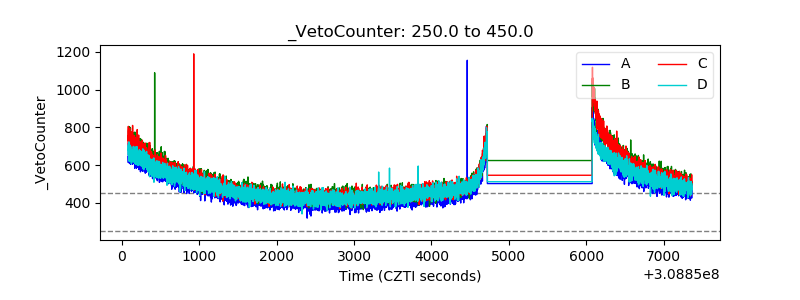 |