| Param | Original file | Final file |
|---|---|---|
| Filename | modeM0/AS1A07_041T01_9000003234_21886cztM0_level2.evt | modeM0/AS1A07_041T01_9000003234_21886cztM0_level2_quad_clean.evt |
| Size (bytes) | 481,988,160 | 99,478,080 |
| Size | 459.7 MB | 94.9 MB |
| Events in quadrant A | 3,161,600 | 659,741 |
| Events in quadrant B | 3,294,135 | 677,877 |
| Events in quadrant C | 3,240,576 | 638,563 |
| Events in quadrant D | 4,477,024 | 600,716 |
| Mode SS | |||
|---|---|---|---|
| Quadrant | BADHDUFLAG | Total packets | Discarded packets |
| A | 0 | 126 | 0 |
| B | 0 | 126 | 0 |
| C | 0 | 126 | 0 |
| D | 0 | 126 | 0 |
| Mode M9 | |||
|---|---|---|---|
| Quadrant | BADHDUFLAG | Total packets | Discarded packets |
| A | 0 | 18 | 0 |
| B | 0 | 19 | 0 |
| C | 0 | 19 | 0 |
| D | 0 | 19 | 0 |
| Mode M0 | |||
|---|---|---|---|
| Quadrant | BADHDUFLAG | Total packets | Discarded packets |
| A | 0 | 13359 | 2 |
| B | 0 | 13674 | 3 |
| C | 0 | 13406 | 2 |
| D | 0 | 17552 | 2 |
| Quadrant | Total seconds | Saturated seconds | Saturation percentage |
|---|---|---|---|
| A | 6247 | 44 | 0.704338% |
| B | 6246 | 55 | 0.880564% |
| C | 6246 | 74 | 1.184758% |
| D | 6246 | 226 | 3.618316% |
Noise dominated data is calculated using 1-second bins in cleaned event files. If a bin has >2000 counts, and if more than 50% of those come from <1% of pixels, then it is considered to be noise-dominated and hence unusable.
| Quadrant | # 1 sec bins | Bins with >0 counts | Bins with >2000 counts | High rate bins dominated by noise | Noise dominated (total time) | Noise dominated (detector-on time) | Marked lightcurve |
|---|---|---|---|---|---|---|---|
| A | 7602 | 6248 | 8 | 8 | 0.11% | 0.13% | 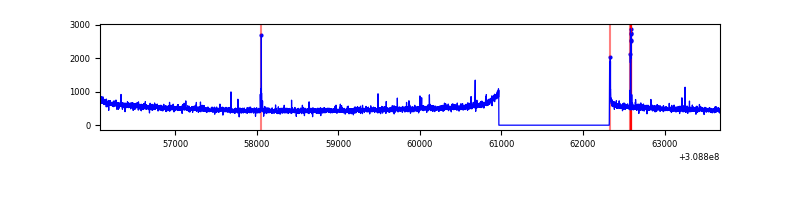 |
| B | 7601 | 6247 | 6 | 6 | 0.08% | 0.10% | 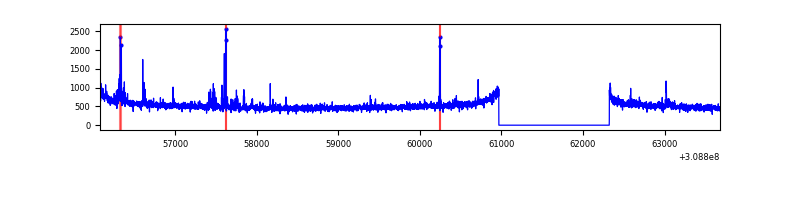 |
| C | 7601 | 6247 | 0 | 0 | 0.00% | 0.00% | 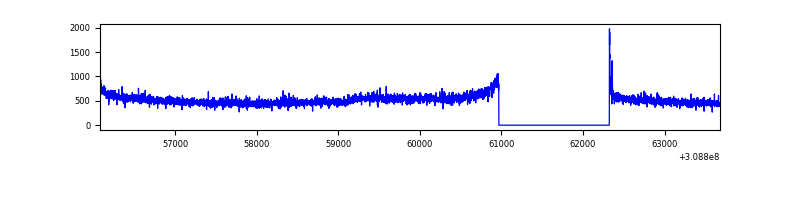 |
| D | 7601 | 6247 | 199 | 199 | 2.62% | 3.19% | 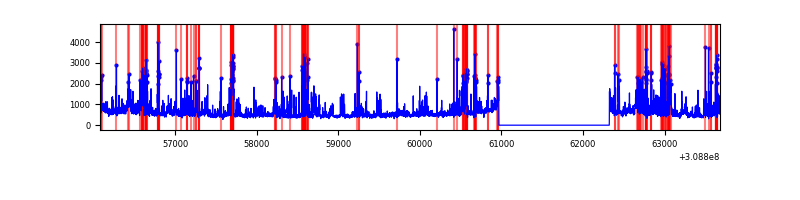 |
Top three noisy pixels from each quadrant. If the there are fewer than three noisy pixels in the level2.evt file, extra rows are filled as -1
| Pixel properties | Quadrant properties | ||||||
|---|---|---|---|---|---|---|---|
| Quadrant | DetID | PixID | Counts | Sigma | Mean | Median | Sigma |
| A | 4 | 2 | 33340 | 200.36 | 804 | 788 | 162.5 |
| A | 5 | 16 | 22301 | 132.41 | 804 | 788 | 162.5 |
| A | 13 | 254 | 12041 | 69.26 | 804 | 788 | 162.5 |
| B | 0 | 197 | 26590 | 170.77 | 809 | 793 | 151.1 |
| B | 3 | 64 | 23961 | 153.36 | 809 | 793 | 151.1 |
| B | 15 | 33 | 21089 | 134.35 | 809 | 793 | 151.1 |
| C | 10 | 91 | 130412 | 738.09 | 761 | 768 | 175.6 |
| C | 14 | 238 | 124660 | 705.34 | 761 | 768 | 175.6 |
| C | 0 | 10 | 9370 | 48.97 | 761 | 768 | 175.6 |
| D | 1 | 52 | 1149315 | 6251.29 | 755 | 731 | 183.7 |
| D | 7 | 238 | 286365 | 1554.59 | 755 | 731 | 183.7 |
| D | 13 | 174 | 76822 | 414.13 | 755 | 731 | 183.7 |
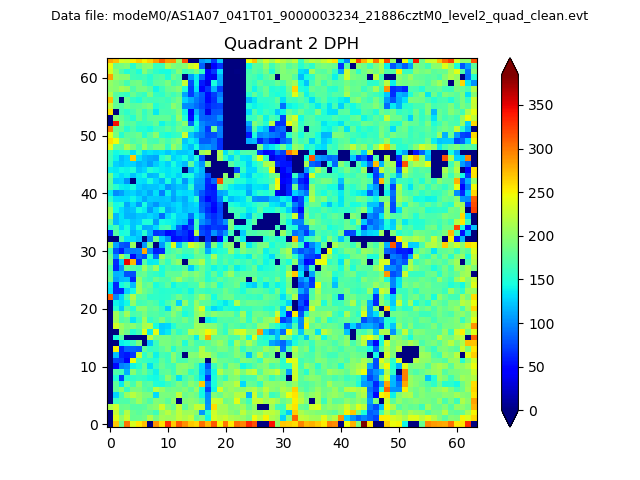
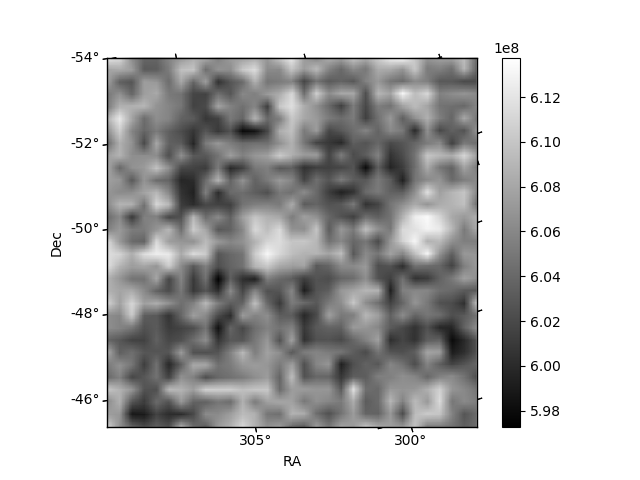
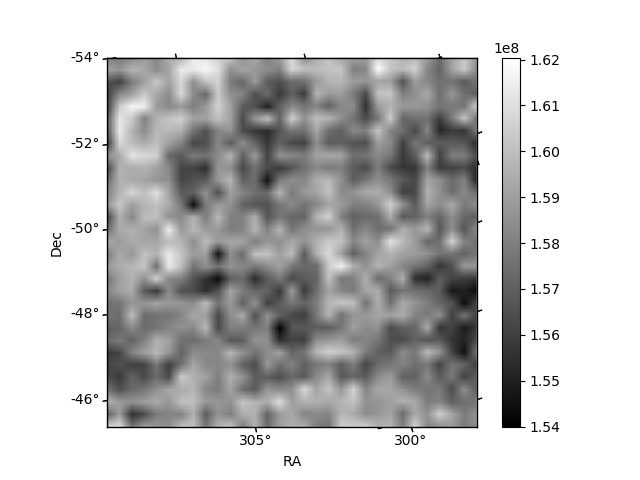
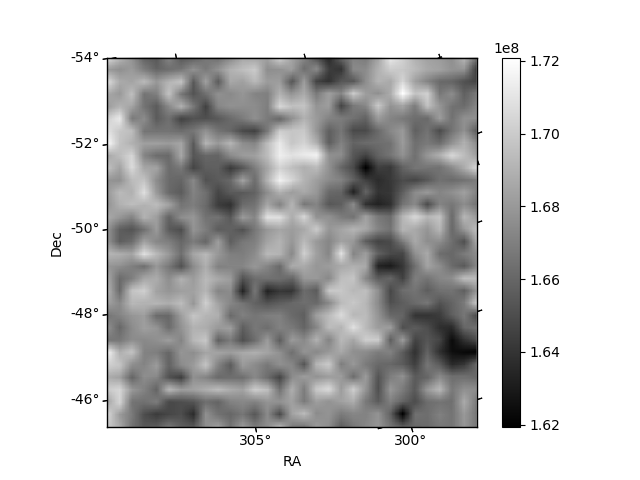
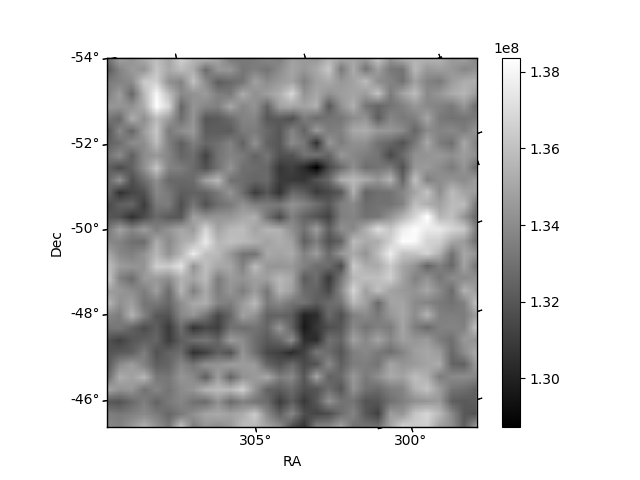
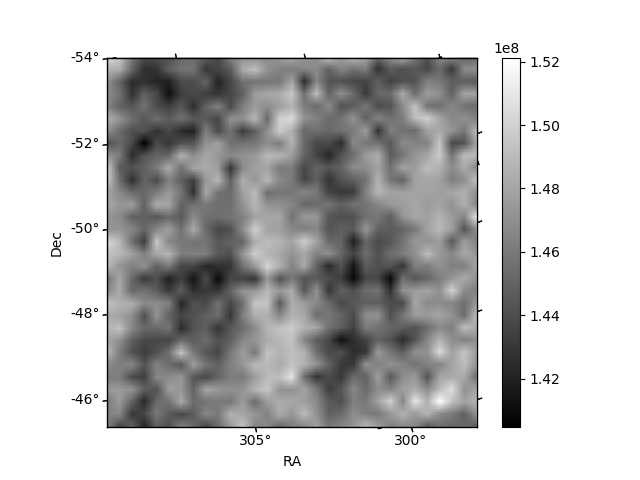
Histogram calculated using DETX and DETY for each event in the final _common_clean file
| Quadrant A | 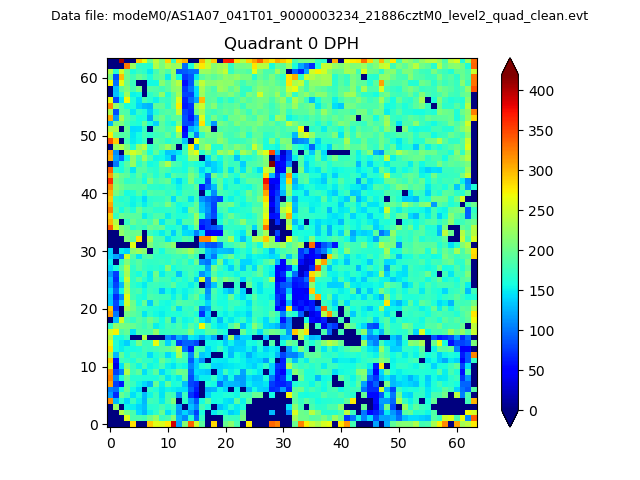 |
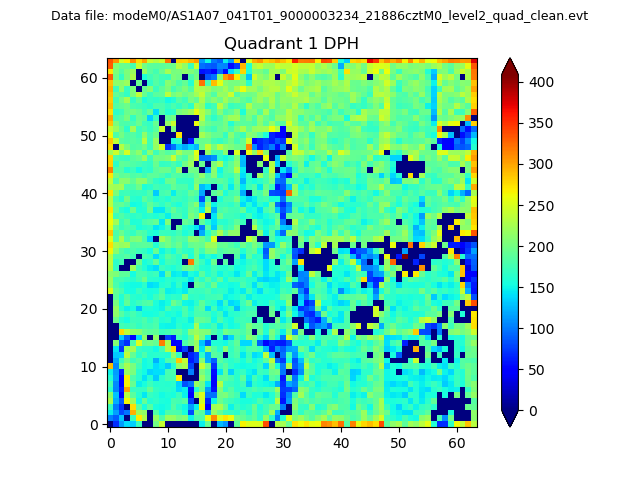 |
Quadrant B |
|---|---|---|---|
| Quadrant D | 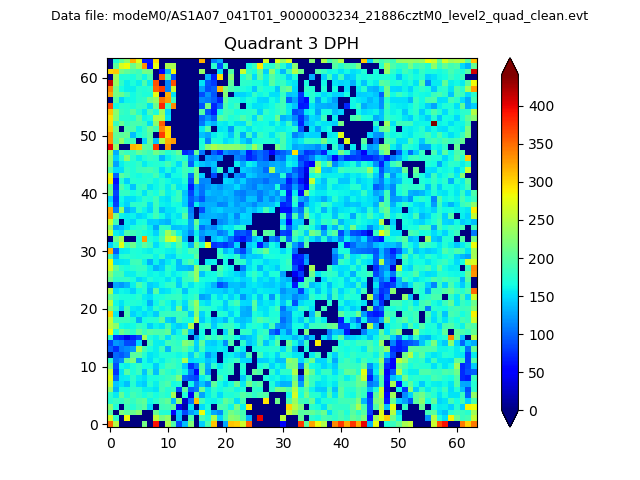 |
 |
Quadrant C |
| Plot type | Count rate plots | Images |
|---|---|---|
| Comparison with Poisson distribution Blue bars denote a histogram of data divided into 1 sec bins. Red curve is a Poisson curve with rate = median count rate of data. |
 |
 |
| Quadrant-wise count rates Data is divided into 100 sec bins |
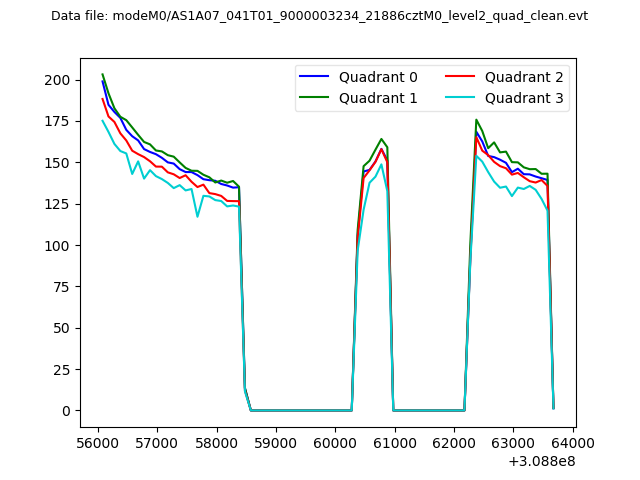 |
|
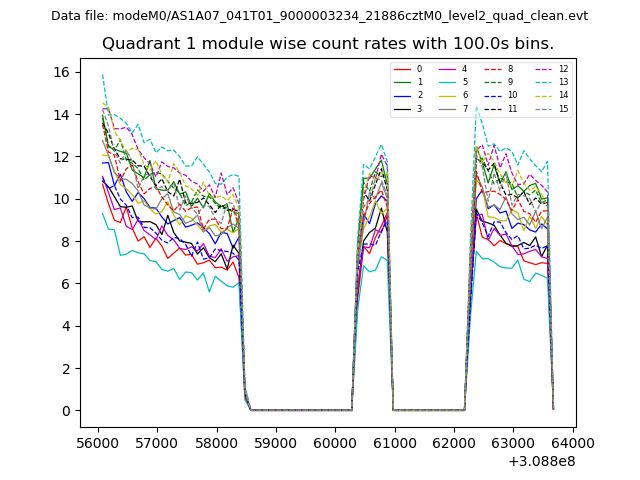
| Module-wise count rates for Quadrant A Data is divided into 100 sec bins |
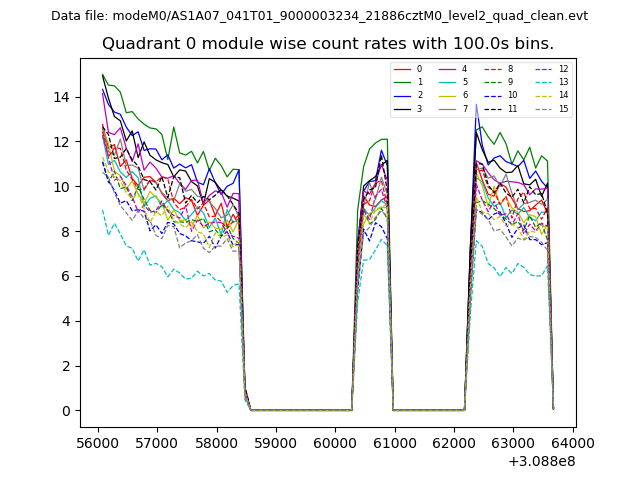 |
 |
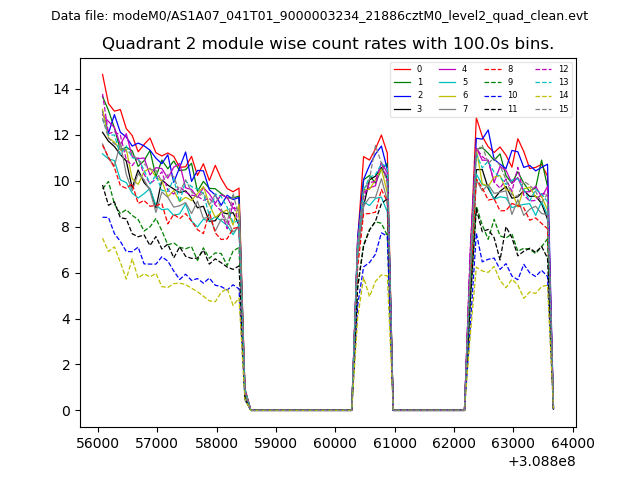
| Module-wise count rates for Quadrant B Data is divided into 100 sec bins |
 |
 |
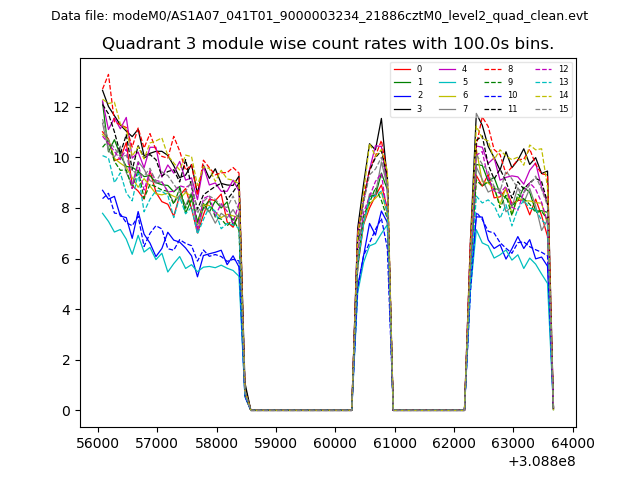
| Module-wise count rates for Quadrant C Data is divided into 100 sec bins |
 |
 |
| Module-wise count rates for Quadrant D Data is divided into 100 sec bins |
 |
 |
| Parameter | Plot |
|---|---|
| CZT HV Monitor | 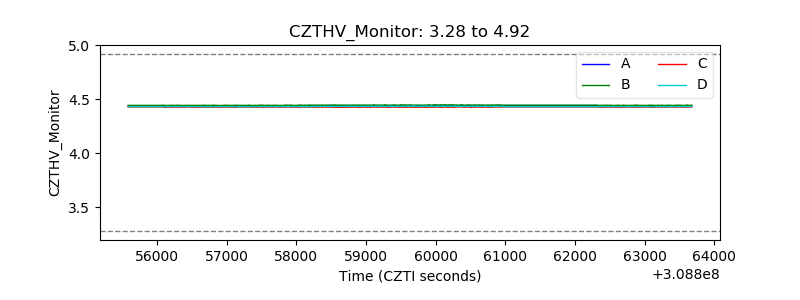 |
| D_VDD | 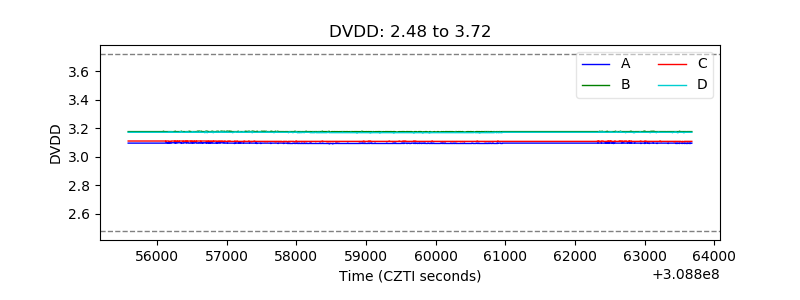 |
| Temperature 1 |  |
| Veto HV Monitor | 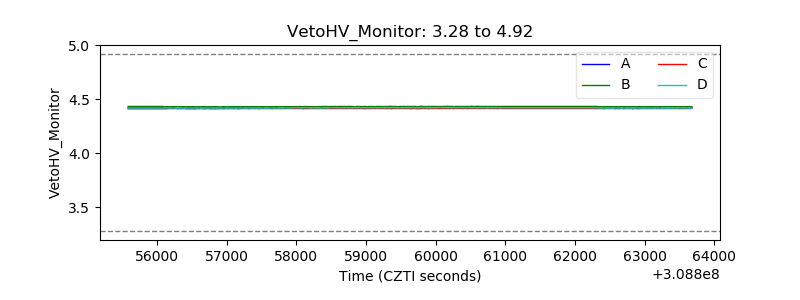 |
| Veto LLD | 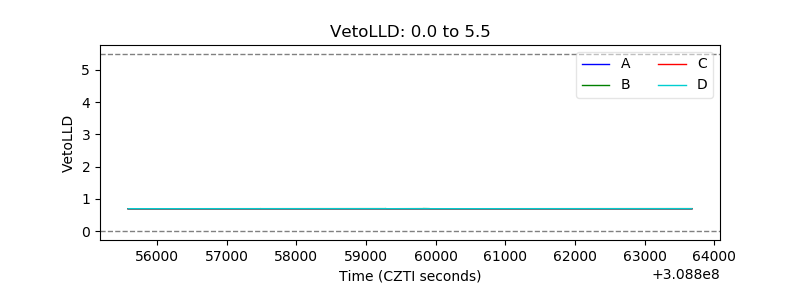 |
| Alpha Counter |  |
| _CPM_Rate | 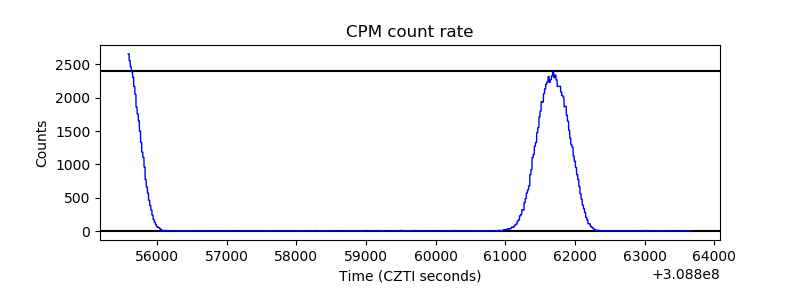 |
| CZT Counter |  |
| +2.5 Volts monitor |  |
| +5 Volts monitor |  |
| _ROLL_ROT | 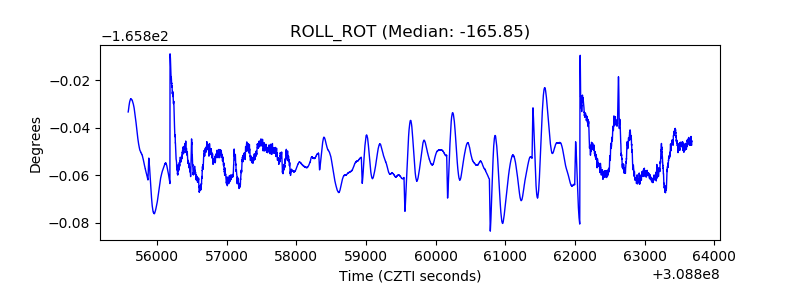 |
| _Roll_DEC | 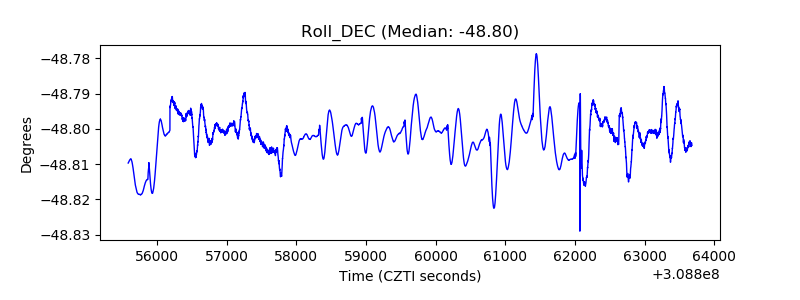 |
| _Roll_RA |  |
| Veto Counter | 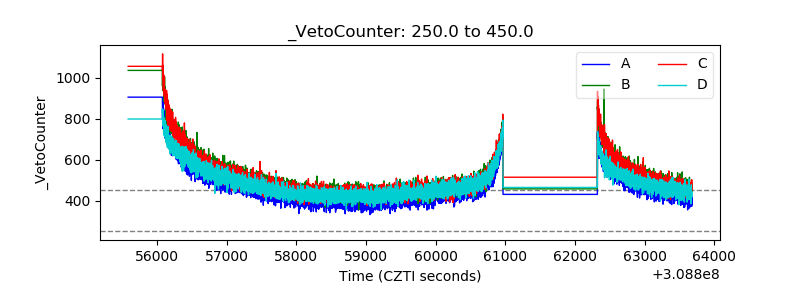 |