| Param | Original file | Final file |
|---|---|---|
| Filename | modeM0/AS1A07_041T01_9000003234_21889cztM0_level2.evt | modeM0/AS1A07_041T01_9000003234_21889cztM0_level2_quad_clean.evt |
| Size (bytes) | 507,441,600 | 95,506,560 |
| Size | 483.9 MB | 91.1 MB |
| Events in quadrant A | 3,436,079 | 601,530 |
| Events in quadrant B | 3,639,301 | 614,199 |
| Events in quadrant C | 3,409,416 | 592,993 |
| Events in quadrant D | 4,377,937 | 565,887 |
| Mode SS | |||
|---|---|---|---|
| Quadrant | BADHDUFLAG | Total packets | Discarded packets |
| A | 0 | 150 | 0 |
| B | 0 | 150 | 0 |
| C | 0 | 150 | 0 |
| D | 0 | 150 | 0 |
| Mode M9 | |||
|---|---|---|---|
| Quadrant | BADHDUFLAG | Total packets | Discarded packets |
| A | 0 | 12 | 0 |
| B | 0 | 13 | 0 |
| C | 0 | 13 | 0 |
| D | 0 | 13 | 0 |
| Mode M0 | |||
|---|---|---|---|
| Quadrant | BADHDUFLAG | Total packets | Discarded packets |
| A | 0 | 15301 | 2 |
| B | 0 | 15743 | 2 |
| C | 0 | 15179 | 2 |
| D | 0 | 18044 | 2 |
| Quadrant | Total seconds | Saturated seconds | Saturation percentage |
|---|---|---|---|
| A | 7440 | 33 | 0.443548% |
| B | 7440 | 55 | 0.739247% |
| C | 7440 | 63 | 0.846774% |
| D | 7440 | 200 | 2.688172% |
Noise dominated data is calculated using 1-second bins in cleaned event files. If a bin has >2000 counts, and if more than 50% of those come from <1% of pixels, then it is considered to be noise-dominated and hence unusable.
| Quadrant | # 1 sec bins | Bins with >0 counts | Bins with >2000 counts | High rate bins dominated by noise | Noise dominated (total time) | Noise dominated (detector-on time) | Marked lightcurve |
|---|---|---|---|---|---|---|---|
| A | 7940 | 7441 | 2 | 2 | 0.03% | 0.03% | 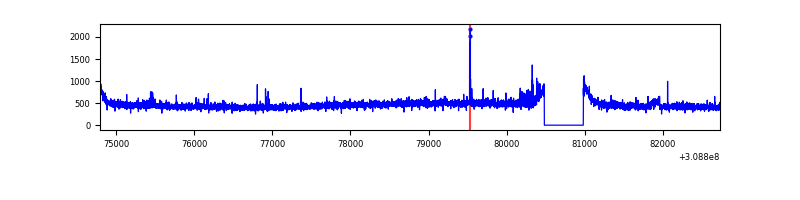 |
| B | 7940 | 7441 | 7 | 7 | 0.09% | 0.09% | 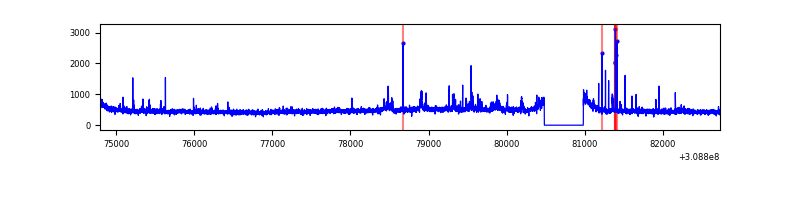 |
| C | 7940 | 7441 | 0 | 0 | 0.00% | 0.00% | 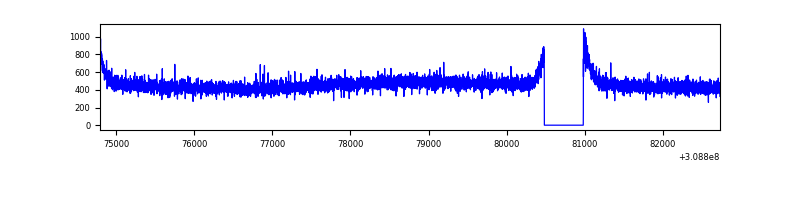 |
| D | 7940 | 7441 | 188 | 188 | 2.37% | 2.53% | 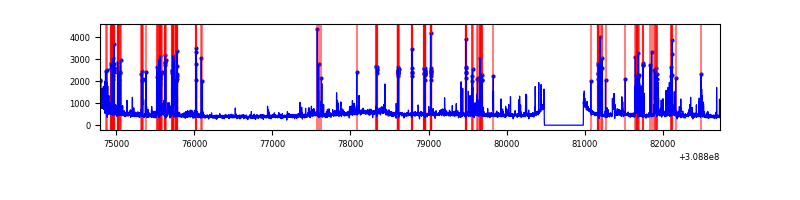 |
Top three noisy pixels from each quadrant. If the there are fewer than three noisy pixels in the level2.evt file, extra rows are filled as -1
| Pixel properties | Quadrant properties | ||||||
|---|---|---|---|---|---|---|---|
| Quadrant | DetID | PixID | Counts | Sigma | Mean | Median | Sigma |
| A | 4 | 2 | 31839 | 176.01 | 874 | 856 | 176.0 |
| A | 5 | 16 | 22991 | 125.74 | 874 | 856 | 176.0 |
| A | 13 | 254 | 14233 | 75.99 | 874 | 856 | 176.0 |
| B | 0 | 230 | 45662 | 267.06 | 878 | 857 | 167.8 |
| B | 3 | 64 | 40272 | 234.93 | 878 | 857 | 167.8 |
| B | 4 | 171 | 31404 | 182.07 | 878 | 857 | 167.8 |
| C | 14 | 238 | 131915 | 669.0 | 838 | 842 | 195.9 |
| C | 13 | 61 | 5774 | 25.17 | 838 | 842 | 195.9 |
| C | 8 | 128 | 4667 | 19.52 | 838 | 842 | 195.9 |
| D | 1 | 52 | 881581 | 4340.37 | 835 | 810 | 202.9 |
| D | 7 | 238 | 153991 | 754.86 | 835 | 810 | 202.9 |
| D | 13 | 174 | 81930 | 399.75 | 835 | 810 | 202.9 |
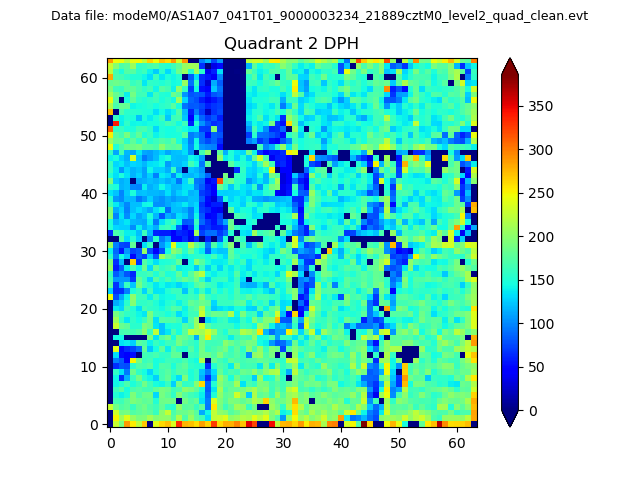
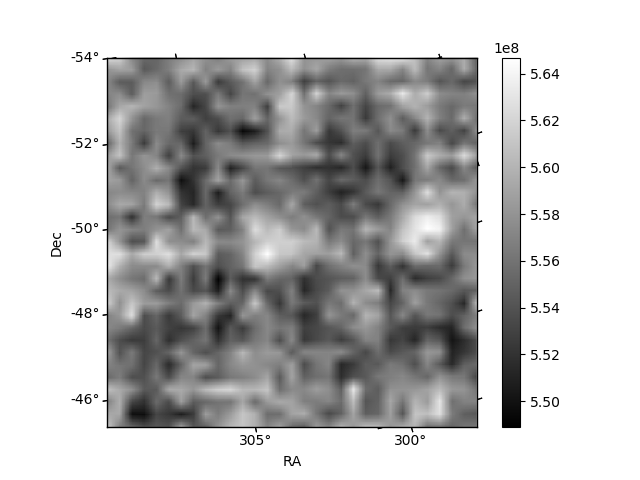
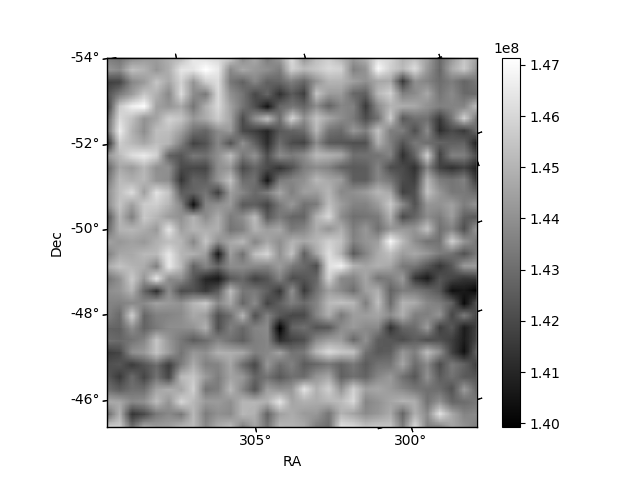
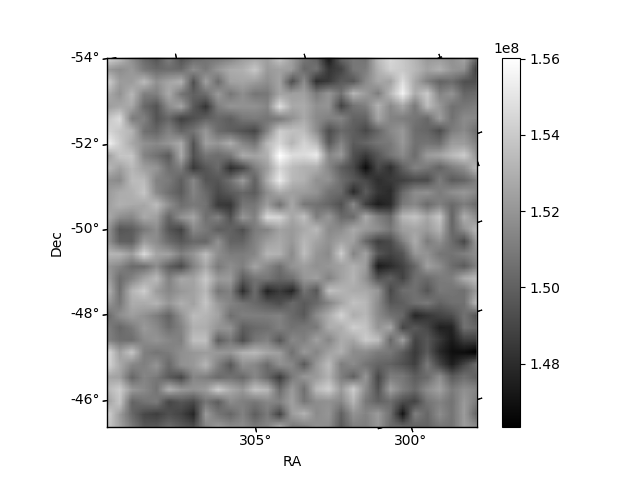
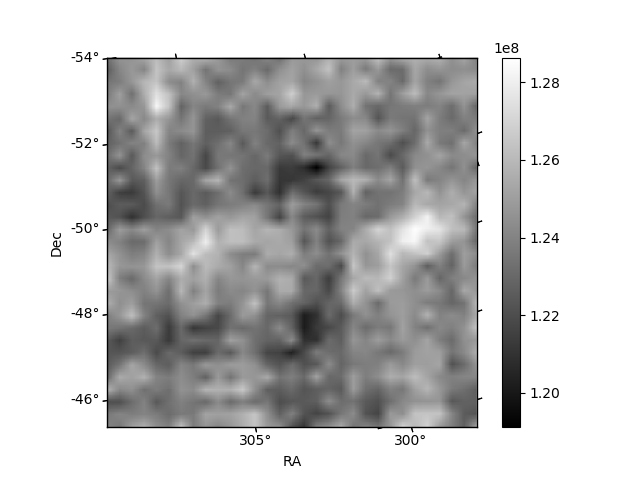
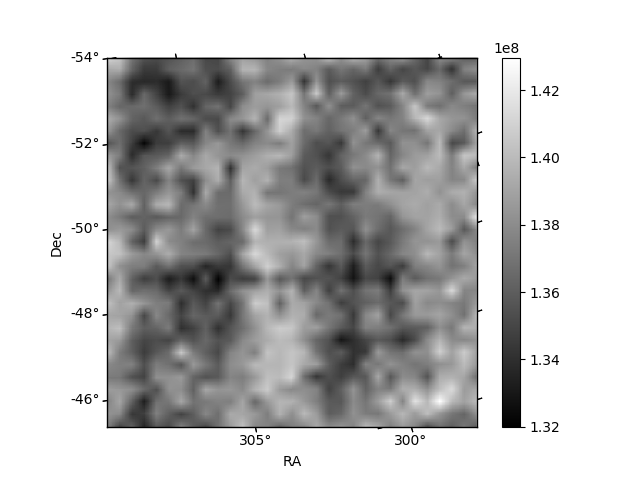
Histogram calculated using DETX and DETY for each event in the final _common_clean file
| Quadrant A | 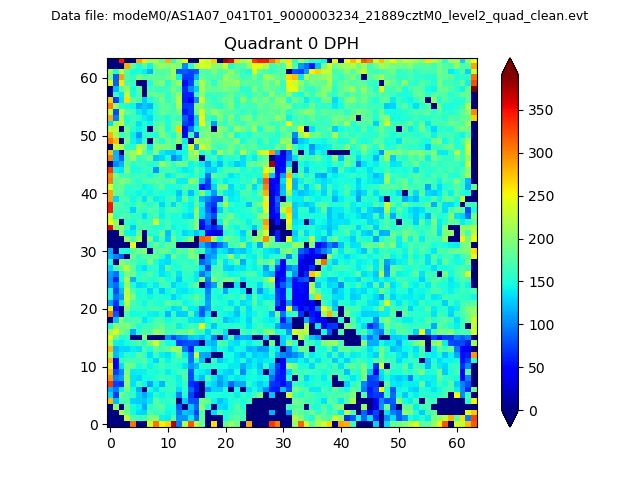 |
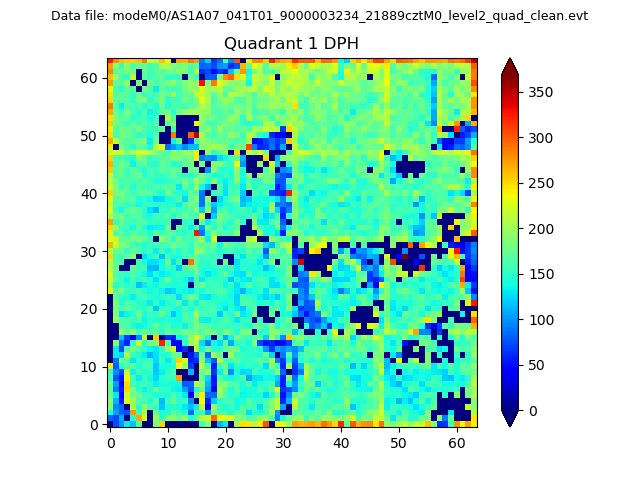 |
Quadrant B |
|---|---|---|---|
| Quadrant D | 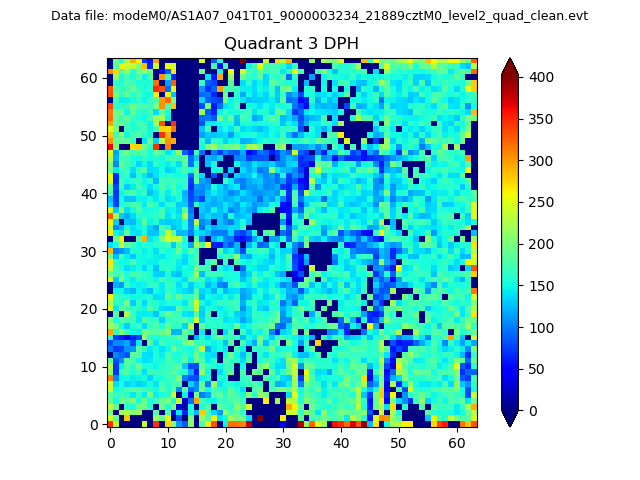 |
 |
Quadrant C |
| Plot type | Count rate plots | Images |
|---|---|---|
| Comparison with Poisson distribution Blue bars denote a histogram of data divided into 1 sec bins. Red curve is a Poisson curve with rate = median count rate of data. |
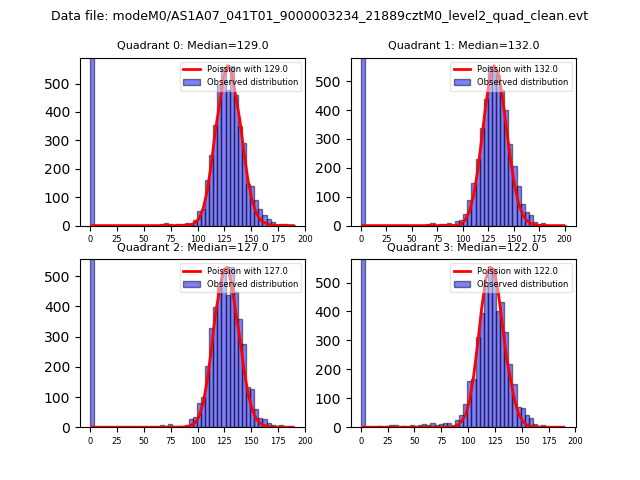 |
 |
| Quadrant-wise count rates Data is divided into 100 sec bins |
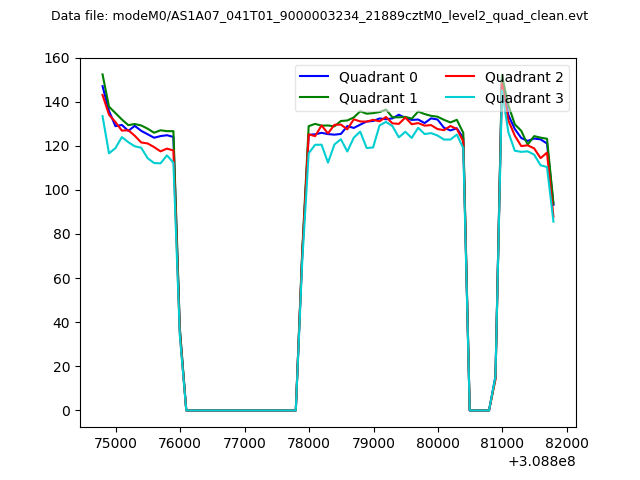 |
|
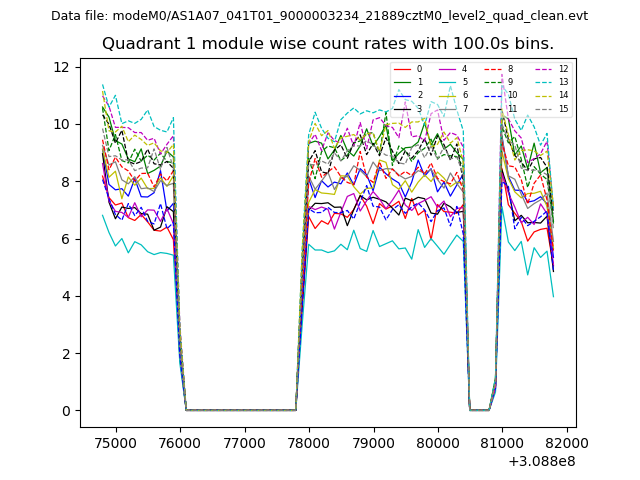
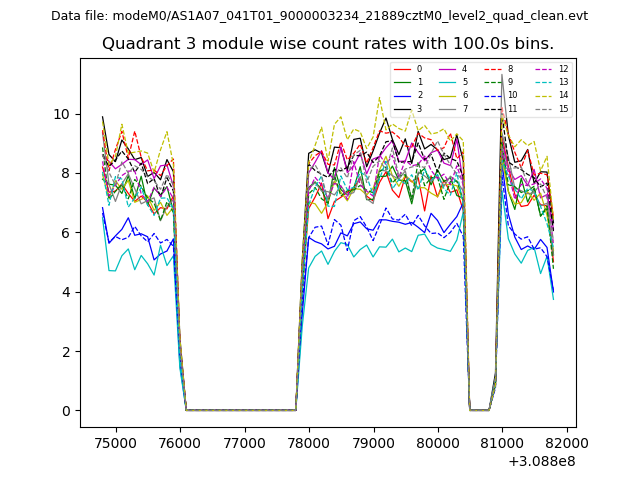
| Module-wise count rates for Quadrant A Data is divided into 100 sec bins |
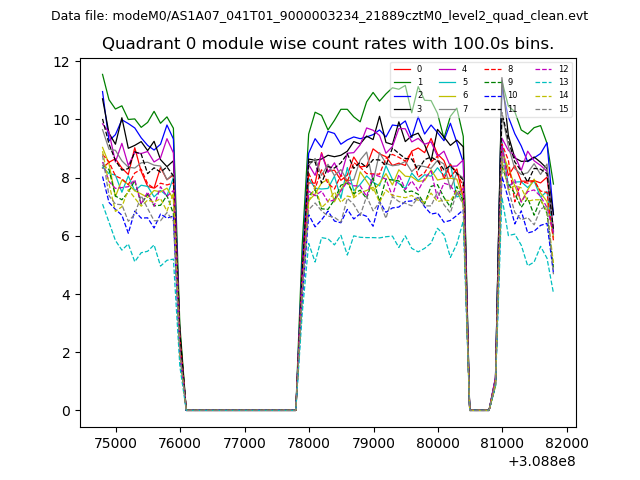 |
 |
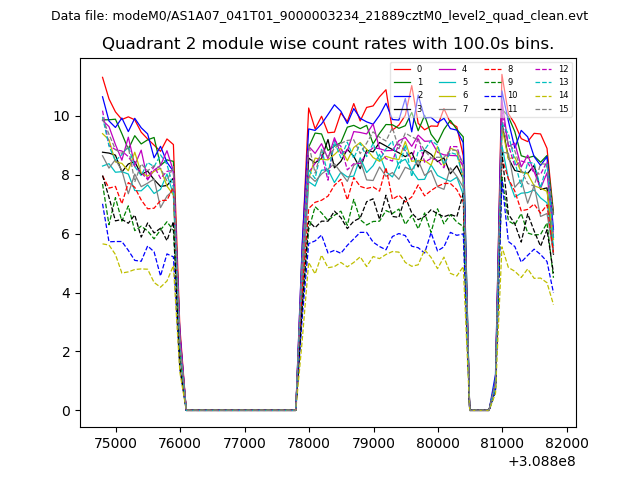
| Module-wise count rates for Quadrant B Data is divided into 100 sec bins |
 |
 |
| Module-wise count rates for Quadrant C Data is divided into 100 sec bins |
 |
 |
| Module-wise count rates for Quadrant D Data is divided into 100 sec bins |
 |
 |
| Parameter | Plot |
|---|---|
| CZT HV Monitor | 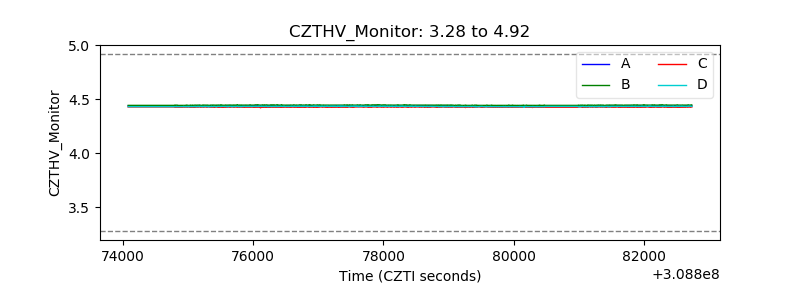 |
| D_VDD | 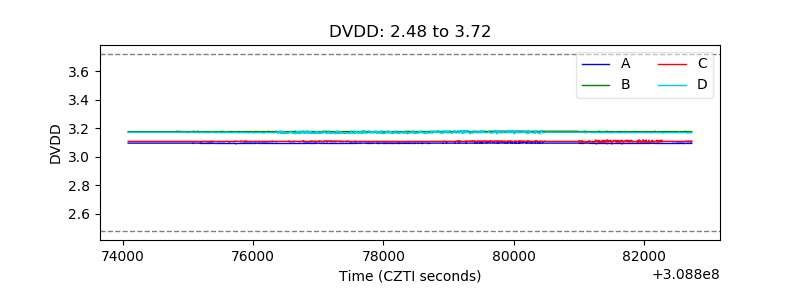 |
| Temperature 1 | 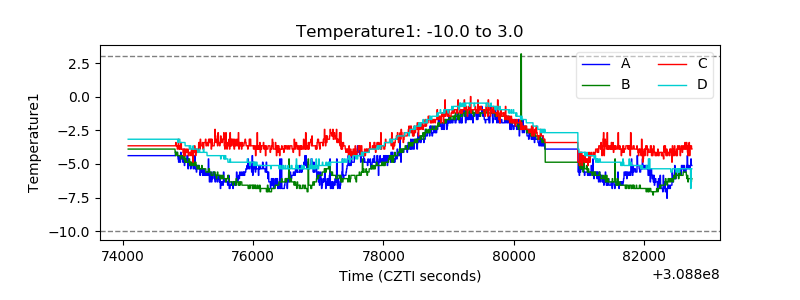 |
| Veto HV Monitor | 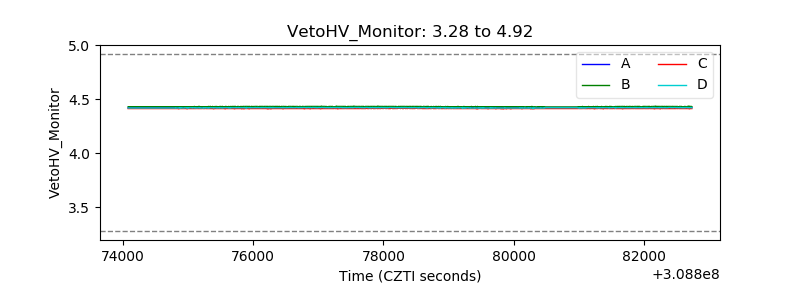 |
| Veto LLD | 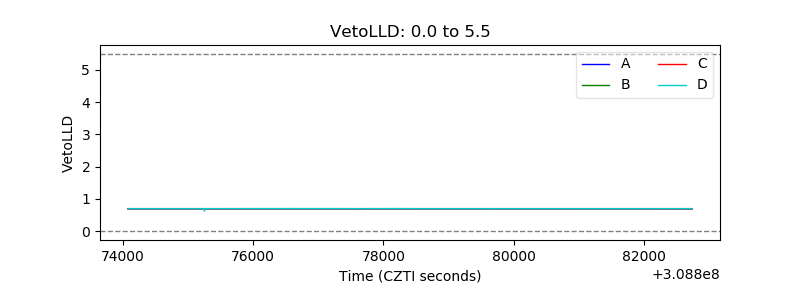 |
| Alpha Counter | 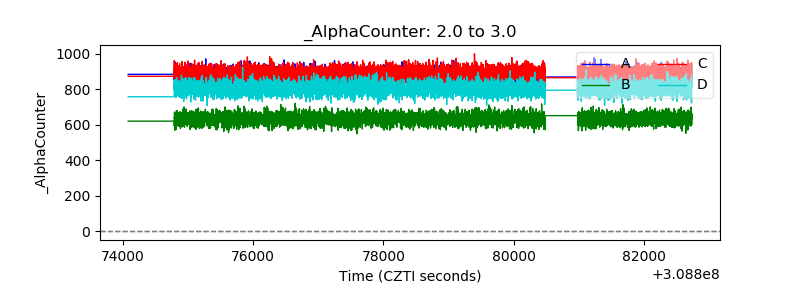 |
| _CPM_Rate | 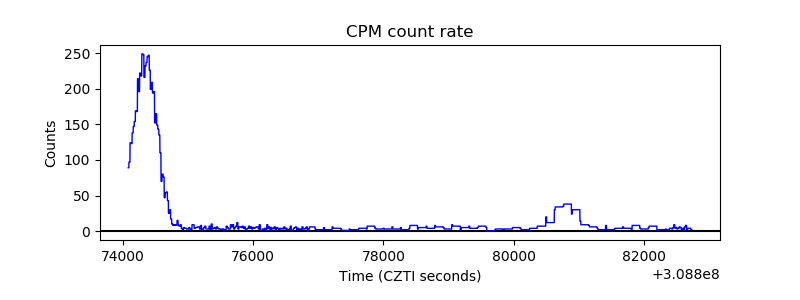 |
| CZT Counter | 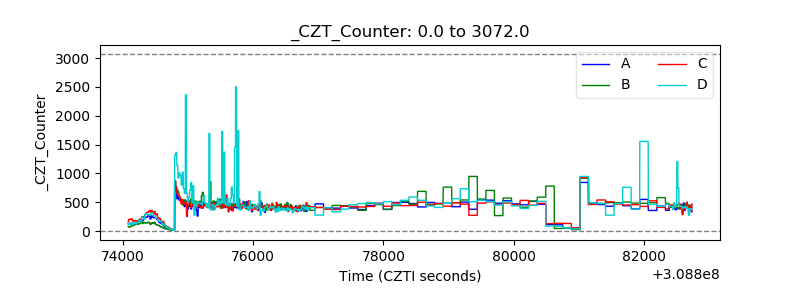 |
| +2.5 Volts monitor | 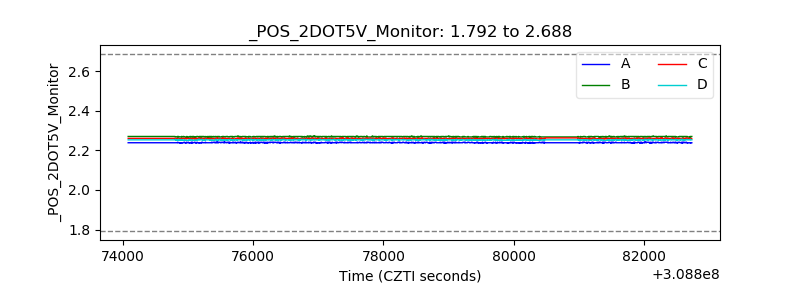 |
| +5 Volts monitor |  |
| _ROLL_ROT | 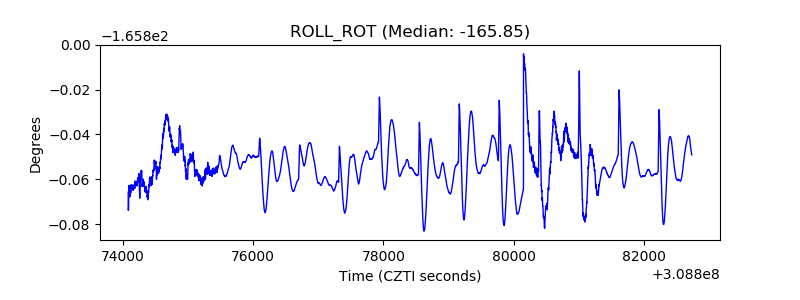 |
| _Roll_DEC | 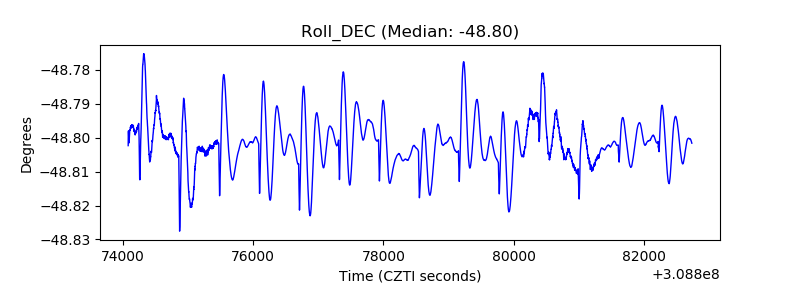 |
| _Roll_RA | 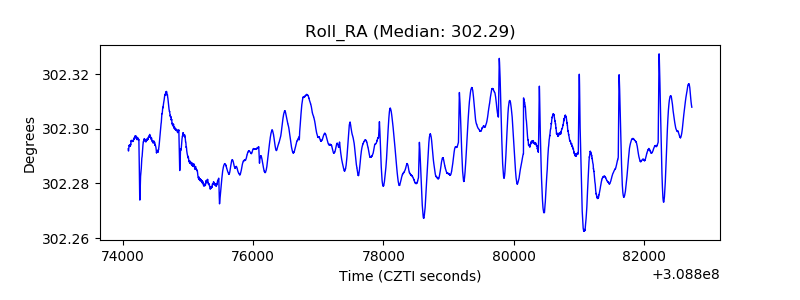 |
| Veto Counter | 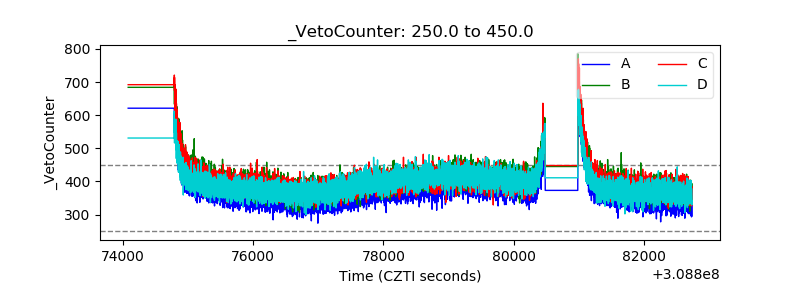 |