| Param | Original file | Final file |
|---|---|---|
| Filename | modeM0/AS1A07_041T01_9000003234_21890cztM0_level2.evt | modeM0/AS1A07_041T01_9000003234_21890cztM0_level2_quad_clean.evt |
| Size (bytes) | 493,954,560 | 87,909,120 |
| Size | 471.1 MB | 83.8 MB |
| Events in quadrant A | 3,400,676 | 541,438 |
| Events in quadrant B | 3,556,819 | 554,459 |
| Events in quadrant C | 3,387,651 | 534,088 |
| Events in quadrant D | 4,112,004 | 517,589 |
| Mode SS | |||
|---|---|---|---|
| Quadrant | BADHDUFLAG | Total packets | Discarded packets |
| A | 0 | 152 | 0 |
| B | 0 | 152 | 0 |
| C | 0 | 152 | 0 |
| D | 0 | 152 | 0 |
| Mode M9 | |||
|---|---|---|---|
| Quadrant | BADHDUFLAG | Total packets | Discarded packets |
| A | 0 | 2 | 0 |
| B | 0 | 2 | 0 |
| C | 0 | 2 | 0 |
| D | 0 | 2 | 0 |
| Mode M0 | |||
|---|---|---|---|
| Quadrant | BADHDUFLAG | Total packets | Discarded packets |
| A | 0 | 15214 | 1 |
| B | 0 | 15428 | 1 |
| C | 0 | 15092 | 1 |
| D | 0 | 17241 | 1 |
| Quadrant | Total seconds | Saturated seconds | Saturation percentage |
|---|---|---|---|
| A | 7386 | 36 | 0.487409% |
| B | 7386 | 61 | 0.825887% |
| C | 7386 | 82 | 1.110209% |
| D | 7386 | 113 | 1.529921% |
Noise dominated data is calculated using 1-second bins in cleaned event files. If a bin has >2000 counts, and if more than 50% of those come from <1% of pixels, then it is considered to be noise-dominated and hence unusable.
| Quadrant | # 1 sec bins | Bins with >0 counts | Bins with >2000 counts | High rate bins dominated by noise | Noise dominated (total time) | Noise dominated (detector-on time) | Marked lightcurve |
|---|---|---|---|---|---|---|---|
| A | 7656 | 7387 | 4 | 4 | 0.05% | 0.05% | 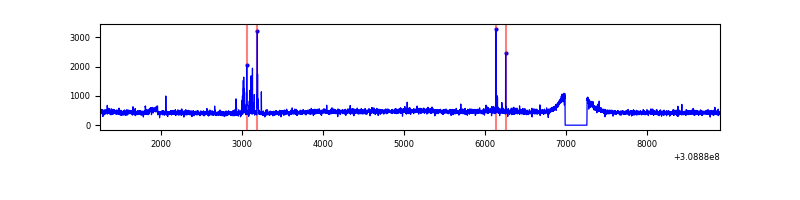 |
| B | 7656 | 7387 | 6 | 6 | 0.08% | 0.08% | 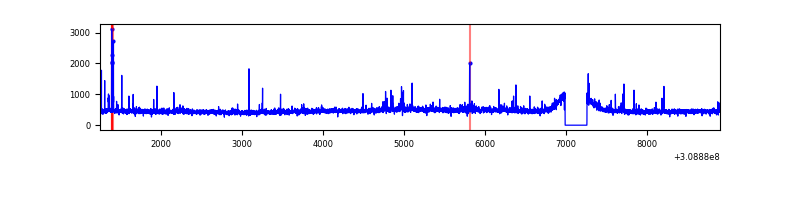 |
| C | 7656 | 7386 | 0 | 0 | 0.00% | 0.00% | 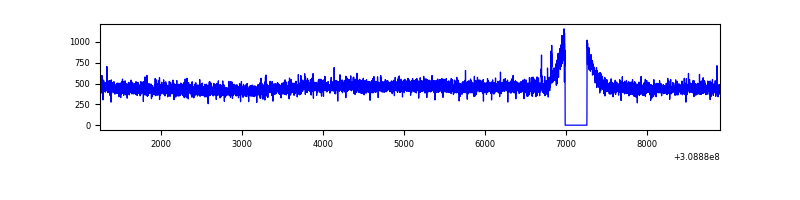 |
| D | 7656 | 7387 | 69 | 69 | 0.90% | 0.93% | 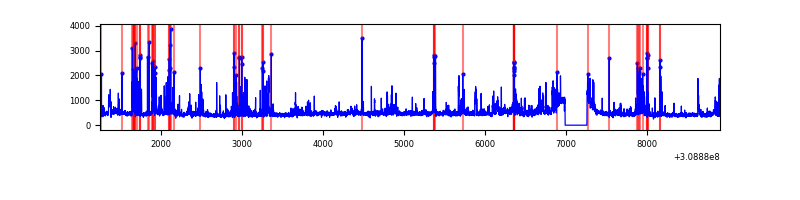 |
Top three noisy pixels from each quadrant. If the there are fewer than three noisy pixels in the level2.evt file, extra rows are filled as -1
| Pixel properties | Quadrant properties | ||||||
|---|---|---|---|---|---|---|---|
| Quadrant | DetID | PixID | Counts | Sigma | Mean | Median | Sigma |
| A | 4 | 2 | 60550 | 340.73 | 861 | 844 | 175.2 |
| A | 5 | 16 | 14960 | 80.56 | 861 | 844 | 175.2 |
| A | 13 | 254 | 13266 | 70.89 | 861 | 844 | 175.2 |
| B | 4 | 171 | 35772 | 209.83 | 868 | 845 | 166.5 |
| B | 0 | 230 | 29780 | 173.83 | 868 | 845 | 166.5 |
| B | 0 | 197 | 29235 | 170.55 | 868 | 845 | 166.5 |
| C | 14 | 238 | 130839 | 663.86 | 830 | 833 | 195.8 |
| C | 10 | 22 | 8408 | 38.68 | 830 | 833 | 195.8 |
| C | 8 | 128 | 8103 | 37.12 | 830 | 833 | 195.8 |
| D | 1 | 52 | 627086 | 3065.2 | 832 | 808 | 204.3 |
| D | 2 | 136 | 115850 | 563.05 | 832 | 808 | 204.3 |
| D | 13 | 174 | 87054 | 422.12 | 832 | 808 | 204.3 |
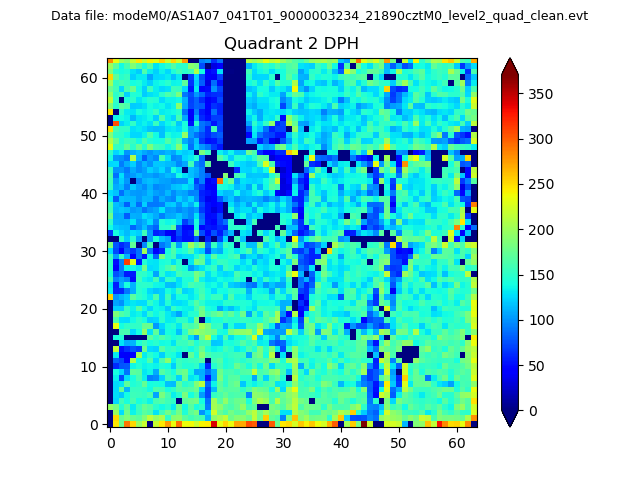
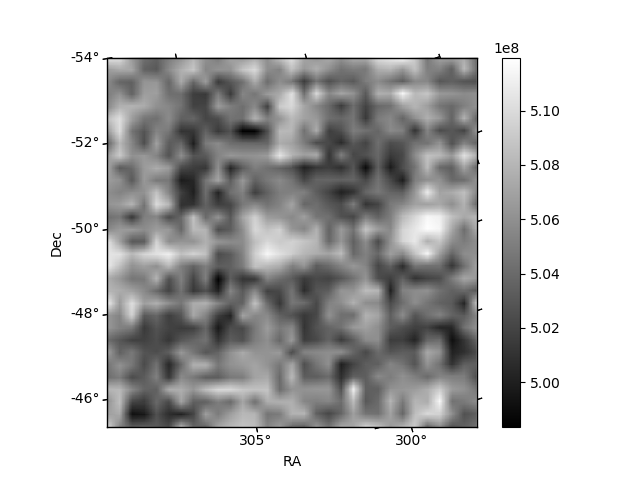
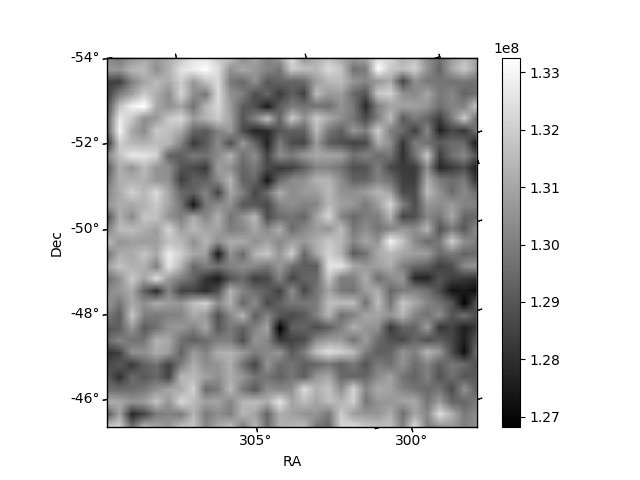
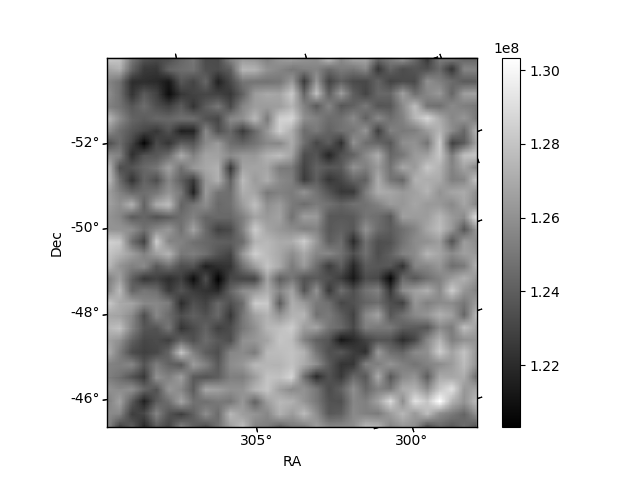
Histogram calculated using DETX and DETY for each event in the final _common_clean file
| Quadrant A | 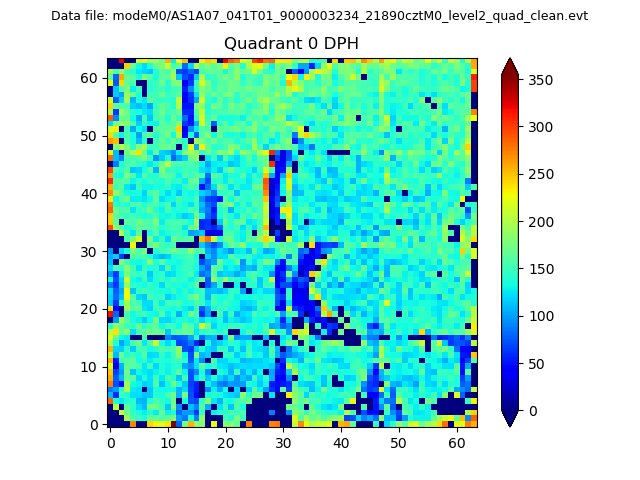 |
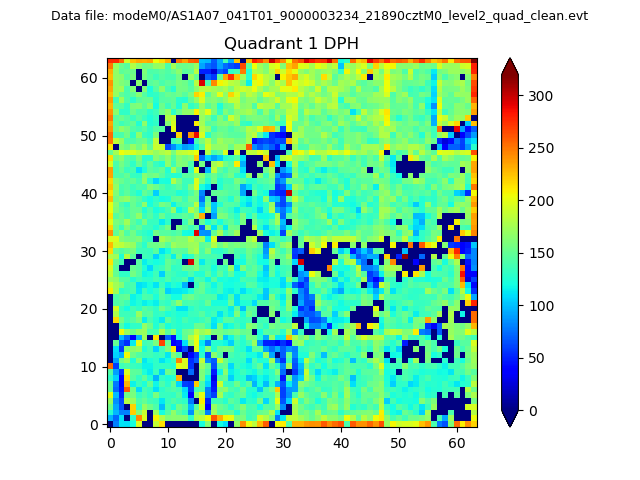 |
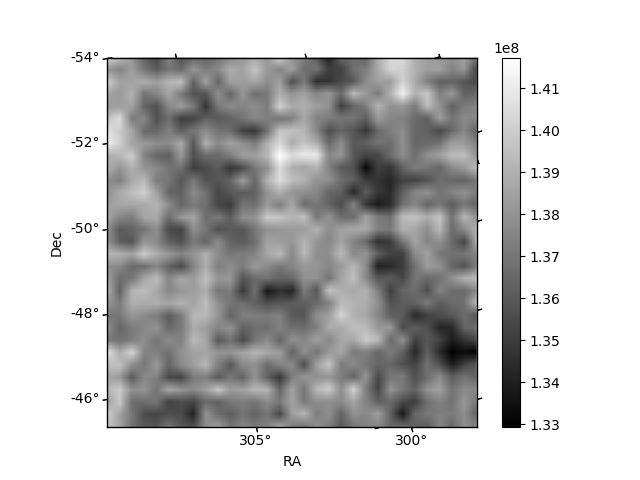
Quadrant B |
|---|---|---|---|
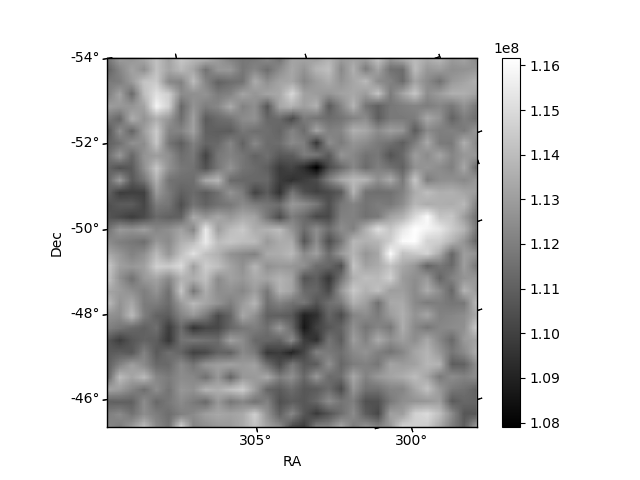
| Quadrant D | 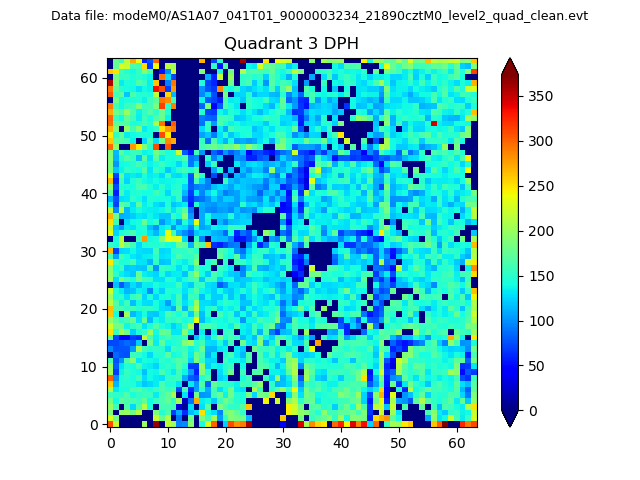 |
 |
Quadrant C |
| Plot type | Count rate plots | Images |
|---|---|---|
| Comparison with Poisson distribution Blue bars denote a histogram of data divided into 1 sec bins. Red curve is a Poisson curve with rate = median count rate of data. |
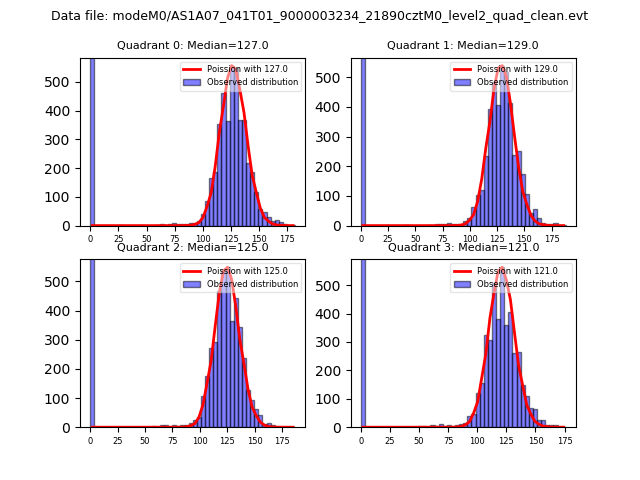 |
 |
| Quadrant-wise count rates Data is divided into 100 sec bins |
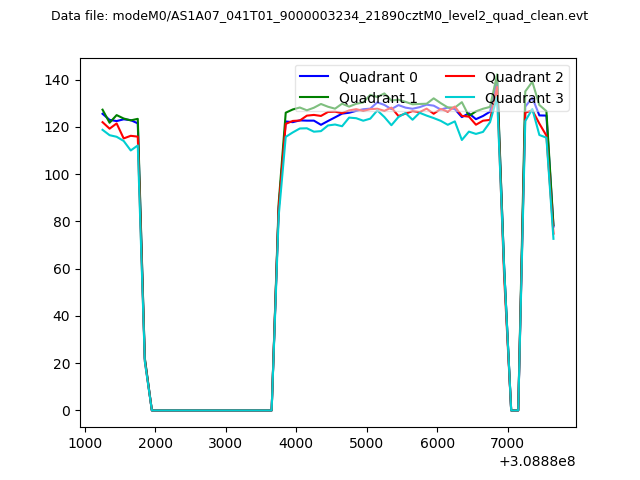 |
|
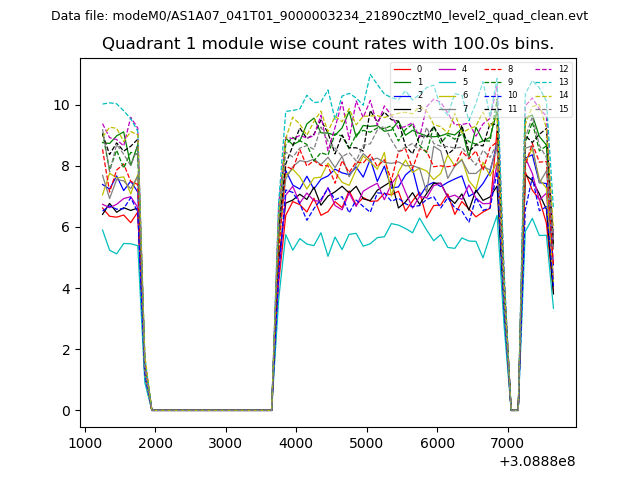
| Module-wise count rates for Quadrant A Data is divided into 100 sec bins |
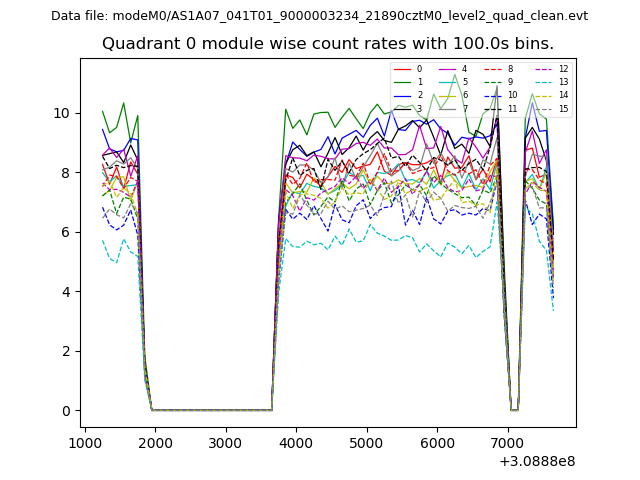 |
 |
| Module-wise count rates for Quadrant B Data is divided into 100 sec bins |
 |
 |
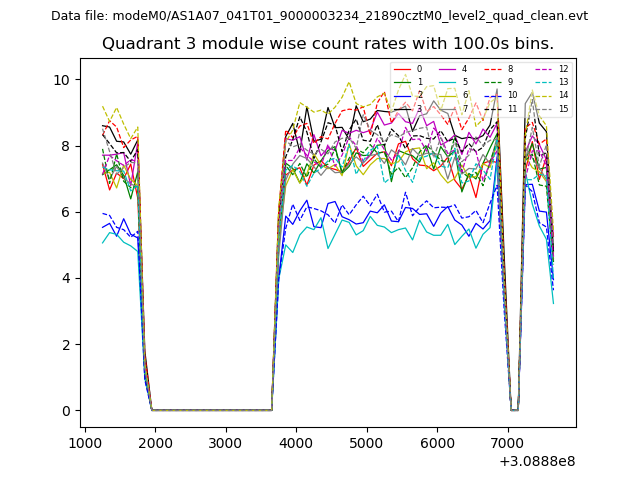
| Module-wise count rates for Quadrant C Data is divided into 100 sec bins |
 |
 |
| Module-wise count rates for Quadrant D Data is divided into 100 sec bins |
 |
 |
| Parameter | Plot |
|---|---|
| CZT HV Monitor | 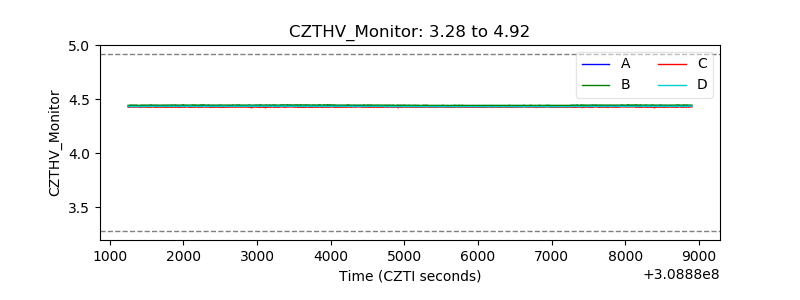 |
| D_VDD | 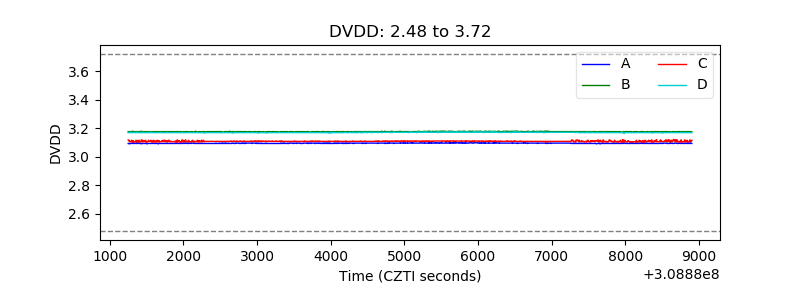 |
| Temperature 1 | 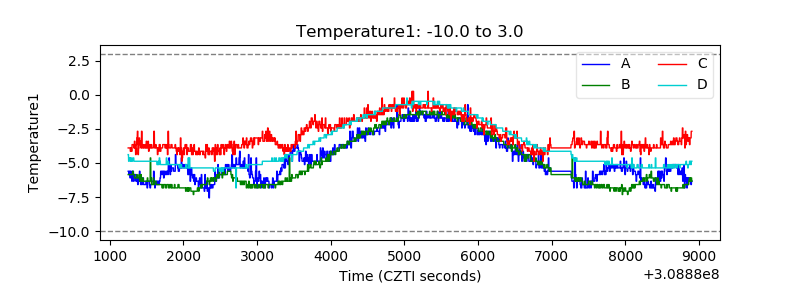 |
| Veto HV Monitor | 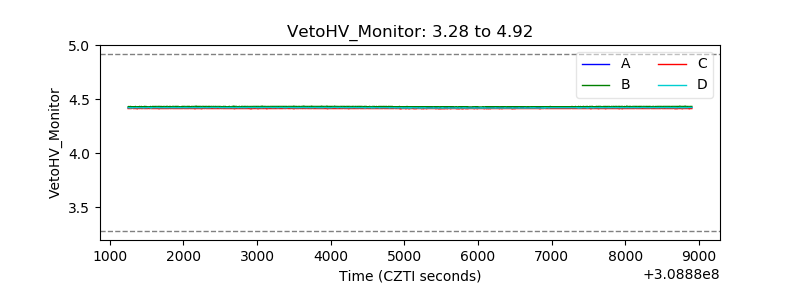 |
| Veto LLD | 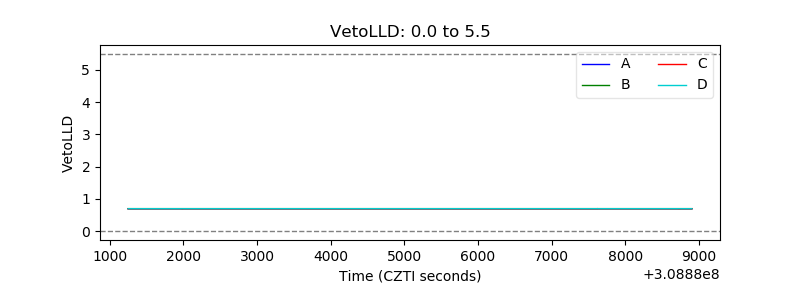 |
| Alpha Counter | 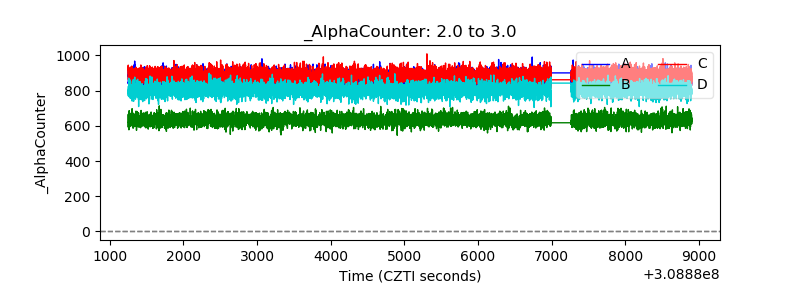 |
| _CPM_Rate | 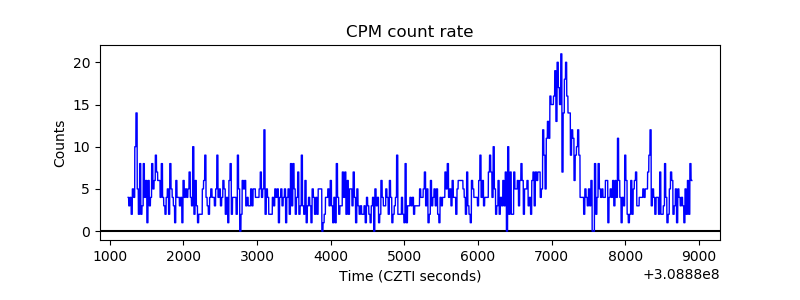 |
| CZT Counter | 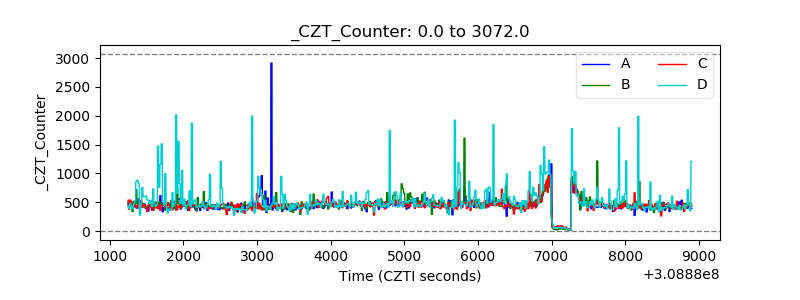 |
| +2.5 Volts monitor |  |
| +5 Volts monitor |  |
| _ROLL_ROT | 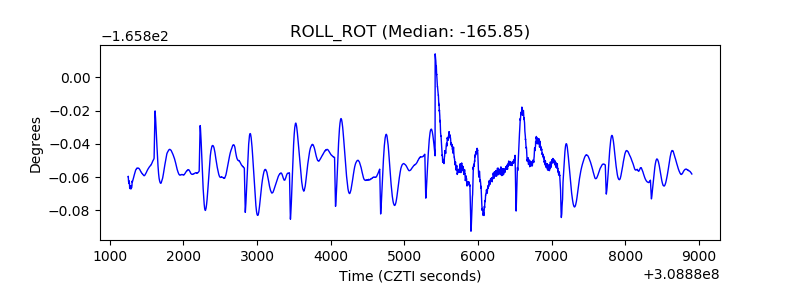 |
| _Roll_DEC | 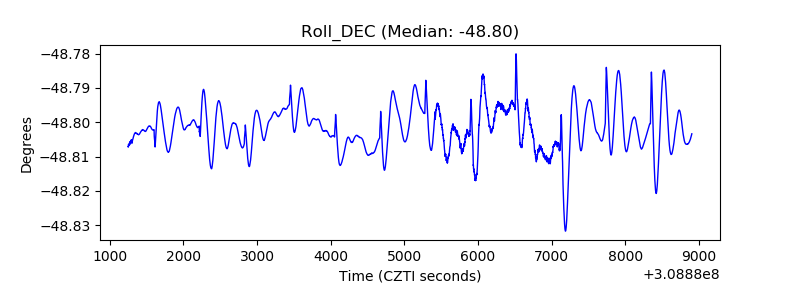 |
| _Roll_RA | 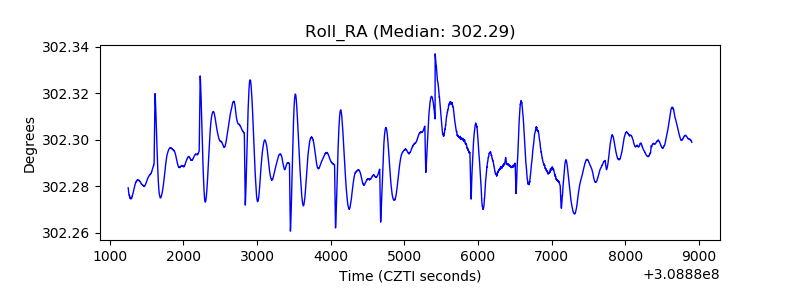 |
| Veto Counter | 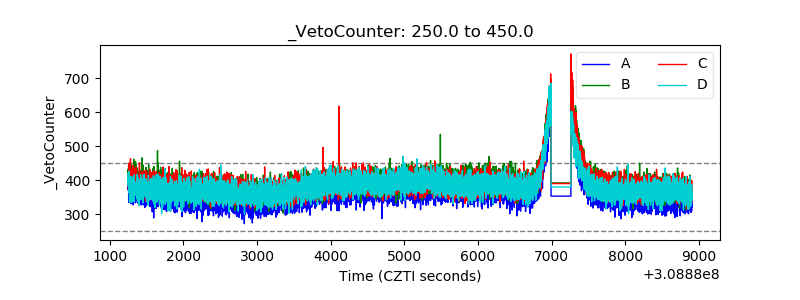 |