| Param | Original file | Final file |
|---|---|---|
| Filename | modeM0/AS1A07_041T01_9000003234_21891cztM0_level2.evt | modeM0/AS1A07_041T01_9000003234_21891cztM0_level2_quad_clean.evt |
| Size (bytes) | 463,890,240 | 75,677,760 |
| Size | 442.4 MB | 72.2 MB |
| Events in quadrant A | 3,240,502 | 452,351 |
| Events in quadrant B | 3,437,739 | 463,775 |
| Events in quadrant C | 3,232,111 | 453,206 |
| Events in quadrant D | 3,666,026 | 437,999 |
| Mode SS | |||
|---|---|---|---|
| Quadrant | BADHDUFLAG | Total packets | Discarded packets |
| A | 0 | 142 | 0 |
| B | 0 | 142 | 0 |
| C | 0 | 142 | 0 |
| D | 0 | 142 | 0 |
| Mode M9 | |||
|---|---|---|---|
| Quadrant | BADHDUFLAG | Total packets | Discarded packets |
| A | 0 | 3 | 0 |
| B | 0 | 3 | 0 |
| C | 0 | 3 | 0 |
| D | 0 | 3 | 0 |
| Mode M0 | |||
|---|---|---|---|
| Quadrant | BADHDUFLAG | Total packets | Discarded packets |
| A | 0 | 14432 | 1 |
| B | 0 | 14786 | 1 |
| C | 0 | 14260 | 1 |
| D | 0 | 15808 | 1 |
| Quadrant | Total seconds | Saturated seconds | Saturation percentage |
|---|---|---|---|
| A | 6946 | 123 | 1.770803% |
| B | 6947 | 125 | 1.799338% |
| C | 6947 | 145 | 2.087232% |
| D | 6947 | 174 | 2.504678% |
Noise dominated data is calculated using 1-second bins in cleaned event files. If a bin has >2000 counts, and if more than 50% of those come from <1% of pixels, then it is considered to be noise-dominated and hence unusable.
| Quadrant | # 1 sec bins | Bins with >0 counts | Bins with >2000 counts | High rate bins dominated by noise | Noise dominated (total time) | Noise dominated (detector-on time) | Marked lightcurve |
|---|---|---|---|---|---|---|---|
| A | 7226 | 6946 | 15 | 15 | 0.21% | 0.22% |  |
| B | 7227 | 6947 | 2 | 2 | 0.03% | 0.03% | 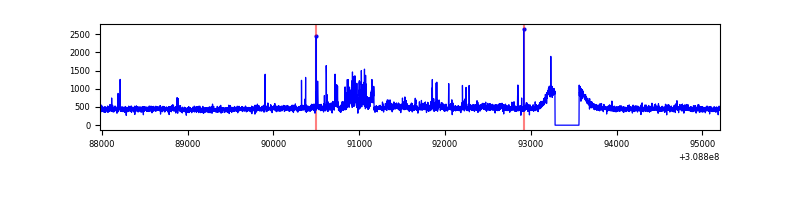 |
| C | 7227 | 6947 | 0 | 0 | 0.00% | 0.00% | 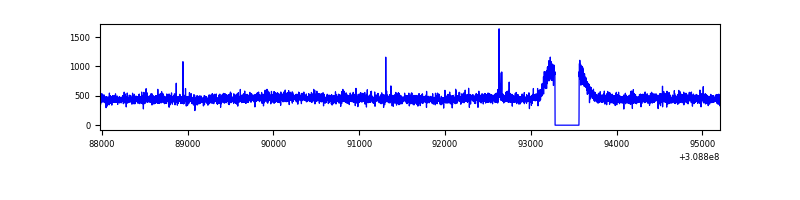 |
| D | 7227 | 6947 | 79 | 79 | 1.09% | 1.14% | 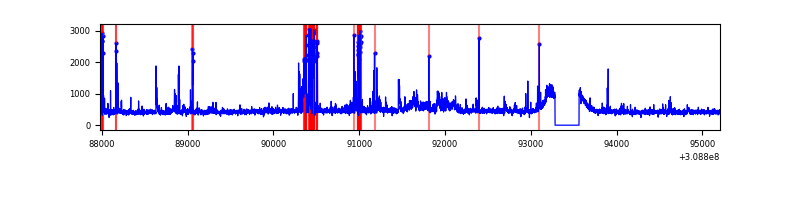 |
Top three noisy pixels from each quadrant. If the there are fewer than three noisy pixels in the level2.evt file, extra rows are filled as -1
| Pixel properties | Quadrant properties | ||||||
|---|---|---|---|---|---|---|---|
| Quadrant | DetID | PixID | Counts | Sigma | Mean | Median | Sigma |
| A | 5 | 16 | 65161 | 383.09 | 819 | 799 | 168.0 |
| A | 4 | 2 | 12938 | 72.25 | 819 | 799 | 168.0 |
| A | 13 | 254 | 12371 | 68.88 | 819 | 799 | 168.0 |
| B | 0 | 197 | 114792 | 716.03 | 821 | 799 | 159.2 |
| B | 0 | 190 | 29595 | 180.88 | 821 | 799 | 159.2 |
| B | 0 | 230 | 25252 | 153.6 | 821 | 799 | 159.2 |
| C | 14 | 238 | 122275 | 651.4 | 790 | 795 | 186.5 |
| C | 8 | 128 | 10586 | 52.5 | 790 | 795 | 186.5 |
| C | 10 | 22 | 8778 | 42.81 | 790 | 795 | 186.5 |
| D | 1 | 52 | 350265 | 1810.76 | 794 | 768 | 193.0 |
| D | 2 | 136 | 126019 | 648.93 | 794 | 768 | 193.0 |
| D | 12 | 227 | 108267 | 556.96 | 794 | 768 | 193.0 |
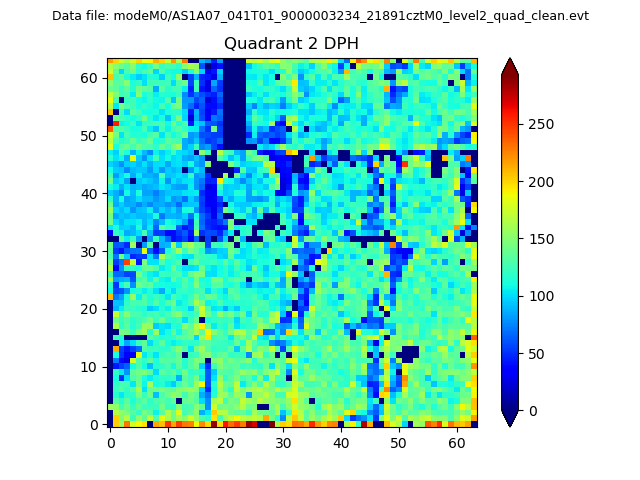
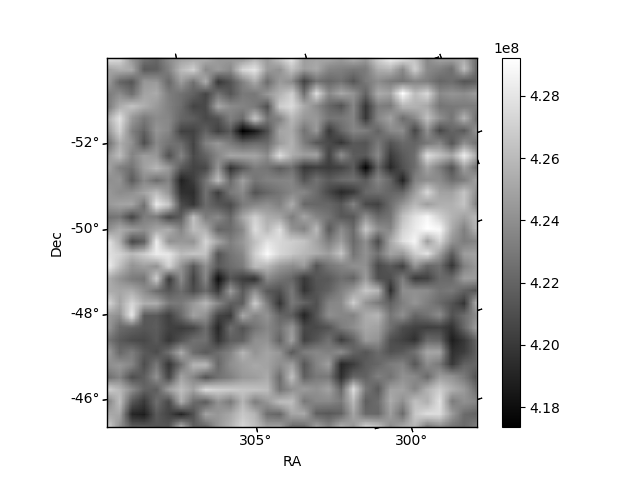
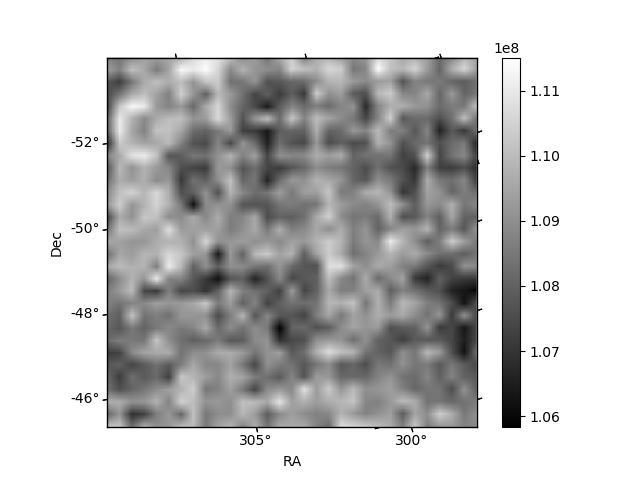
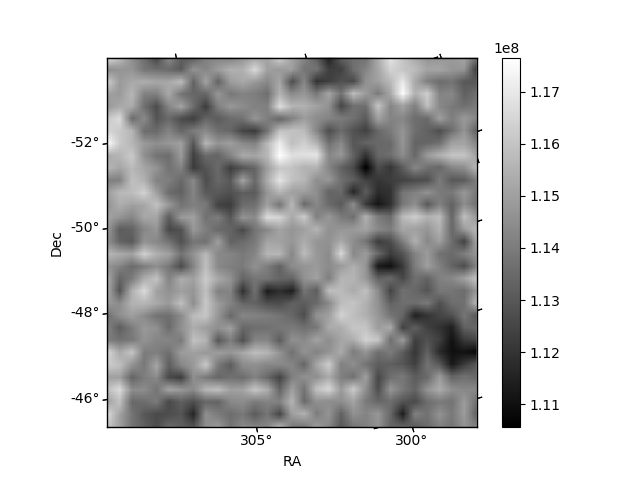
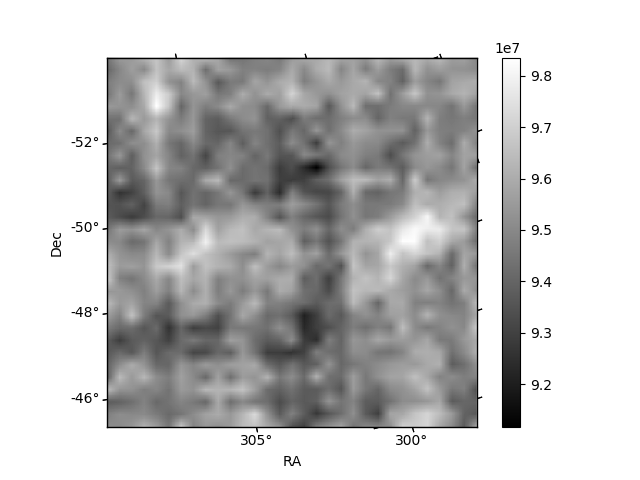
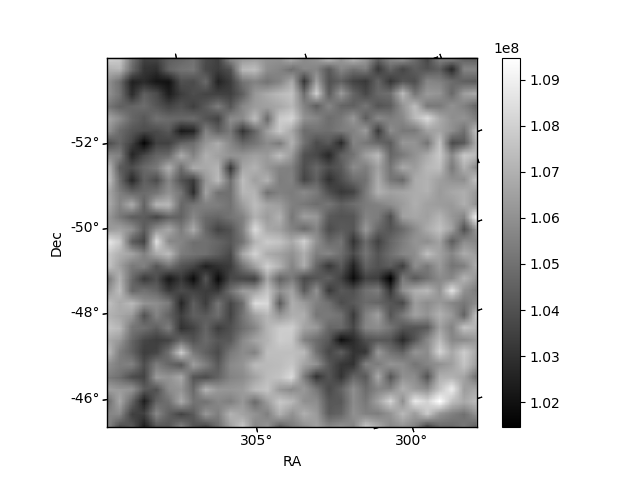
Histogram calculated using DETX and DETY for each event in the final _common_clean file
| Quadrant A |  |
 |
Quadrant B |
|---|---|---|---|
| Quadrant D |  |
 |
Quadrant C |
| Plot type | Count rate plots | Images |
|---|---|---|
| Comparison with Poisson distribution Blue bars denote a histogram of data divided into 1 sec bins. Red curve is a Poisson curve with rate = median count rate of data. |
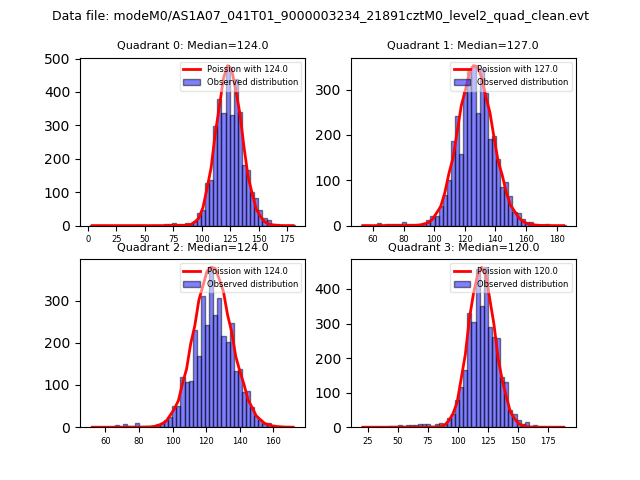 |
 |
| Quadrant-wise count rates Data is divided into 100 sec bins |
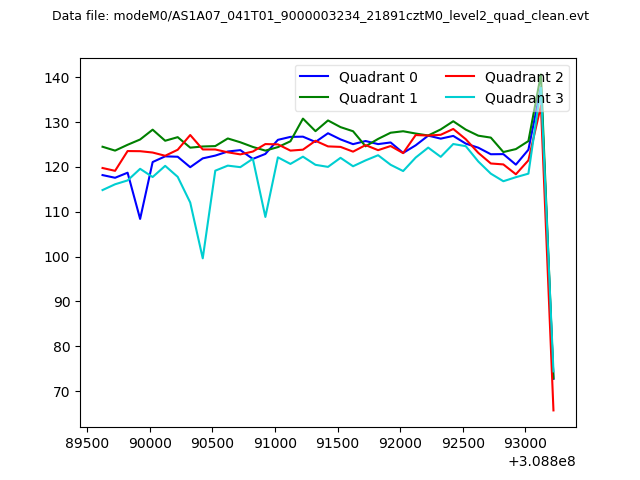 |
|
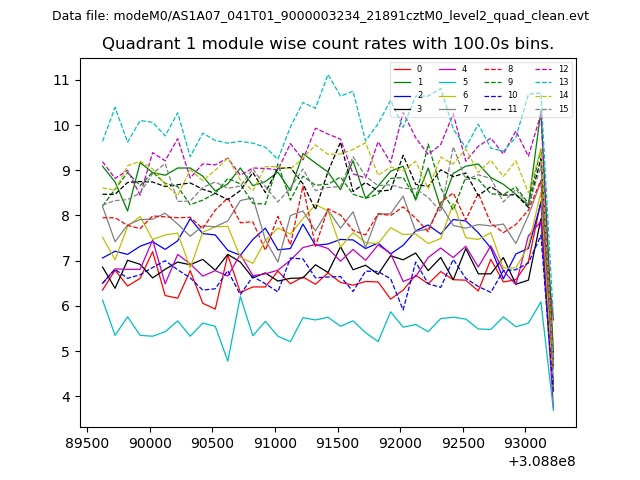
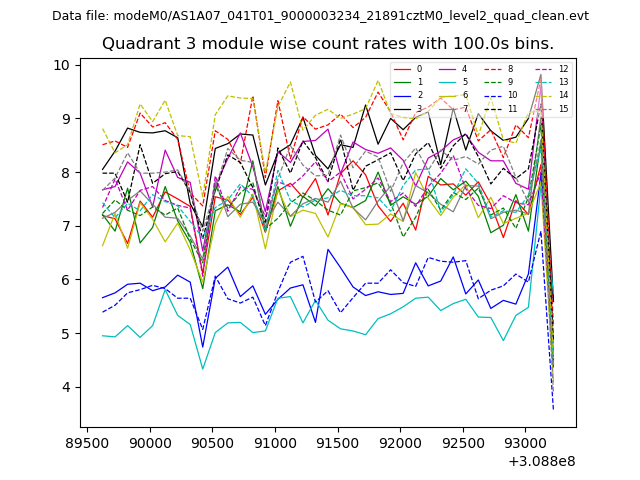
| Module-wise count rates for Quadrant A Data is divided into 100 sec bins |
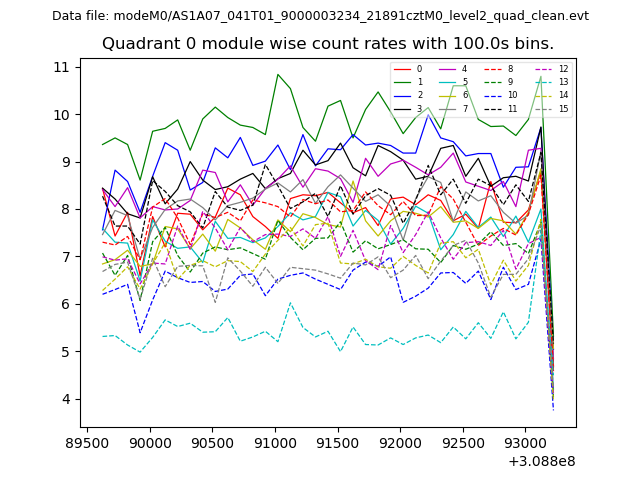 |
 |
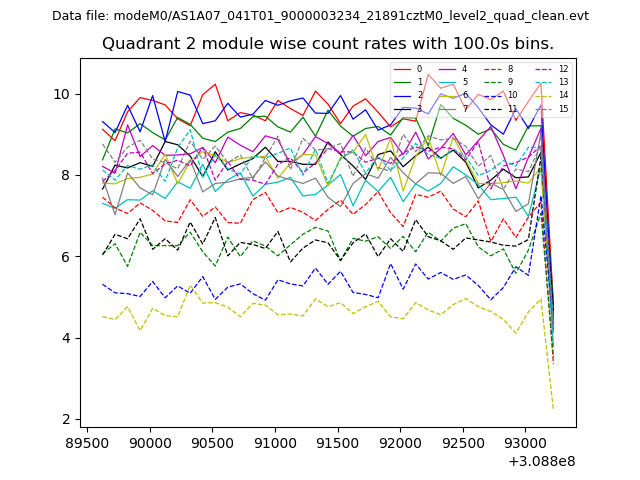
| Module-wise count rates for Quadrant B Data is divided into 100 sec bins |
 |
 |
| Module-wise count rates for Quadrant C Data is divided into 100 sec bins |
 |
 |
| Module-wise count rates for Quadrant D Data is divided into 100 sec bins |
 |
 |
| Parameter | Plot |
|---|---|
| CZT HV Monitor | 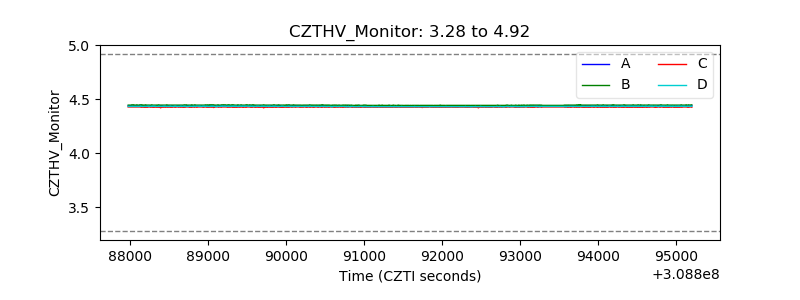 |
| D_VDD |  |
| Temperature 1 | 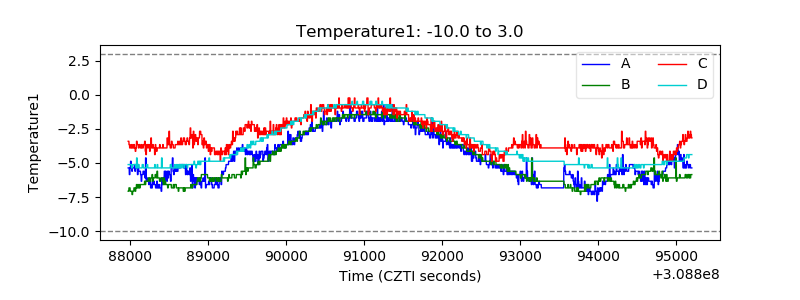 |
| Veto HV Monitor | 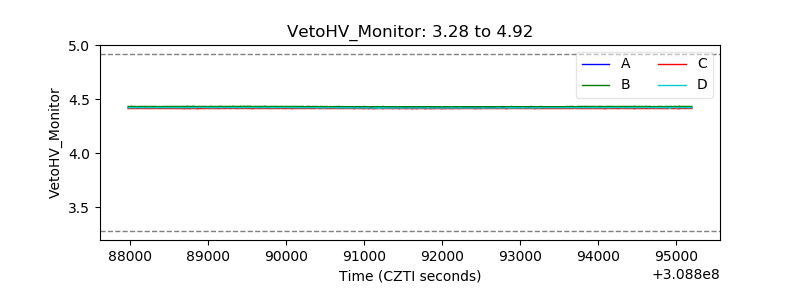 |
| Veto LLD | 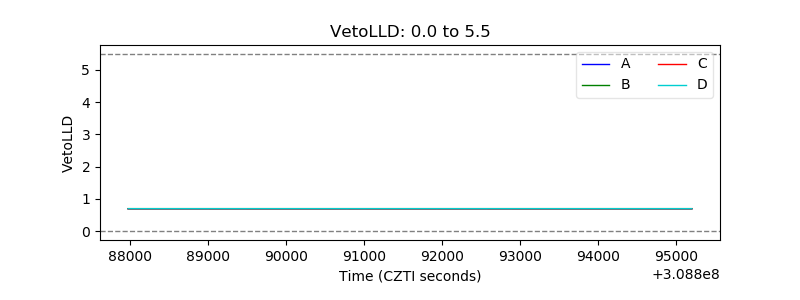 |
| Alpha Counter | 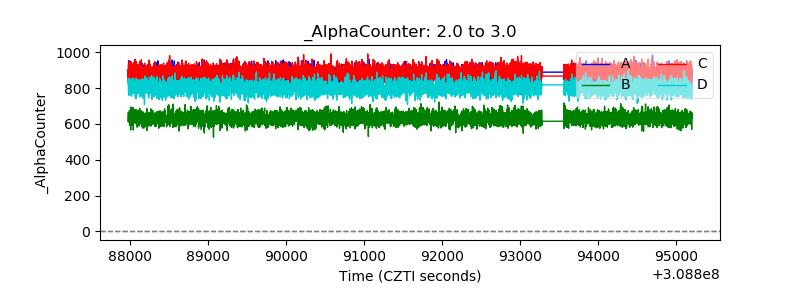 |
| _CPM_Rate | 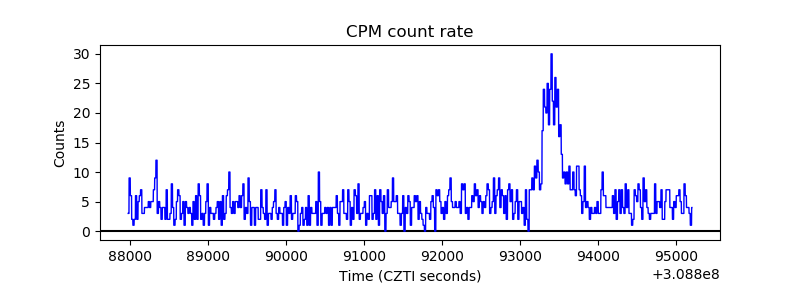 |
| CZT Counter | 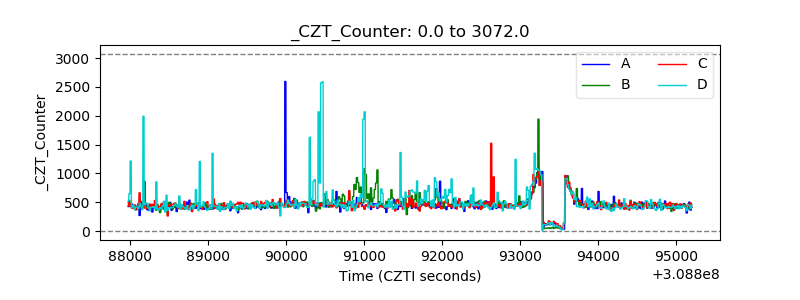 |
| +2.5 Volts monitor |  |
| +5 Volts monitor | 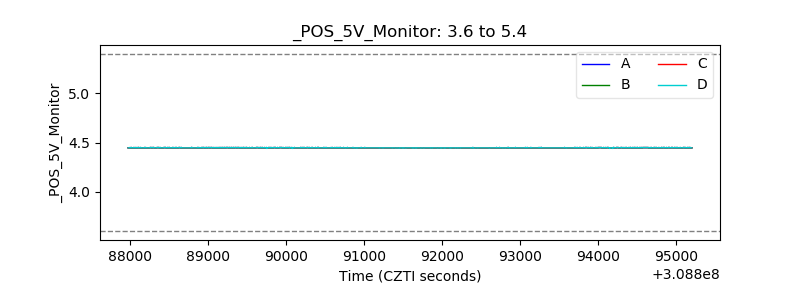 |
| _ROLL_ROT | 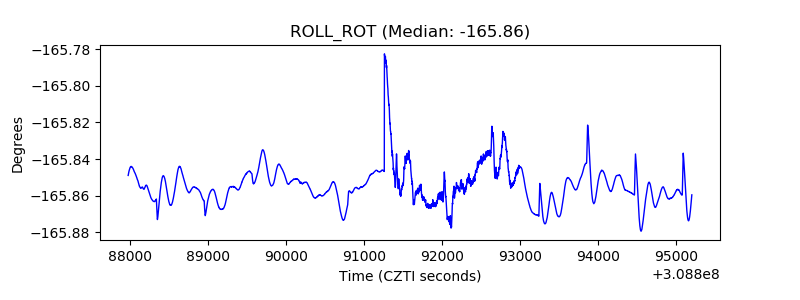 |
| _Roll_DEC | 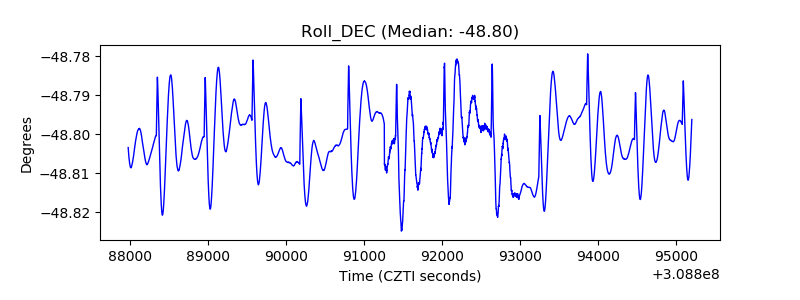 |
| _Roll_RA | 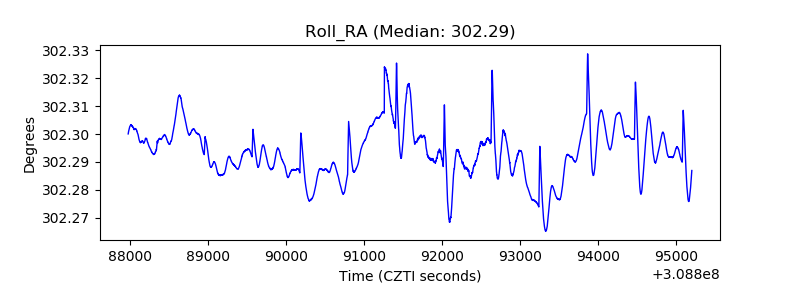 |
| Veto Counter | 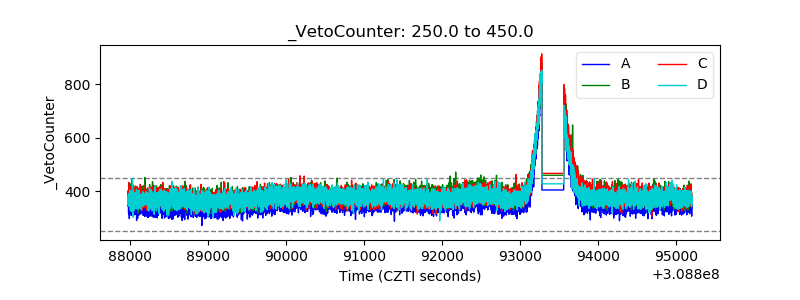 |