| Param | Original file | Final file |
|---|---|---|
| Filename | modeM0/AS1A07_041T01_9000003234_21895cztM0_level2.evt | modeM0/AS1A07_041T01_9000003234_21895cztM0_level2_quad_clean.evt |
| Size (bytes) | 886,435,200 | 162,878,400 |
| Size | 845.4 MB | 155.3 MB |
| Events in quadrant A | 6,067,149 | 1,017,491 |
| Events in quadrant B | 6,432,988 | 1,033,839 |
| Events in quadrant C | 6,336,178 | 1,013,406 |
| Events in quadrant D | 7,138,493 | 979,412 |
| Mode SS | |||
|---|---|---|---|
| Quadrant | BADHDUFLAG | Total packets | Discarded packets |
| A | 0 | 262 | 0 |
| B | 0 | 262 | 0 |
| C | 0 | 262 | 0 |
| D | 0 | 262 | 0 |
| Mode M9 | |||
|---|---|---|---|
| Quadrant | BADHDUFLAG | Total packets | Discarded packets |
| A | 0 | 15 | 0 |
| B | 0 | 15 | 0 |
| C | 0 | 15 | 0 |
| D | 0 | 15 | 0 |
| Mode M0 | |||
|---|---|---|---|
| Quadrant | BADHDUFLAG | Total packets | Discarded packets |
| A | 0 | 26604 | 3 |
| B | 0 | 27339 | 3 |
| C | 0 | 27352 | 3 |
| D | 0 | 30106 | 3 |
| Quadrant | Total seconds | Saturated seconds | Saturation percentage |
|---|---|---|---|
| A | 12861 | 207 | 1.609517% |
| B | 12861 | 278 | 2.161574% |
| C | 12862 | 447 | 3.475354% |
| D | 12862 | 395 | 3.071062% |
Noise dominated data is calculated using 1-second bins in cleaned event files. If a bin has >2000 counts, and if more than 50% of those come from <1% of pixels, then it is considered to be noise-dominated and hence unusable.
| Quadrant | # 1 sec bins | Bins with >0 counts | Bins with >2000 counts | High rate bins dominated by noise | Noise dominated (total time) | Noise dominated (detector-on time) | Marked lightcurve |
|---|---|---|---|---|---|---|---|
| A | 14326 | 12861 | 4 | 4 | 0.03% | 0.03% | 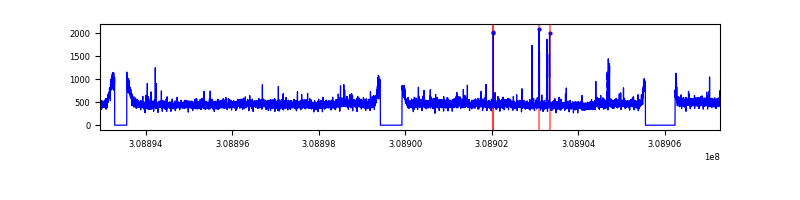 |
| B | 14326 | 12861 | 37 | 37 | 0.26% | 0.29% | 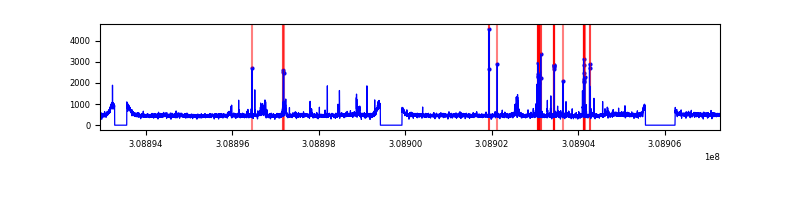 |
| C | 14327 | 12862 | 91 | 91 | 0.64% | 0.71% | 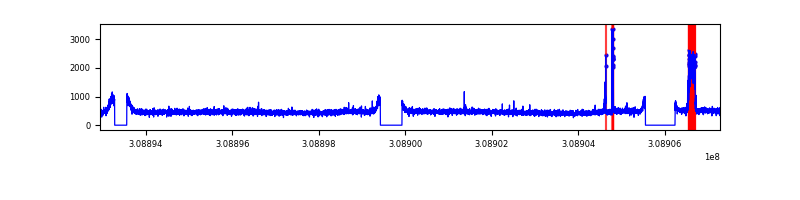 |
| D | 14327 | 12862 | 210 | 210 | 1.47% | 1.63% | 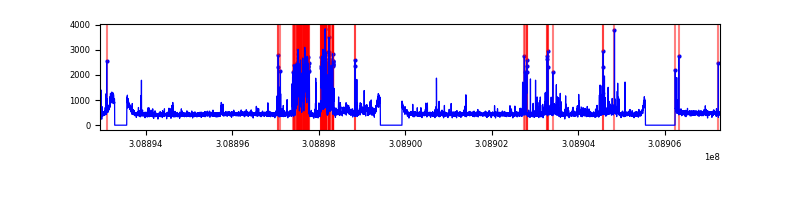 |
Top three noisy pixels from each quadrant. If the there are fewer than three noisy pixels in the level2.evt file, extra rows are filled as -1
| Pixel properties | Quadrant properties | ||||||
|---|---|---|---|---|---|---|---|
| Quadrant | DetID | PixID | Counts | Sigma | Mean | Median | Sigma |
| A | 5 | 16 | 63812 | 200.77 | 1540 | 1504 | 310.3 |
| A | 6 | 16 | 32776 | 100.77 | 1540 | 1504 | 310.3 |
| A | 4 | 2 | 27127 | 82.56 | 1540 | 1504 | 310.3 |
| B | 0 | 197 | 120870 | 404.62 | 1537 | 1497 | 295.0 |
| B | 0 | 190 | 118104 | 395.25 | 1537 | 1497 | 295.0 |
| B | 3 | 64 | 83222 | 277.01 | 1537 | 1497 | 295.0 |
| C | 10 | 22 | 334045 | 952.13 | 1480 | 1488 | 349.3 |
| C | 14 | 238 | 231554 | 658.69 | 1480 | 1488 | 349.3 |
| C | 13 | 61 | 10377 | 25.45 | 1480 | 1488 | 349.3 |
| D | 7 | 238 | 940372 | 2379.24 | 1481 | 1445 | 394.6 |
| D | 2 | 136 | 327397 | 825.96 | 1481 | 1445 | 394.6 |
| D | 1 | 52 | 138312 | 346.82 | 1481 | 1445 | 394.6 |
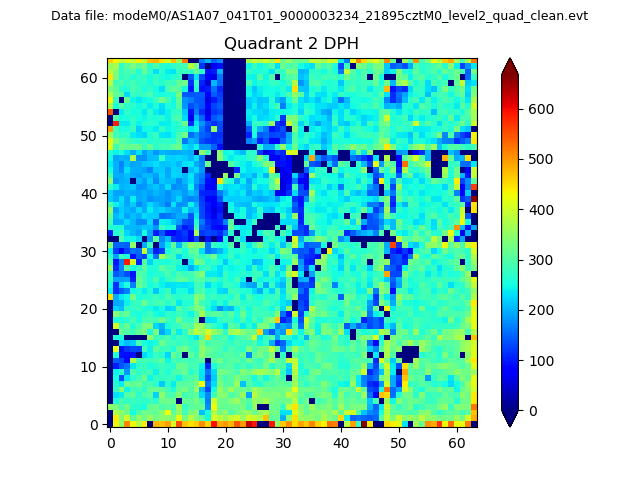
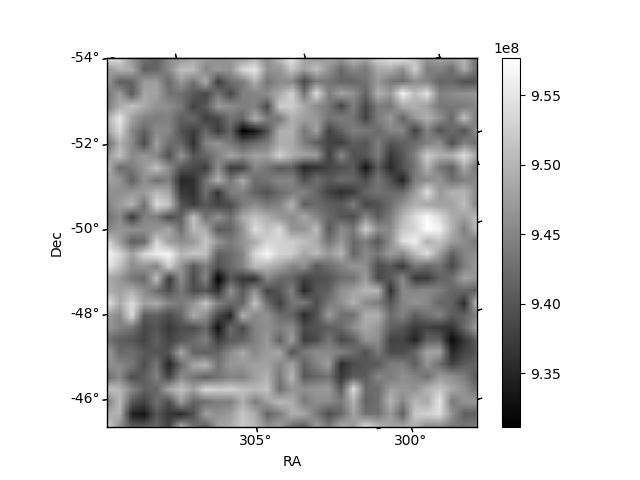
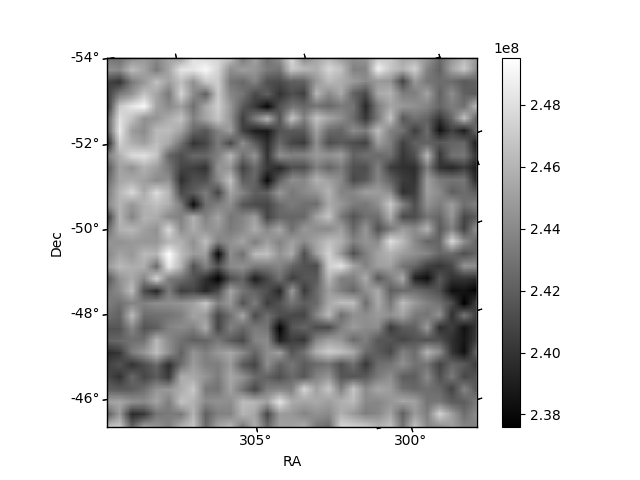
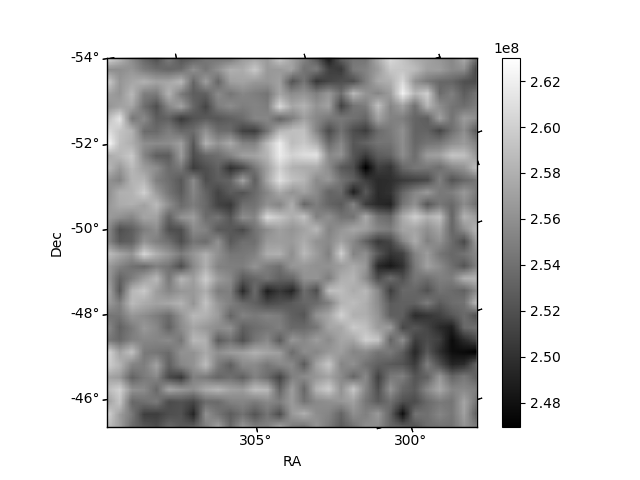
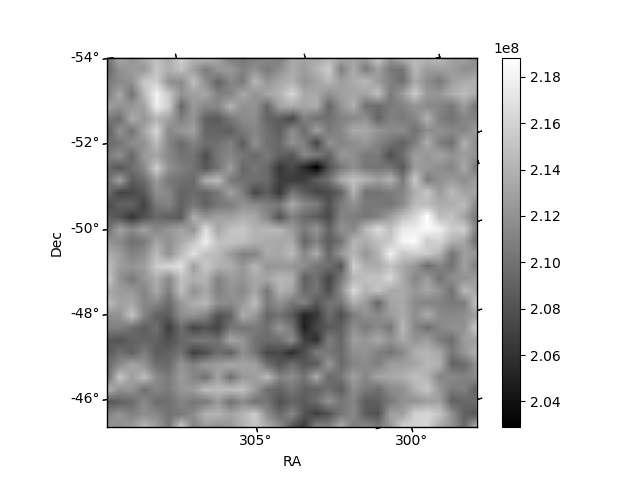
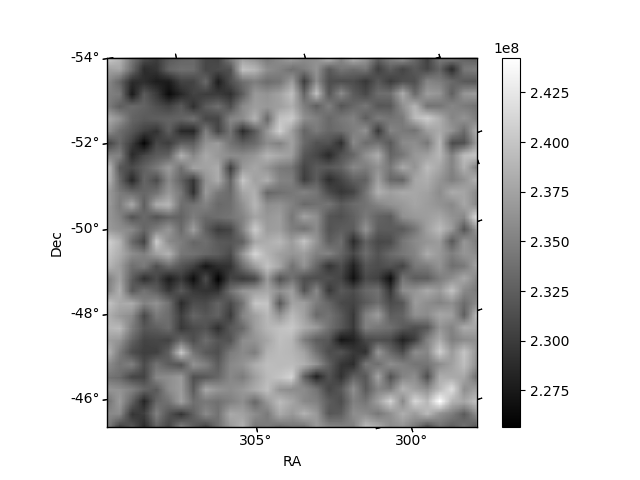
Histogram calculated using DETX and DETY for each event in the final _common_clean file
| Quadrant A | 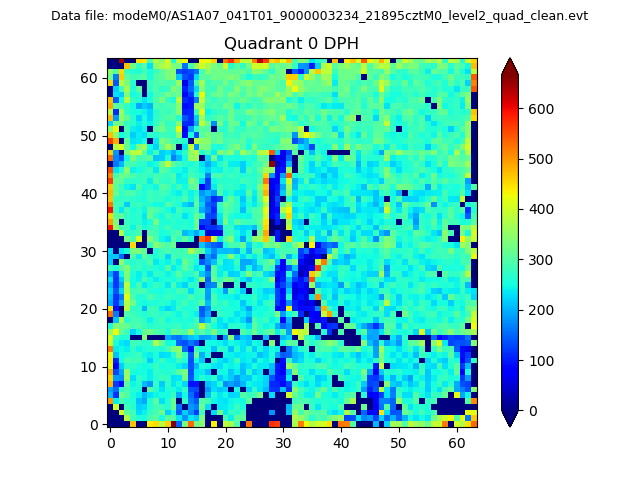 |
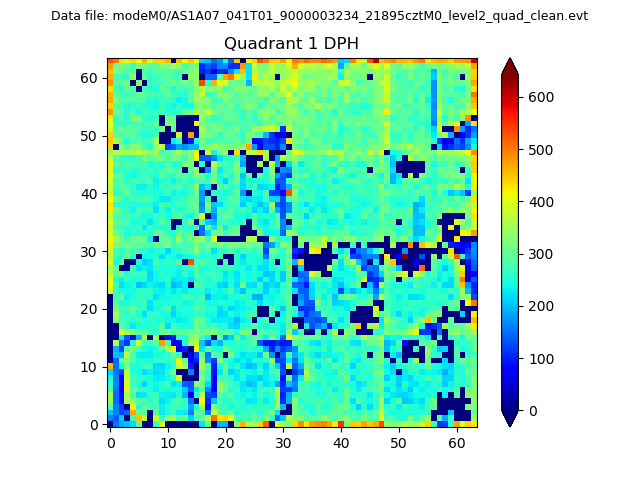 |
Quadrant B |
|---|---|---|---|
| Quadrant D | 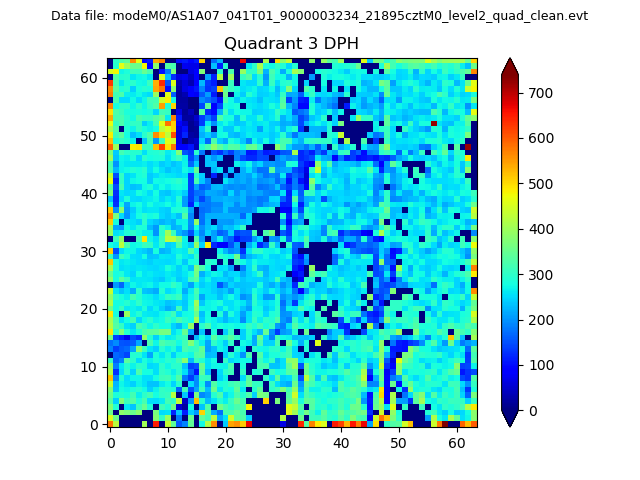 |
 |
Quadrant C |
| Plot type | Count rate plots | Images |
|---|---|---|
| Comparison with Poisson distribution Blue bars denote a histogram of data divided into 1 sec bins. Red curve is a Poisson curve with rate = median count rate of data. |
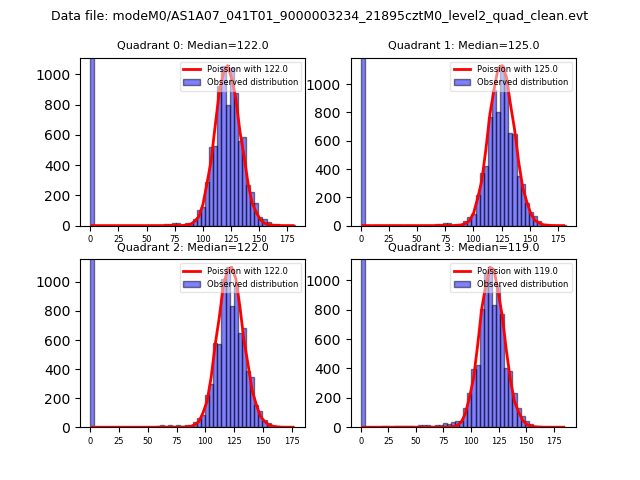 |
 |
| Quadrant-wise count rates Data is divided into 100 sec bins |
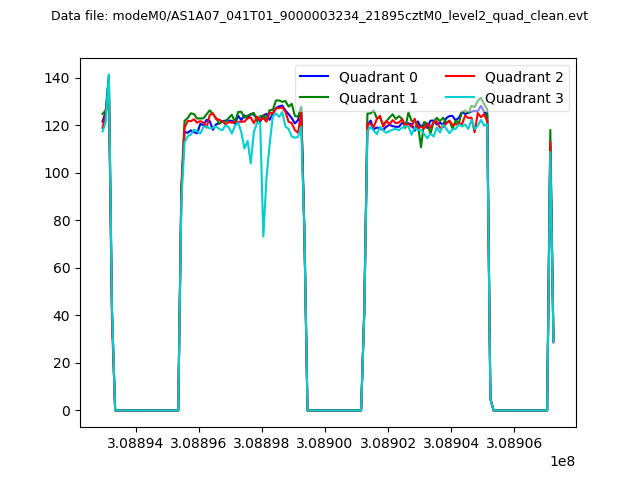 |
|
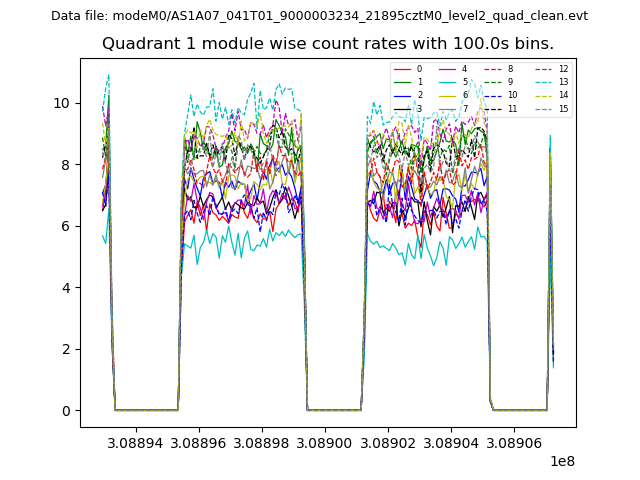
| Module-wise count rates for Quadrant A Data is divided into 100 sec bins |
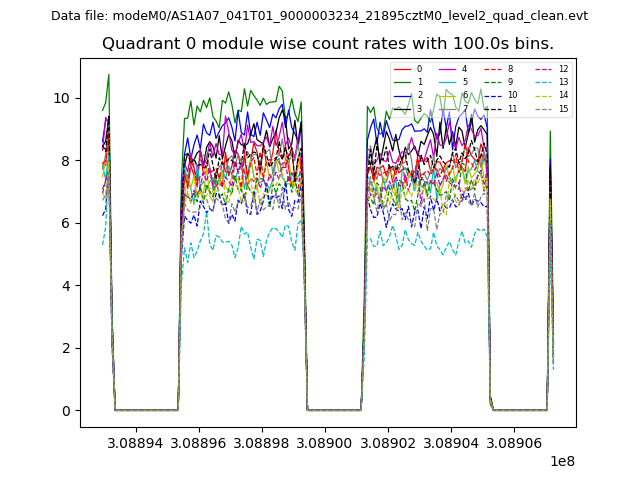 |
 |
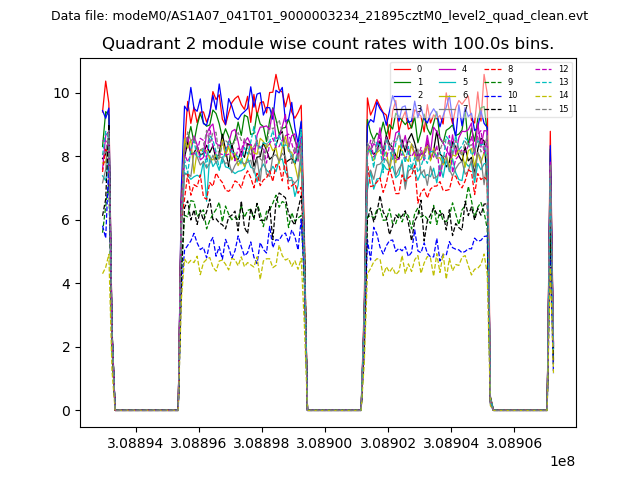
| Module-wise count rates for Quadrant B Data is divided into 100 sec bins |
 |
 |
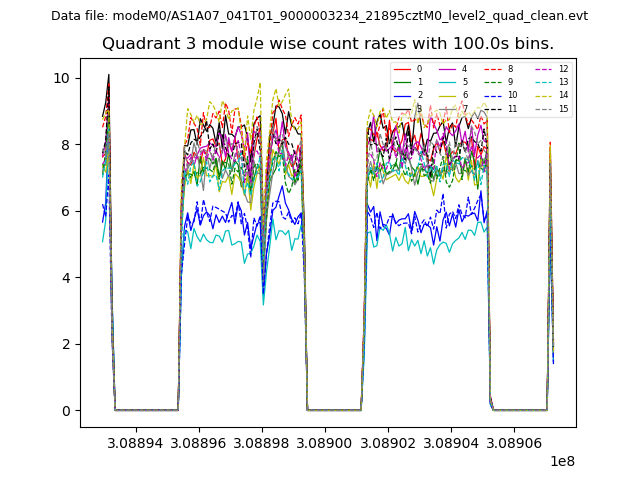
| Module-wise count rates for Quadrant C Data is divided into 100 sec bins |
 |
 |
| Module-wise count rates for Quadrant D Data is divided into 100 sec bins |
 |
 |
| Parameter | Plot |
|---|---|
| CZT HV Monitor | 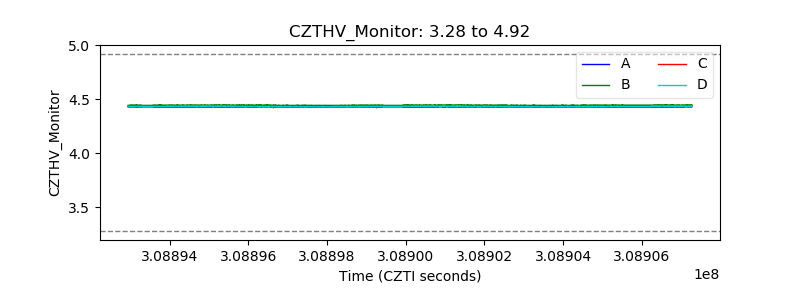 |
| D_VDD | 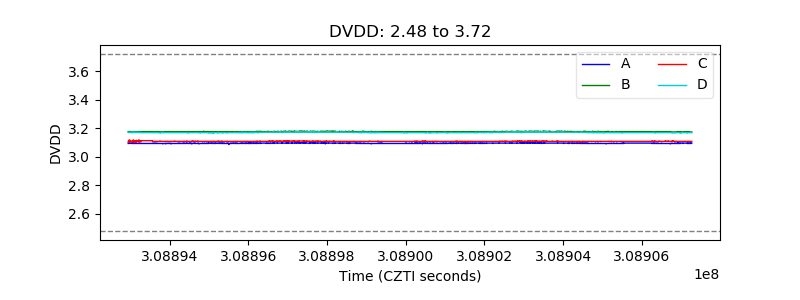 |
| Temperature 1 | 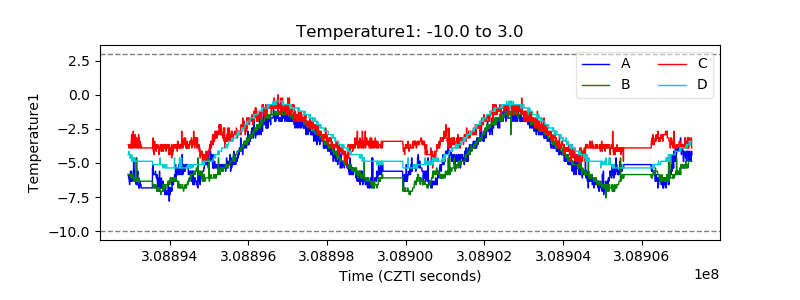 |
| Veto HV Monitor | 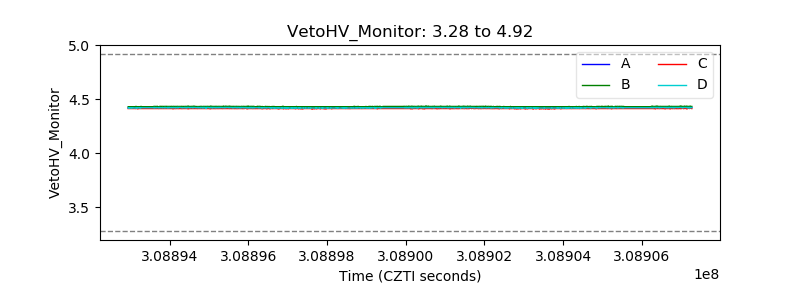 |
| Veto LLD |  |
| Alpha Counter | 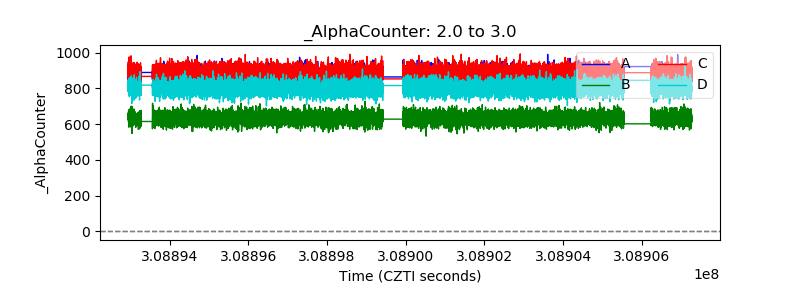 |
| _CPM_Rate | 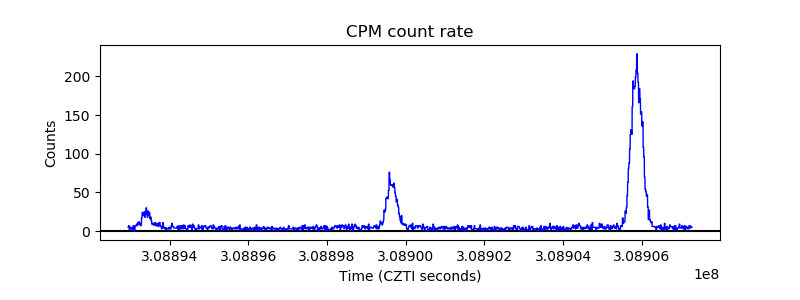 |
| CZT Counter | 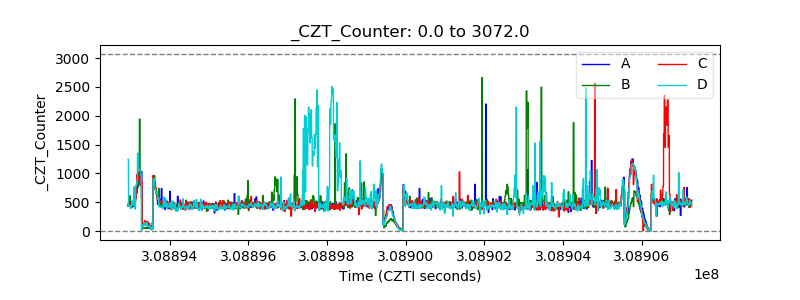 |
| +2.5 Volts monitor |  |
| +5 Volts monitor |  |
| _ROLL_ROT | 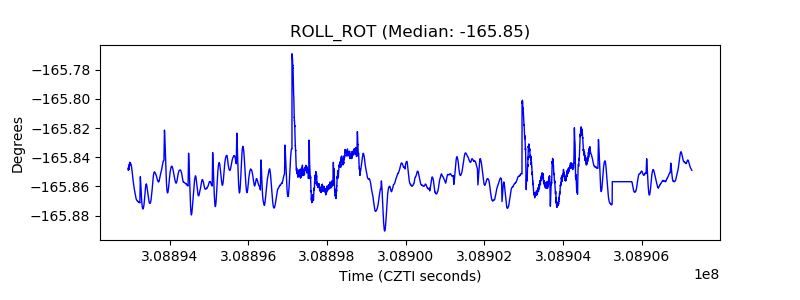 |
| _Roll_DEC | 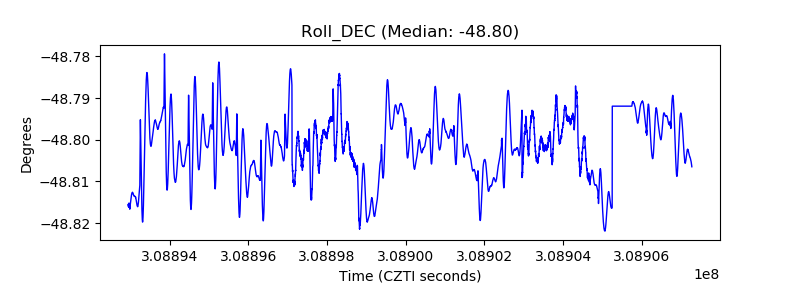 |
| _Roll_RA | 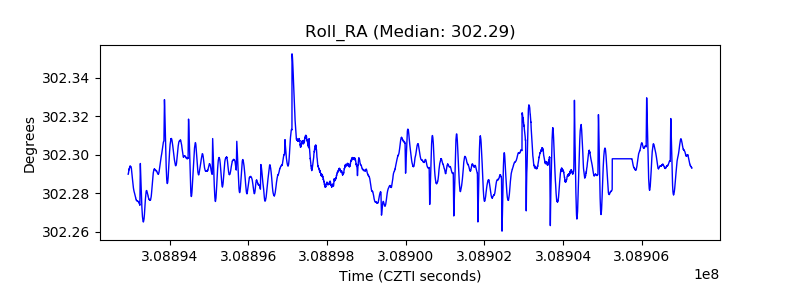 |
| Veto Counter | 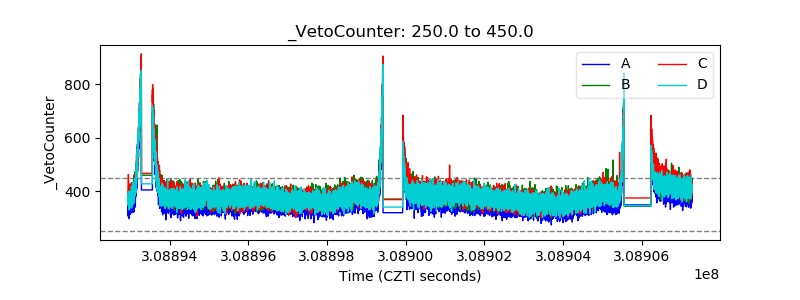 |