| Param | Original file | Final file |
|---|---|---|
| Filename | modeM0/AS1A07_010T05_9000003236cztM0_level2.fits | modeM0/AS1A07_010T05_9000003236cztM0_level2_quad_clean.evt |
| Size (bytes) | 220,636,800 | 199,575,360 |
| Size | 210.4 MB | 190.3 MB |
| Events in quadrant A | 1,388,864 | 1,191,467 |
| Events in quadrant B | 1,317,062 | 1,188,905 |
| Events in quadrant C | 1,304,210 | 1,111,687 |
| Events in quadrant D | 1,159,702 | 1,039,482 |
| Mode M0 | |||
|---|---|---|---|
| Quadrant | BADHDUFLAG | Total packets | Discarded packets |
| A | 0 | 46373 | 0 |
| B | 0 | 47594 | 0 |
| C | 0 | 50828 | 0 |
| D | 0 | 53570 | 0 |
| Mode SS | |||
|---|---|---|---|
| Quadrant | BADHDUFLAG | Total packets | Discarded packets |
| A | 0 | 448 | 0 |
| B | 0 | 448 | 0 |
| C | 0 | 446 | 0 |
| D | 0 | 450 | 0 |
| Mode M9 | |||
|---|---|---|---|
| Quadrant | BADHDUFLAG | Total packets | Discarded packets |
| A | 0 | 42 | 0 |
| B | 0 | 42 | 0 |
| C | 0 | 42 | 0 |
| D | 0 | 42 | 0 |
| Quadrant | Total seconds | Saturated seconds | Saturation percentage |
|---|---|---|---|
| A | 21972 | 235 | 1.069543% |
| B | 21972 | 306 | 1.392682% |
| C | 21962 | 927 | 4.220927% |
| D | 21947 | 473 | 2.155192% |
Noise dominated data is calculated using 1-second bins in cleaned event files. If a bin has >2000 counts, and if more than 50% of those come from <1% of pixels, then it is considered to be noise-dominated and hence unusable.
| Quadrant | # 1 sec bins | Bins with >0 counts | Bins with >2000 counts | High rate bins dominated by noise | Noise dominated (total time) | Noise dominated (detector-on time) | Marked lightcurve |
|---|---|---|---|---|---|---|---|
| A | 23633 | 20529 | 0 | 0 | 0.00% | 0.00% | 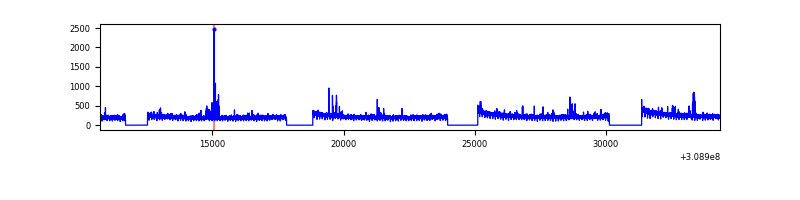 |
| B | 23633 | 20519 | 0 | 0 | 0.00% | 0.00% | 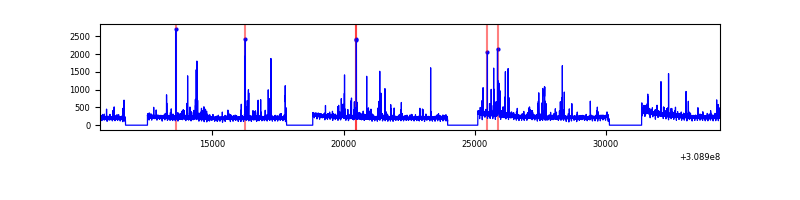 |
| C | 23633 | 20473 | 0 | 0 | 0.00% | 0.00% | 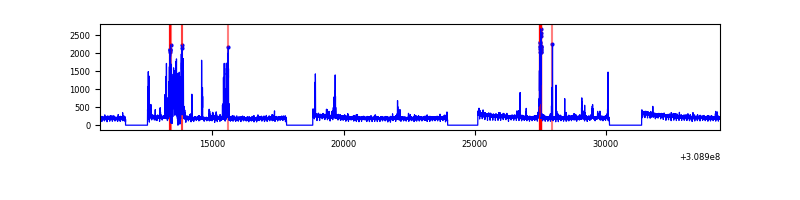 |
| D | 23633 | 20496 | 0 | 0 | 0.00% | 0.00% | 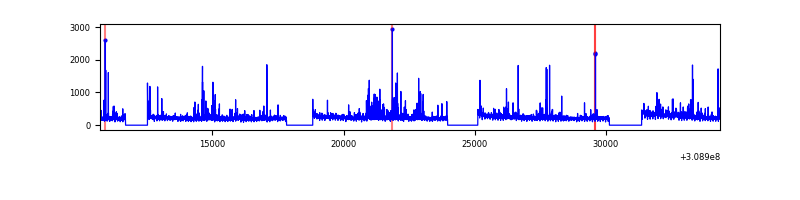 |
Top three noisy pixels from each quadrant. If the there are fewer than three noisy pixels in the level2.evt file, extra rows are filled as -1
| Pixel properties | Quadrant properties | ||||||
|---|---|---|---|---|---|---|---|
| Quadrant | DetID | PixID | Counts | Sigma | Mean | Median | Sigma |
| A | 0 | 29 | 1363 | 11.58 | 361 | 342 | 88.1 |
| A | 0 | 30 | 1059 | 8.13 | 361 | 342 | 88.1 |
| A | 7 | 110 | 1039 | 7.91 | 361 | 342 | 88.1 |
| B | 2 | 9 | 1060 | 10.41 | 349 | 335 | 69.7 |
| B | 2 | 8 | 892 | 8.0 | 349 | 335 | 69.7 |
| B | 5 | 128 | 884 | 7.88 | 349 | 335 | 69.7 |
| C | 1 | 81 | 1037 | 8.12 | 343 | 323 | 87.9 |
| C | 1 | 80 | 996 | 7.65 | 343 | 323 | 87.9 |
| C | 3 | 234 | 981 | 7.48 | 343 | 323 | 87.9 |
| D | 6 | 231 | 871 | 6.47 | 331 | 303 | 87.9 |
| D | 10 | 189 | 847 | 6.19 | 331 | 303 | 87.9 |
| D | 3 | 14 | 832 | 6.02 | 331 | 303 | 87.9 |
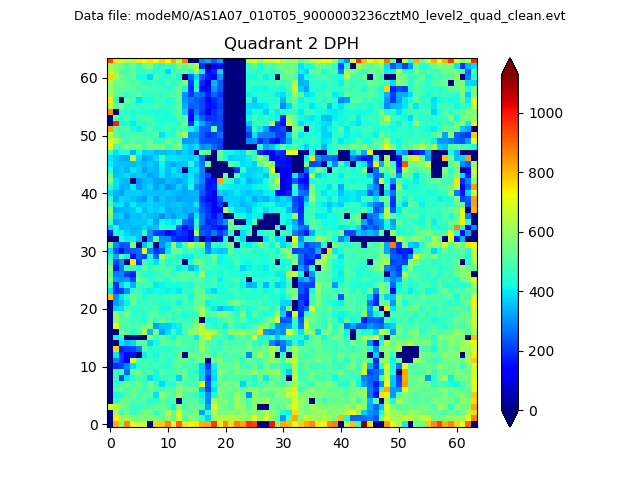
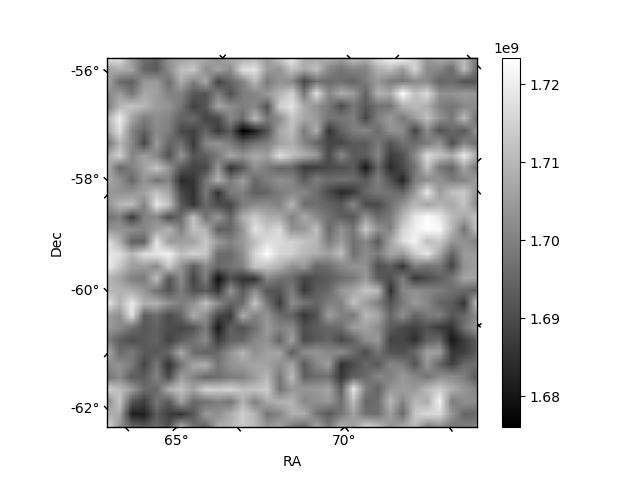
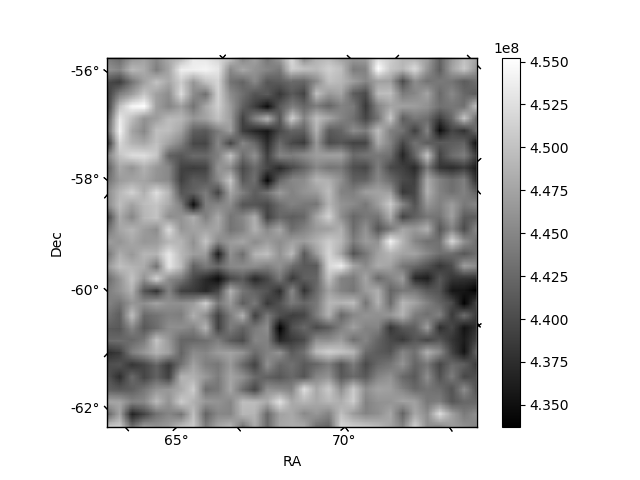
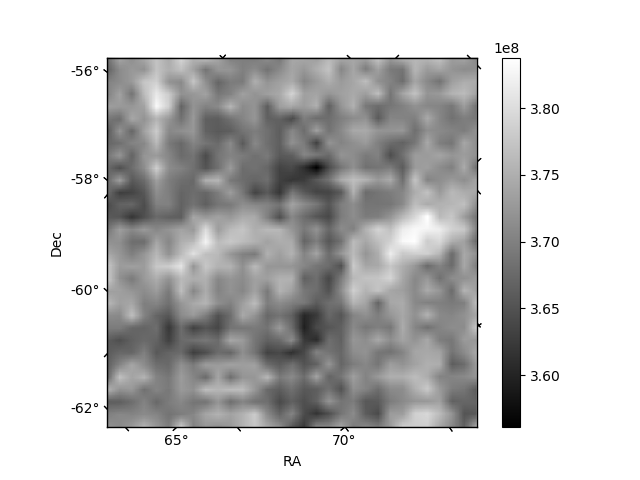
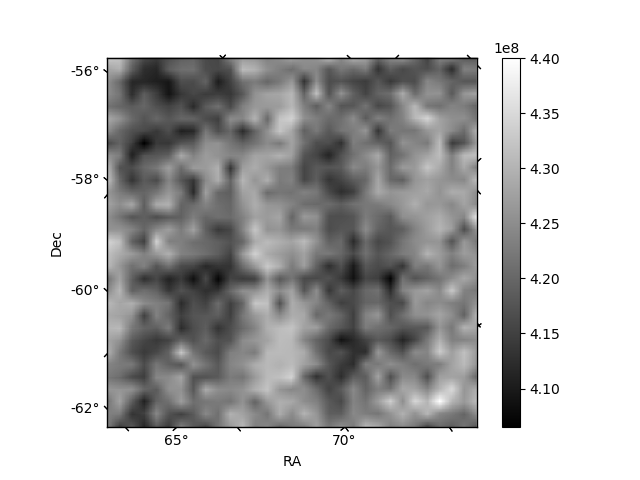
Histogram calculated using DETX and DETY for each event in the final _common_clean file
| Quadrant A | 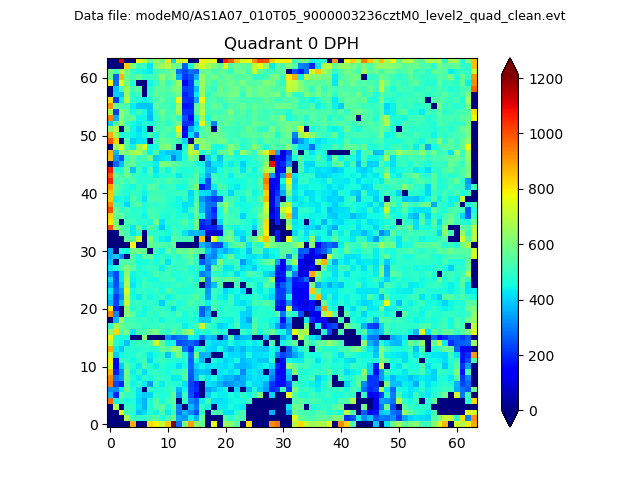 |
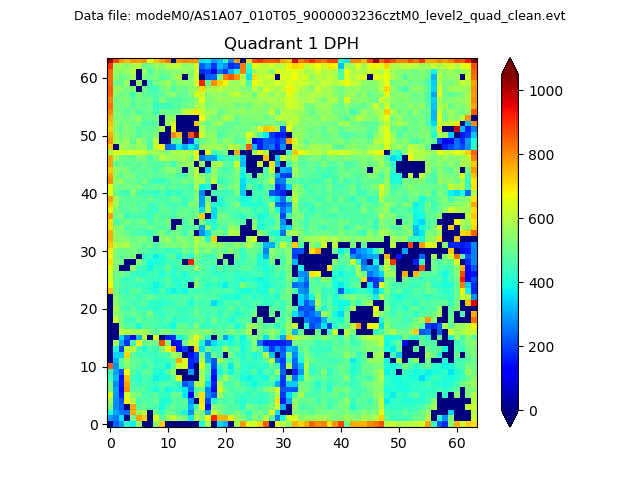 |
Quadrant B |
|---|---|---|---|
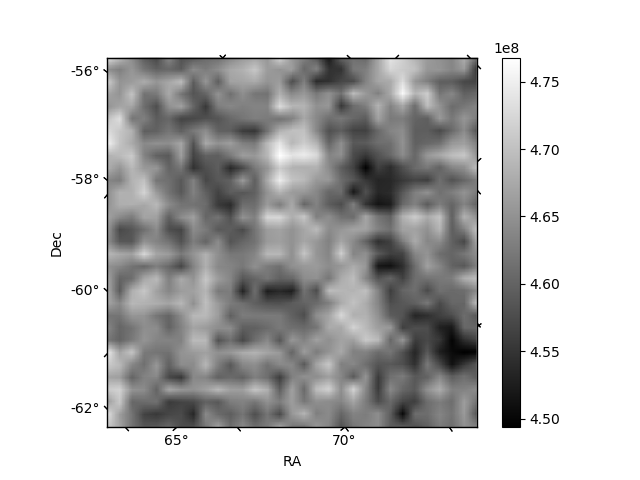
| Quadrant D | 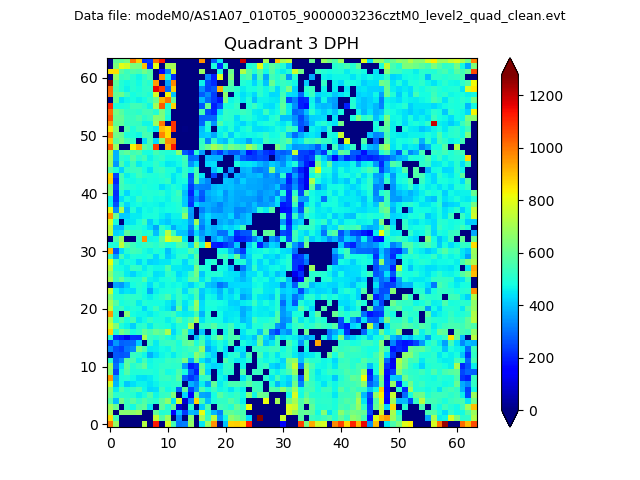 |
 |
Quadrant C |
| Plot type | Count rate plots | Images |
|---|---|---|
| Comparison with Poisson distribution Blue bars denote a histogram of data divided into 1 sec bins. Red curve is a Poisson curve with rate = median count rate of data. |
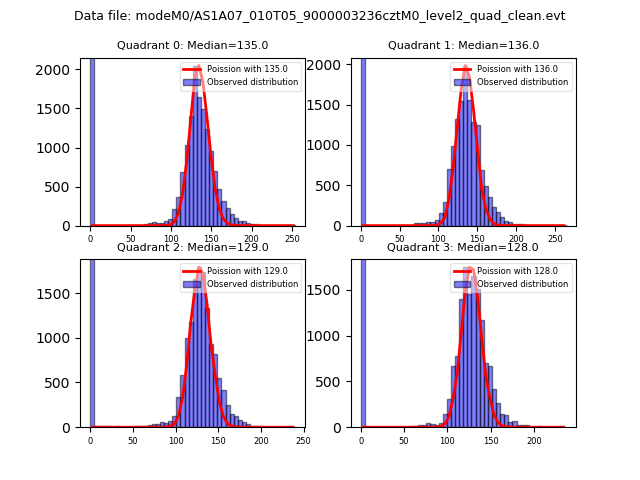 |
 |
| Quadrant-wise count rates Data is divided into 100 sec bins |
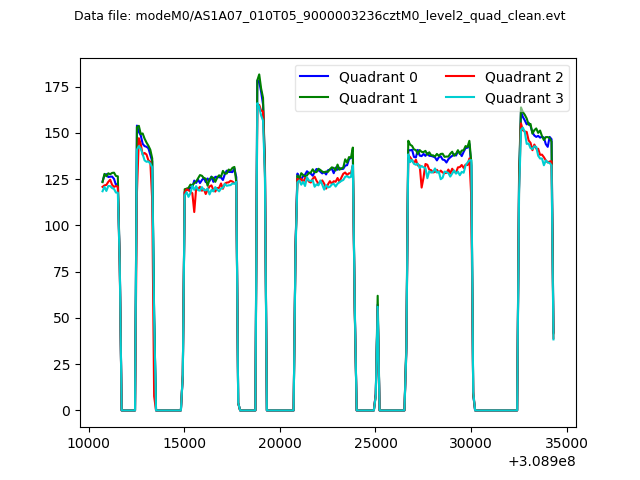 |
|
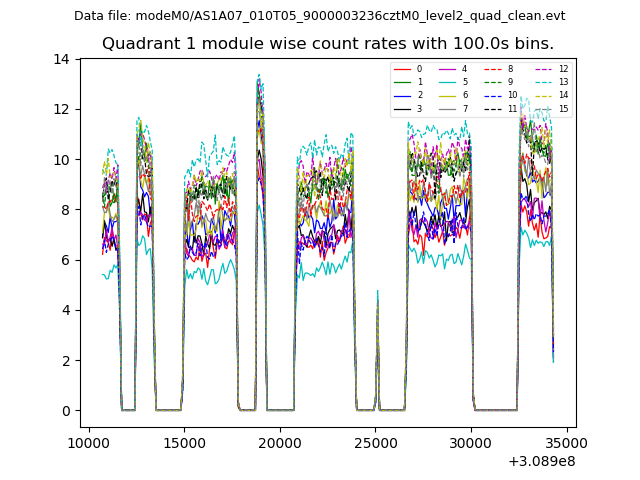
| Module-wise count rates for Quadrant A Data is divided into 100 sec bins |
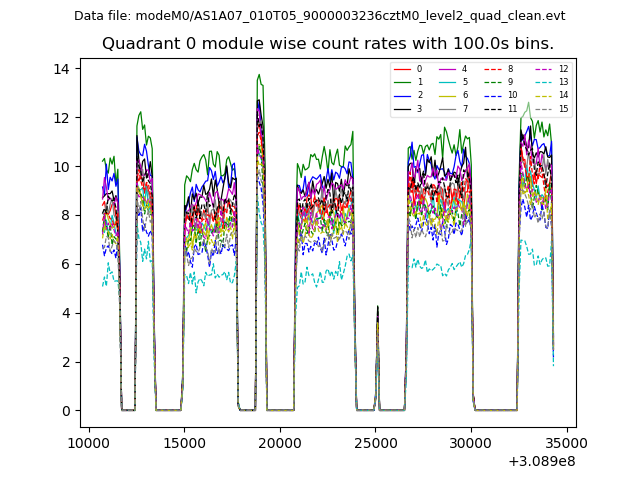 |
 |
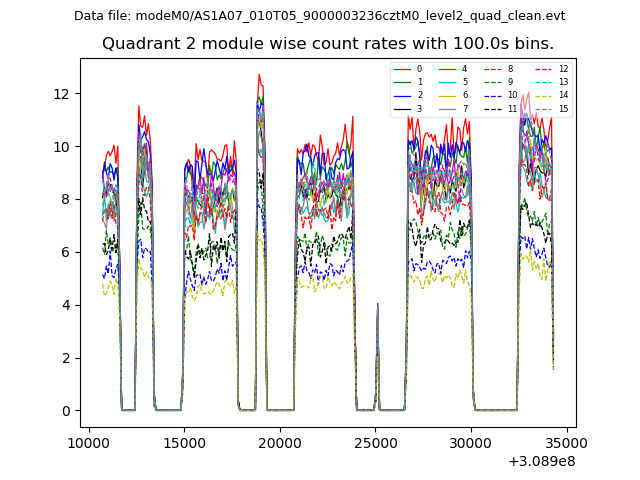
| Module-wise count rates for Quadrant B Data is divided into 100 sec bins |
 |
 |
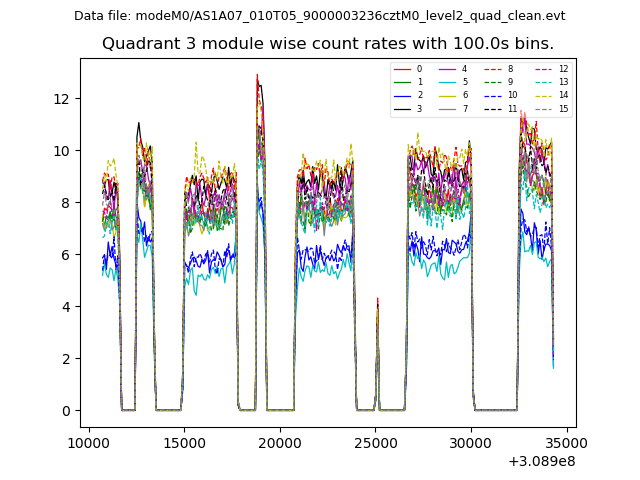
| Module-wise count rates for Quadrant C Data is divided into 100 sec bins |
 |
 |
| Module-wise count rates for Quadrant D Data is divided into 100 sec bins |
 |
 |
| Parameter | Plot |
|---|---|
| CZT HV Monitor | 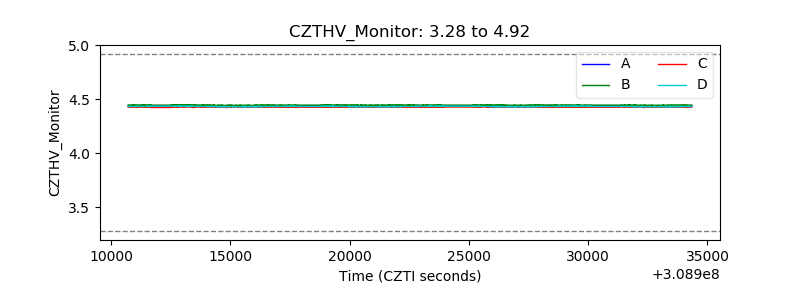 |
| D_VDD | 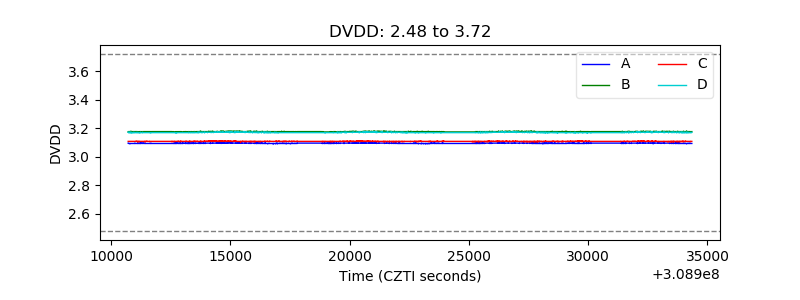 |
| Temperature 1 | 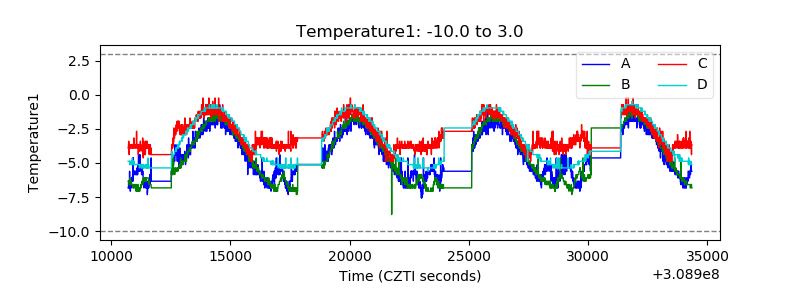 |
| Veto HV Monitor | 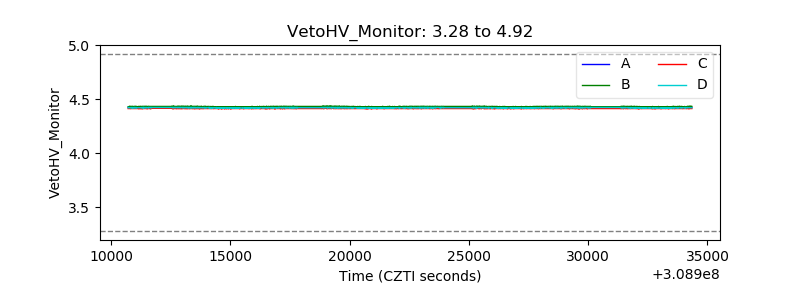 |
| Veto LLD | 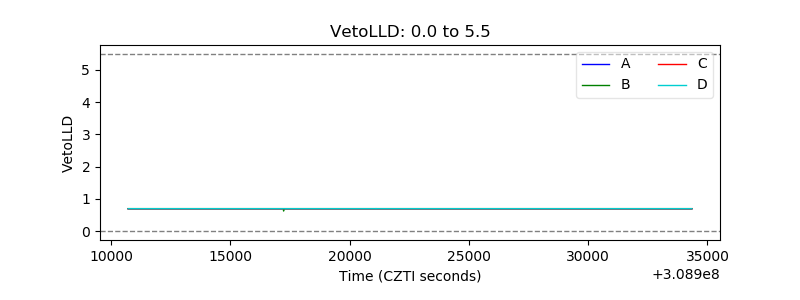 |
| Alpha Counter | 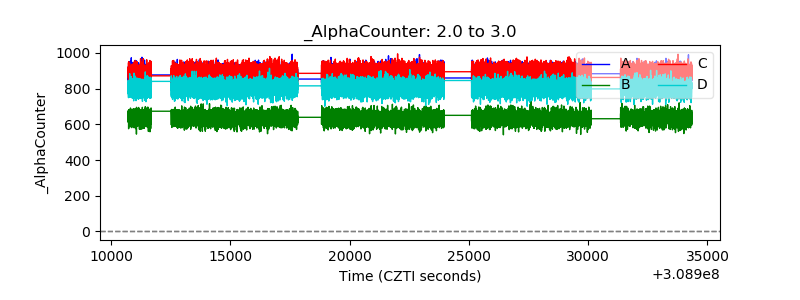 |
| _CPM_Rate | 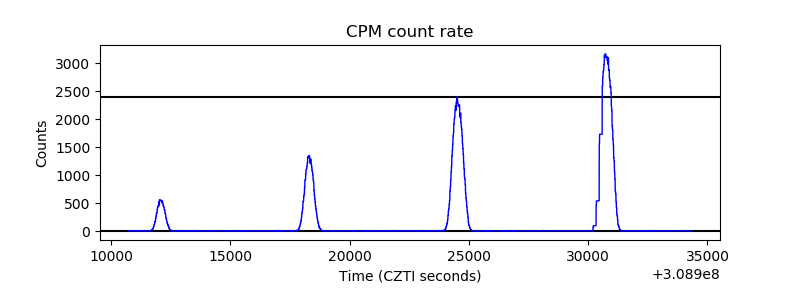 |
| CZT Counter | 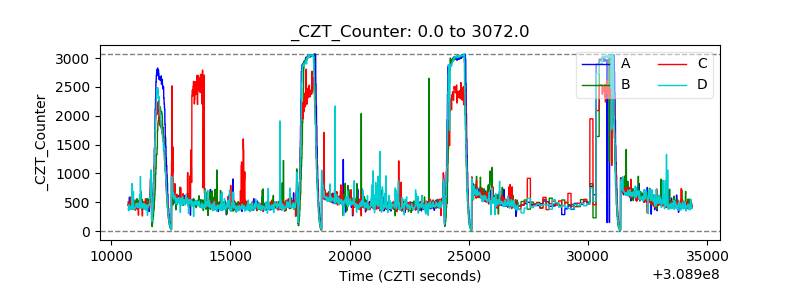 |
| +2.5 Volts monitor |  |
| +5 Volts monitor | 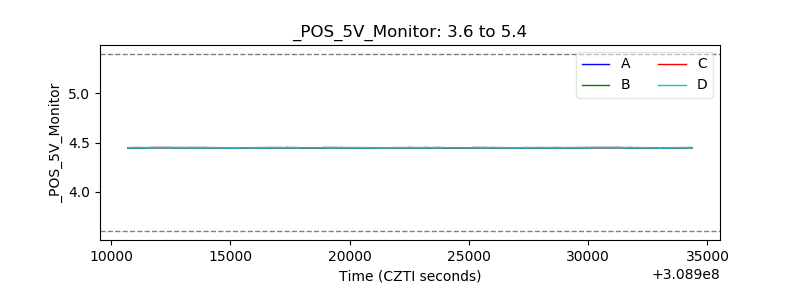 |
| _ROLL_ROT | 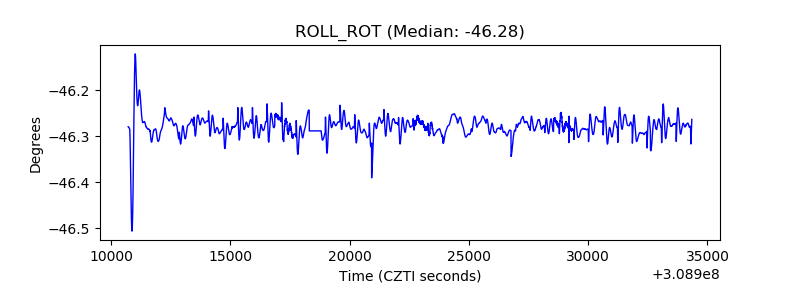 |
| _Roll_DEC | 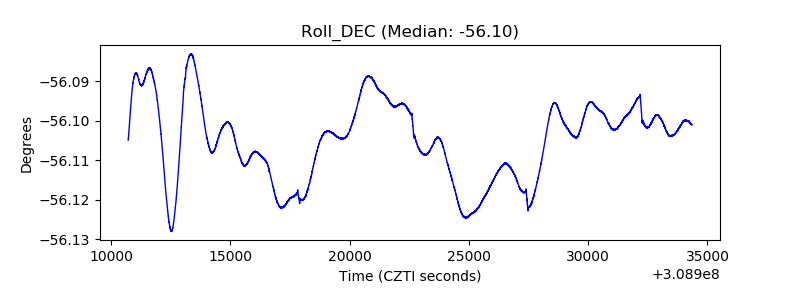 |
| _Roll_RA | 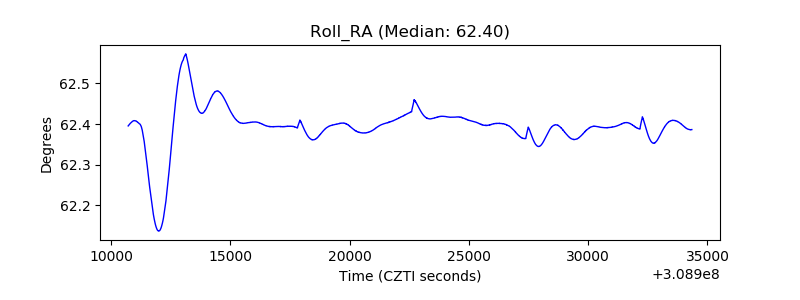 |
| Veto Counter | 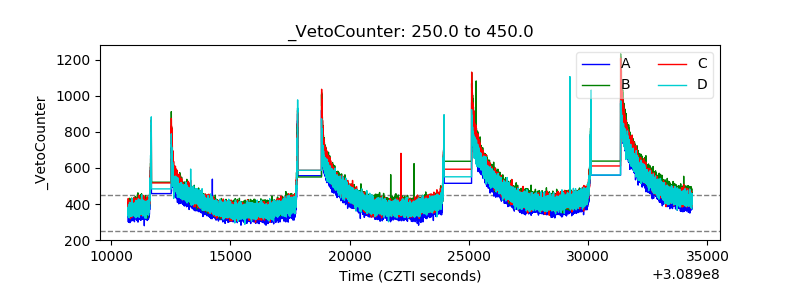 |