| Param | Original file | Final file |
|---|---|---|
| Filename | modeM0/AS1A07_010T05_9000003236_21897cztM0_level2.evt | modeM0/AS1A07_010T05_9000003236_21897cztM0_level2_quad_clean.evt |
| Size (bytes) | 919,825,920 | 172,160,640 |
| Size | 877.2 MB | 164.2 MB |
| Events in quadrant A | 6,302,821 | 1,101,072 |
| Events in quadrant B | 6,671,368 | 1,111,767 |
| Events in quadrant C | 7,526,739 | 1,051,488 |
| Events in quadrant D | 6,477,665 | 1,052,875 |
| Mode M0 | |||
|---|---|---|---|
| Quadrant | BADHDUFLAG | Total packets | Discarded packets |
| A | 0 | 27412 | 3 |
| B | 0 | 28261 | 3 |
| C | 0 | 31033 | 3 |
| D | 0 | 28042 | 3 |
| Mode SS | |||
|---|---|---|---|
| Quadrant | BADHDUFLAG | Total packets | Discarded packets |
| A | 0 | 264 | 0 |
| B | 0 | 264 | 0 |
| C | 0 | 264 | 0 |
| D | 0 | 264 | 0 |
| Mode M9 | |||
|---|---|---|---|
| Quadrant | BADHDUFLAG | Total packets | Discarded packets |
| A | 0 | 30 | 0 |
| B | 0 | 30 | 0 |
| C | 0 | 30 | 0 |
| D | 0 | 30 | 0 |
| Quadrant | Total seconds | Saturated seconds | Saturation percentage |
|---|---|---|---|
| A | 12982 | 165 | 1.270991% |
| B | 12982 | 221 | 1.702357% |
| C | 12982 | 758 | 5.838854% |
| D | 12982 | 153 | 1.178555% |
Noise dominated data is calculated using 1-second bins in cleaned event files. If a bin has >2000 counts, and if more than 50% of those come from <1% of pixels, then it is considered to be noise-dominated and hence unusable.
| Quadrant | # 1 sec bins | Bins with >0 counts | Bins with >2000 counts | High rate bins dominated by noise | Noise dominated (total time) | Noise dominated (detector-on time) | Marked lightcurve |
|---|---|---|---|---|---|---|---|
| A | 15967 | 12982 | 2 | 2 | 0.01% | 0.02% | 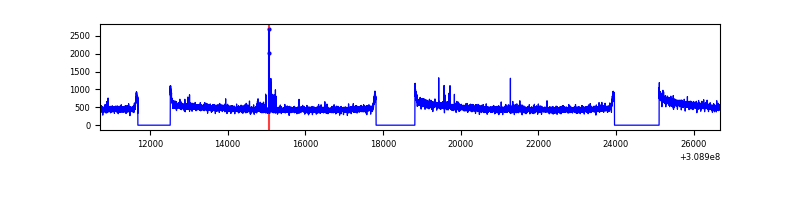 |
| B | 15967 | 12982 | 24 | 24 | 0.15% | 0.18% | 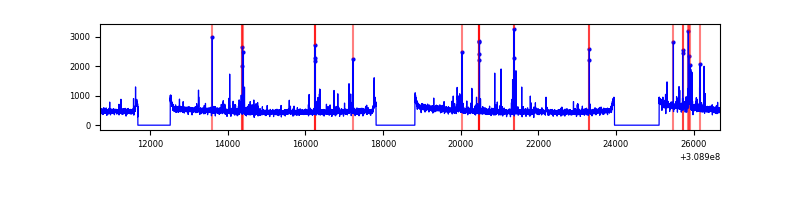 |
| C | 15967 | 12982 | 473 | 473 | 2.96% | 3.64% | 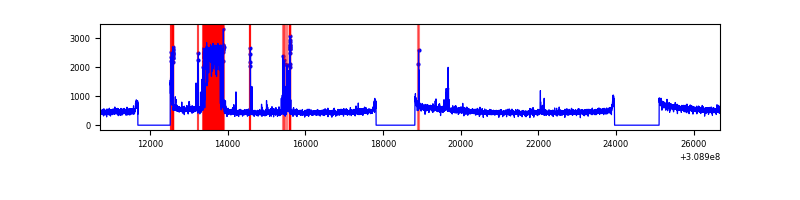 |
| D | 15967 | 12982 | 15 | 15 | 0.09% | 0.12% | 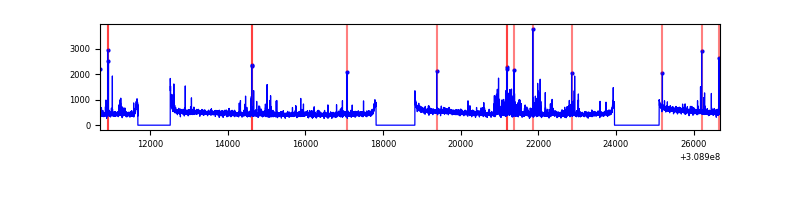 |
Top three noisy pixels from each quadrant. If the there are fewer than three noisy pixels in the level2.evt file, extra rows are filled as -1
| Pixel properties | Quadrant properties | ||||||
|---|---|---|---|---|---|---|---|
| Quadrant | DetID | PixID | Counts | Sigma | Mean | Median | Sigma |
| A | 5 | 16 | 53491 | 161.71 | 1620 | 1584 | 321.0 |
| A | 13 | 254 | 23277 | 67.58 | 1620 | 1584 | 321.0 |
| A | 0 | 226 | 13891 | 38.34 | 1620 | 1584 | 321.0 |
| B | 3 | 64 | 137190 | 453.92 | 1611 | 1571 | 298.8 |
| B | 0 | 230 | 81136 | 266.31 | 1611 | 1571 | 298.8 |
| B | 0 | 197 | 53831 | 174.92 | 1611 | 1571 | 298.8 |
| C | 10 | 22 | 1413405 | 4049.74 | 1505 | 1515 | 348.6 |
| C | 14 | 238 | 238585 | 679.99 | 1505 | 1515 | 348.6 |
| C | 4 | 175 | 12310 | 30.96 | 1505 | 1515 | 348.6 |
| D | 7 | 238 | 228466 | 552.46 | 1566 | 1529 | 410.8 |
| D | 1 | 52 | 135961 | 327.26 | 1566 | 1529 | 410.8 |
| D | 2 | 234 | 60348 | 143.19 | 1566 | 1529 | 410.8 |
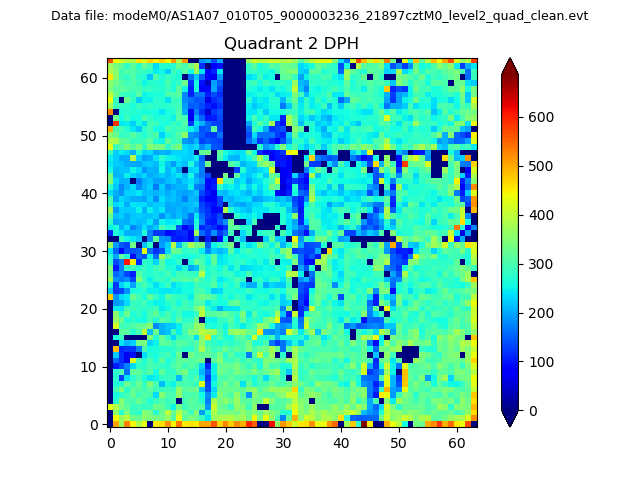
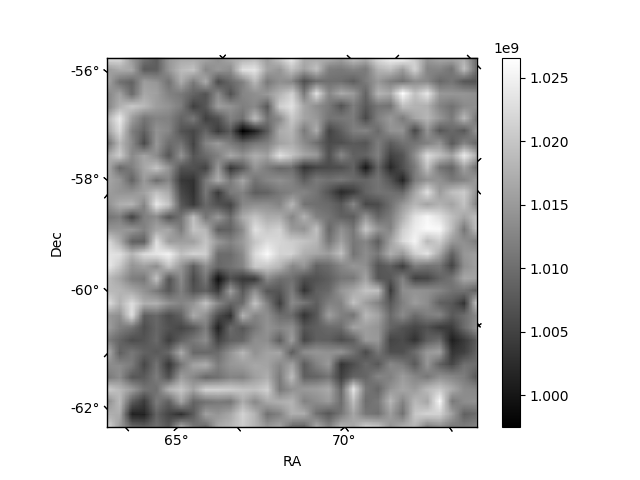
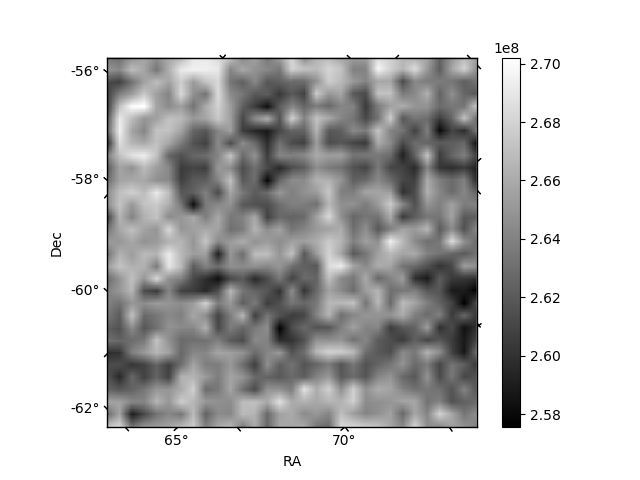
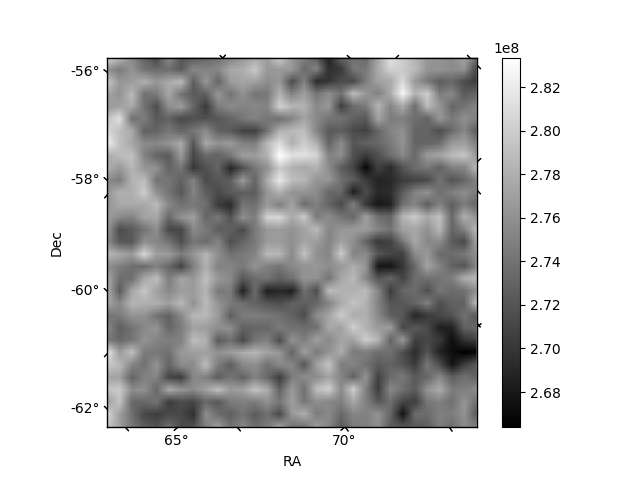
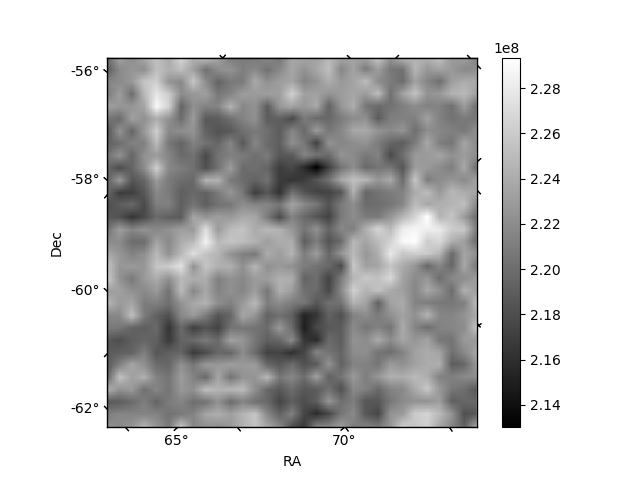
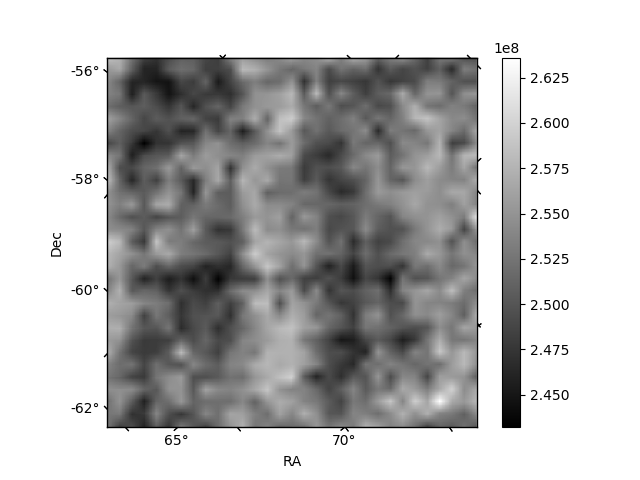
Histogram calculated using DETX and DETY for each event in the final _common_clean file
| Quadrant A | 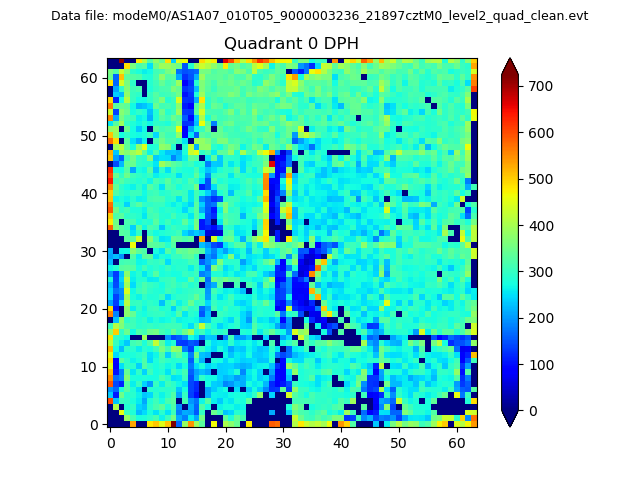 |
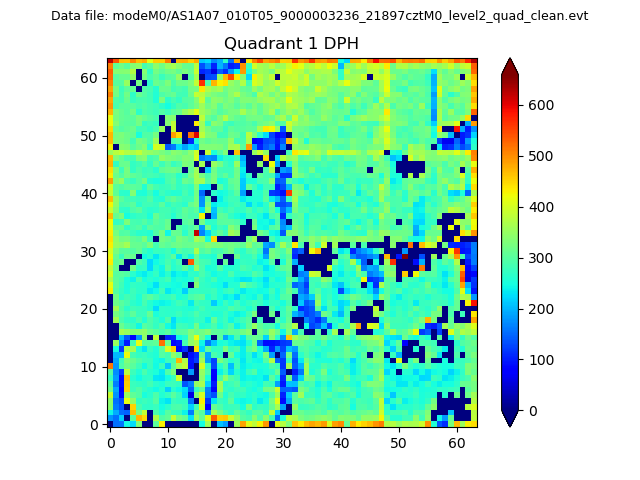 |
Quadrant B |
|---|---|---|---|
| Quadrant D | 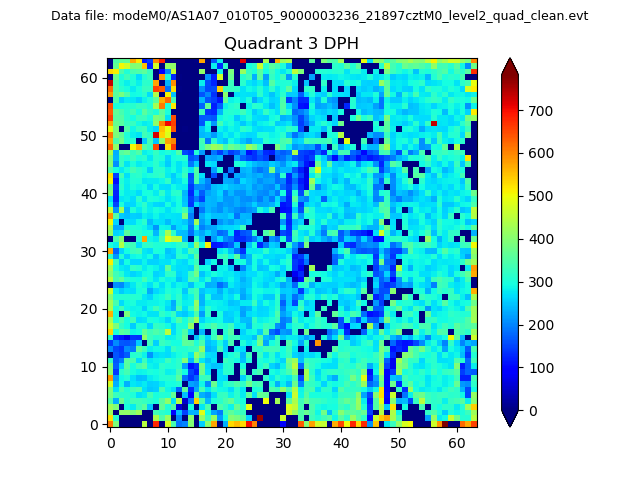 |
 |
Quadrant C |
| Plot type | Count rate plots | Images |
|---|---|---|
| Comparison with Poisson distribution Blue bars denote a histogram of data divided into 1 sec bins. Red curve is a Poisson curve with rate = median count rate of data. |
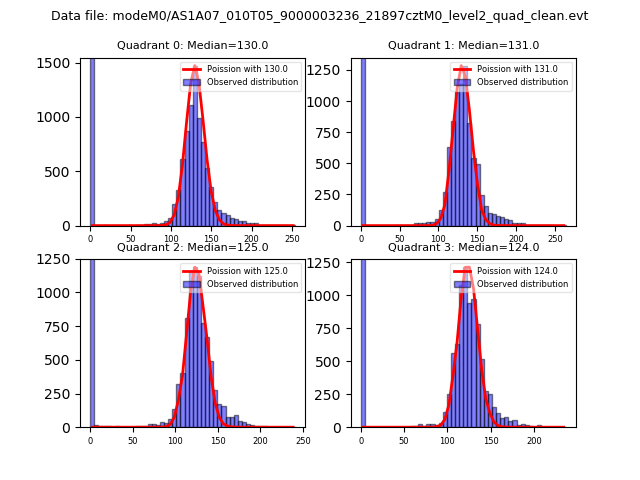 |
 |
| Quadrant-wise count rates Data is divided into 100 sec bins |
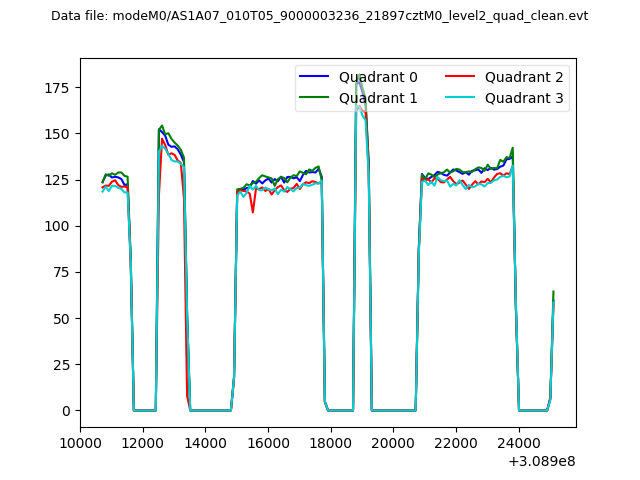 |
|
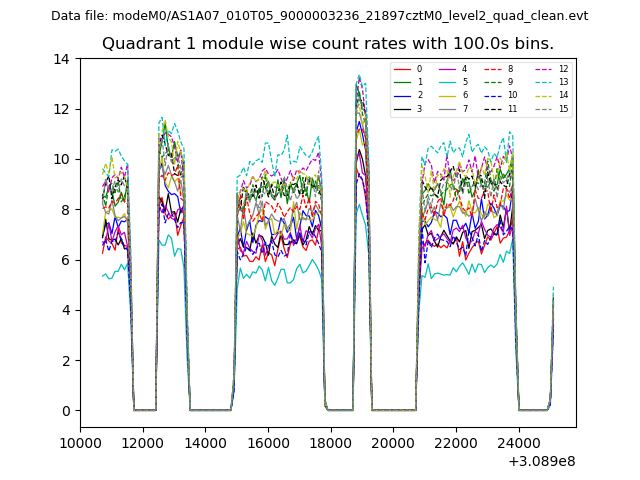
| Module-wise count rates for Quadrant A Data is divided into 100 sec bins |
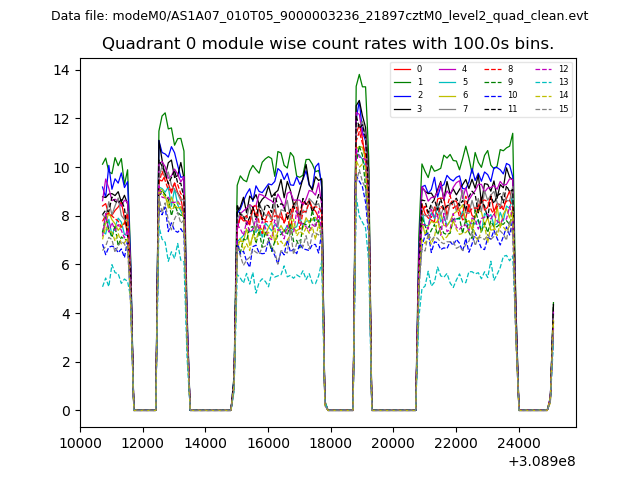 |
 |
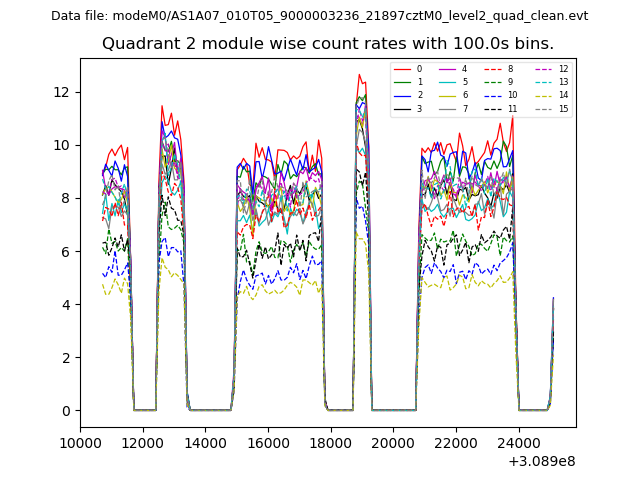
| Module-wise count rates for Quadrant B Data is divided into 100 sec bins |
 |
 |
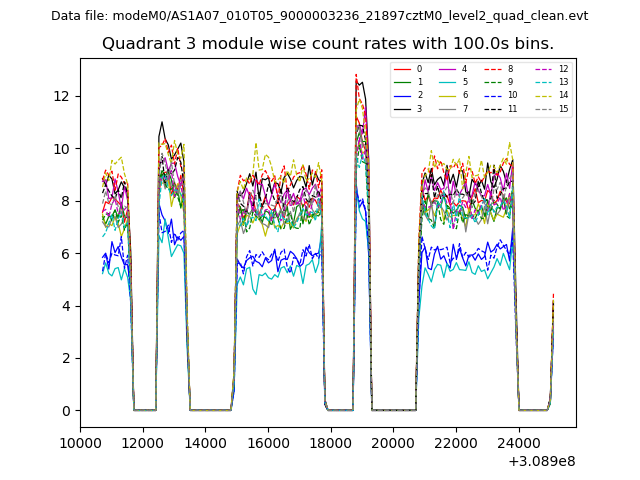
| Module-wise count rates for Quadrant C Data is divided into 100 sec bins |
 |
 |
| Module-wise count rates for Quadrant D Data is divided into 100 sec bins |
 |
 |
| Parameter | Plot |
|---|---|
| CZT HV Monitor | 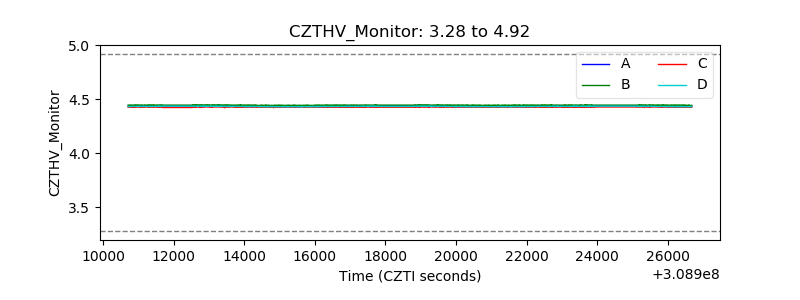 |
| D_VDD | 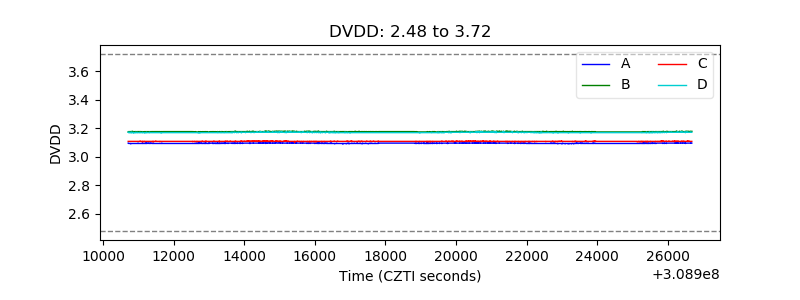 |
| Temperature 1 | 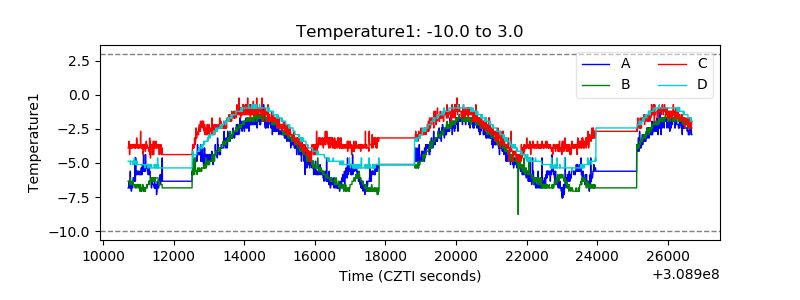 |
| Veto HV Monitor | 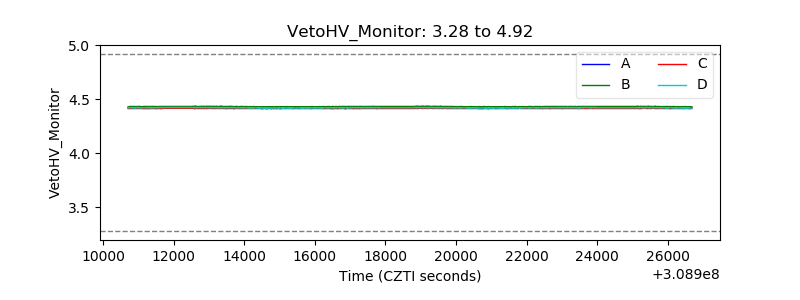 |
| Veto LLD | 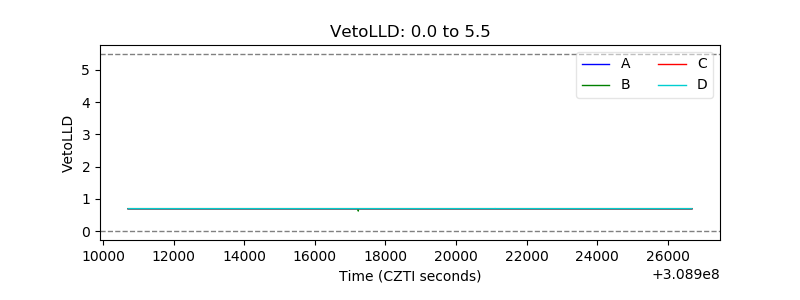 |
| Alpha Counter | 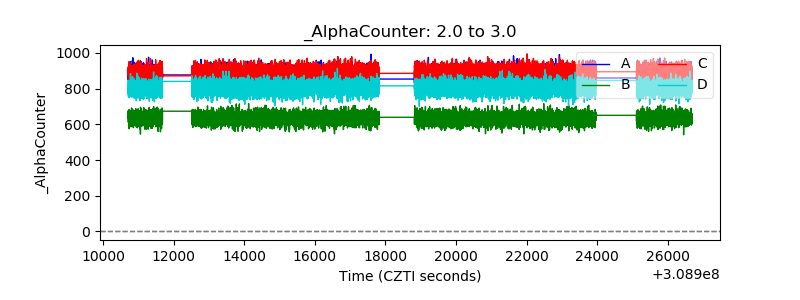 |
| _CPM_Rate | 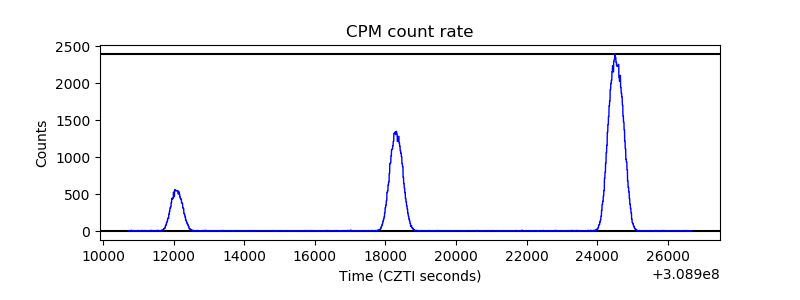 |
| CZT Counter | 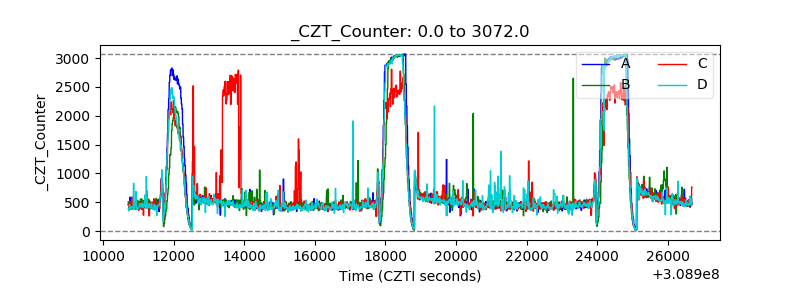 |
| +2.5 Volts monitor | 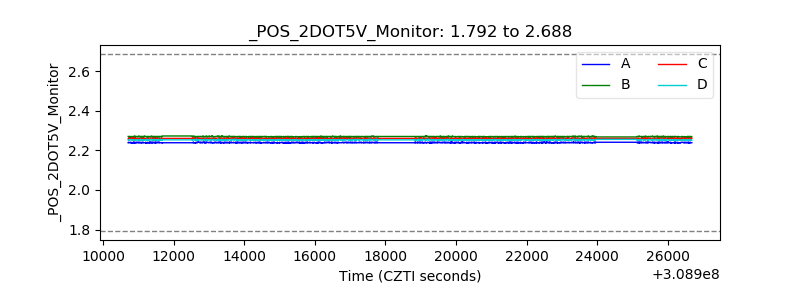 |
| +5 Volts monitor |  |
| _ROLL_ROT | 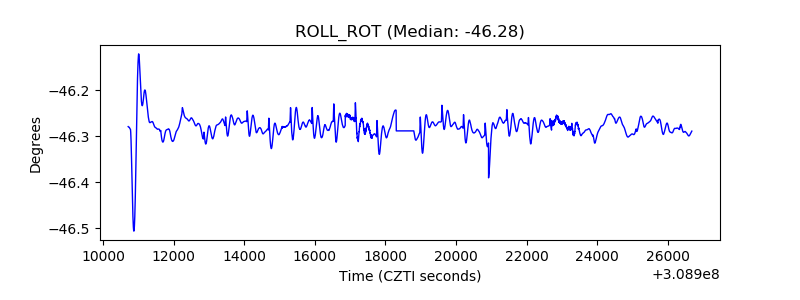 |
| _Roll_DEC | 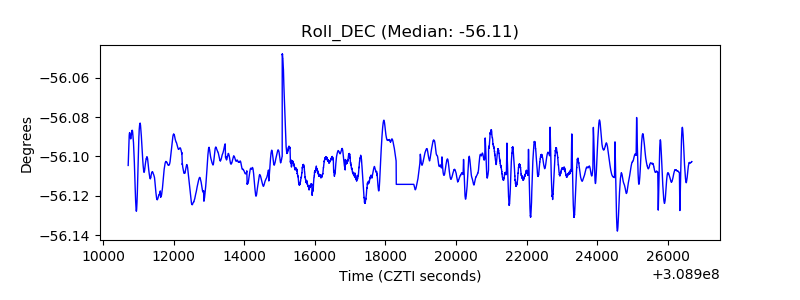 |
| _Roll_RA | 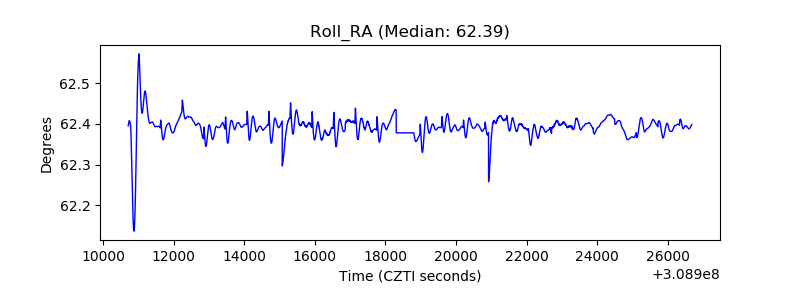 |
| Veto Counter | 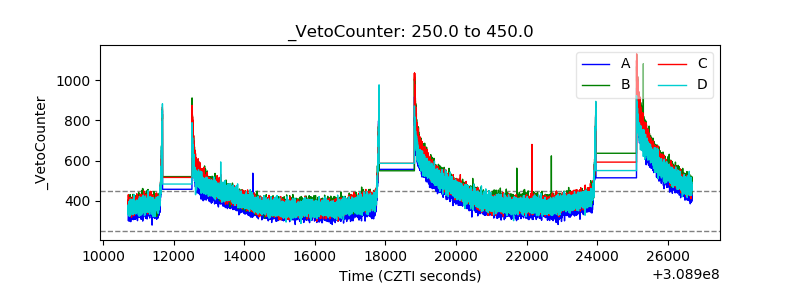 |