| Param | Original file | Final file |
|---|---|---|
| Filename | modeM0/AS1A07_010T05_9000003236_21898cztM0_level2.evt | modeM0/AS1A07_010T05_9000003236_21898cztM0_level2_quad_clean.evt |
| Size (bytes) | 481,979,520 | 82,998,720 |
| Size | 459.7 MB | 79.2 MB |
| Events in quadrant A | 3,456,643 | 527,609 |
| Events in quadrant B | 3,669,445 | 535,362 |
| Events in quadrant C | 3,615,504 | 499,466 |
| Events in quadrant D | 3,414,375 | 497,968 |
| Mode M0 | |||
|---|---|---|---|
| Quadrant | BADHDUFLAG | Total packets | Discarded packets |
| A | 0 | 14616 | 2 |
| B | 0 | 15216 | 2 |
| C | 0 | 14975 | 2 |
| D | 0 | 14721 | 2 |
| Mode SS | |||
|---|---|---|---|
| Quadrant | BADHDUFLAG | Total packets | Discarded packets |
| A | 0 | 132 | 0 |
| B | 0 | 132 | 0 |
| C | 0 | 132 | 0 |
| D | 0 | 132 | 0 |
| Mode M9 | |||
|---|---|---|---|
| Quadrant | BADHDUFLAG | Total packets | Discarded packets |
| A | 0 | 13 | 0 |
| B | 0 | 14 | 0 |
| C | 0 | 14 | 0 |
| D | 0 | 14 | 0 |
| Quadrant | Total seconds | Saturated seconds | Saturation percentage |
|---|---|---|---|
| A | 6493 | 84 | 1.293701% |
| B | 6493 | 109 | 1.678731% |
| C | 6493 | 164 | 2.525797% |
| D | 6493 | 76 | 1.170491% |
Noise dominated data is calculated using 1-second bins in cleaned event files. If a bin has >2000 counts, and if more than 50% of those come from <1% of pixels, then it is considered to be noise-dominated and hence unusable.
| Quadrant | # 1 sec bins | Bins with >0 counts | Bins with >2000 counts | High rate bins dominated by noise | Noise dominated (total time) | Noise dominated (detector-on time) | Marked lightcurve |
|---|---|---|---|---|---|---|---|
| A | 7723 | 6493 | 0 | 0 | 0.00% | 0.00% | 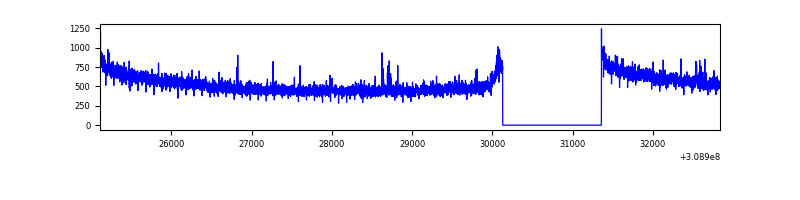 |
| B | 7723 | 6493 | 10 | 10 | 0.13% | 0.15% |  |
| C | 7723 | 6493 | 48 | 48 | 0.62% | 0.74% | 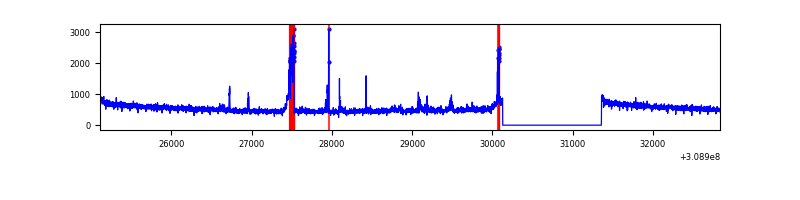 |
| D | 7723 | 6493 | 14 | 14 | 0.18% | 0.22% |  |
Top three noisy pixels from each quadrant. If the there are fewer than three noisy pixels in the level2.evt file, extra rows are filled as -1
| Pixel properties | Quadrant properties | ||||||
|---|---|---|---|---|---|---|---|
| Quadrant | DetID | PixID | Counts | Sigma | Mean | Median | Sigma |
| A | 5 | 16 | 28656 | 158.19 | 889 | 874 | 175.6 |
| A | 13 | 254 | 11721 | 61.76 | 889 | 874 | 175.6 |
| A | 0 | 226 | 7809 | 39.49 | 889 | 874 | 175.6 |
| B | 3 | 64 | 73717 | 450.29 | 882 | 863 | 161.8 |
| B | 0 | 230 | 57943 | 352.8 | 882 | 863 | 161.8 |
| B | 0 | 197 | 37833 | 228.5 | 882 | 863 | 161.8 |
| C | 10 | 22 | 238886 | 1252.71 | 829 | 834 | 190.0 |
| C | 14 | 238 | 137387 | 718.59 | 829 | 834 | 190.0 |
| C | 4 | 175 | 8164 | 38.57 | 829 | 834 | 190.0 |
| D | 12 | 227 | 55837 | 272.35 | 850 | 826 | 202.0 |
| D | 7 | 238 | 34531 | 166.87 | 850 | 826 | 202.0 |
| D | 2 | 234 | 29857 | 143.73 | 850 | 826 | 202.0 |
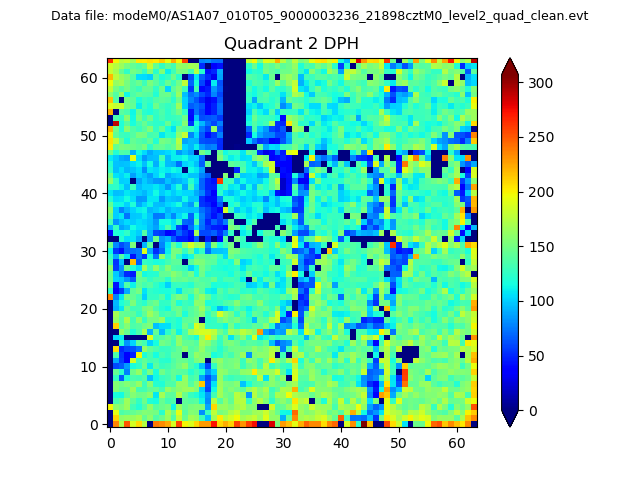
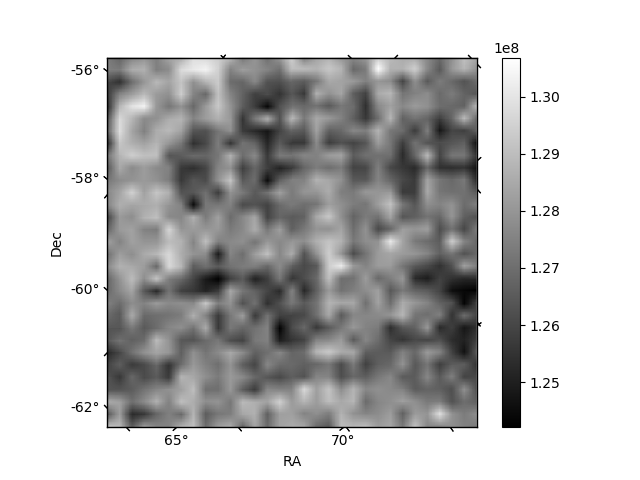
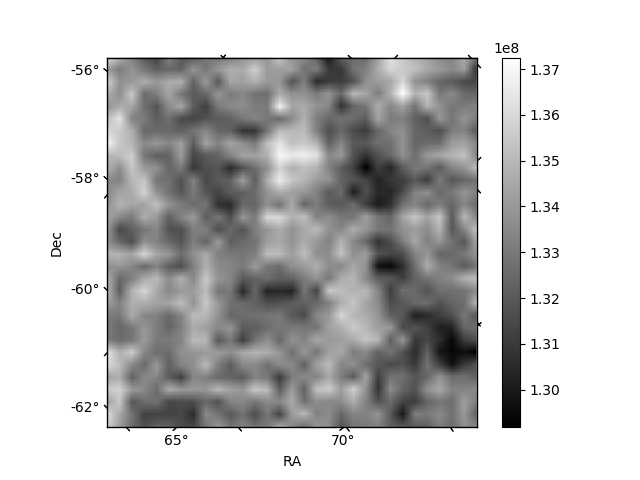
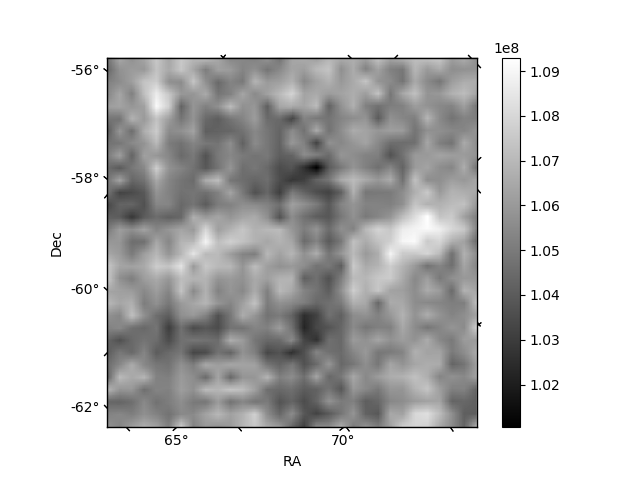
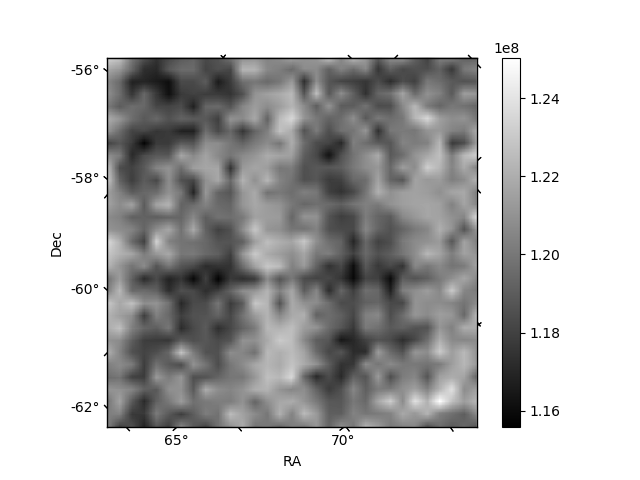
Histogram calculated using DETX and DETY for each event in the final _common_clean file
| Quadrant A | 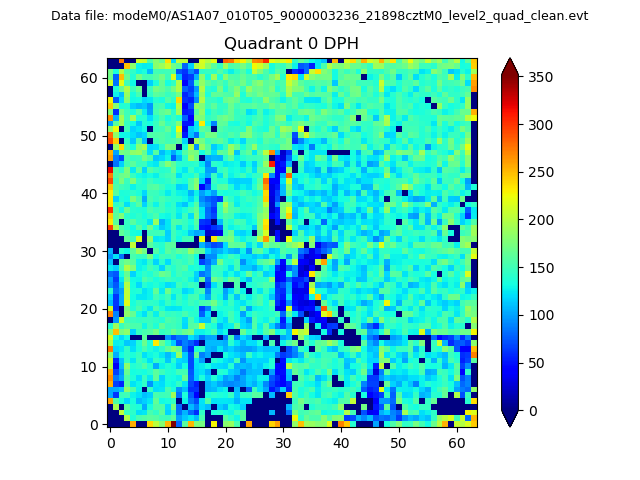 |
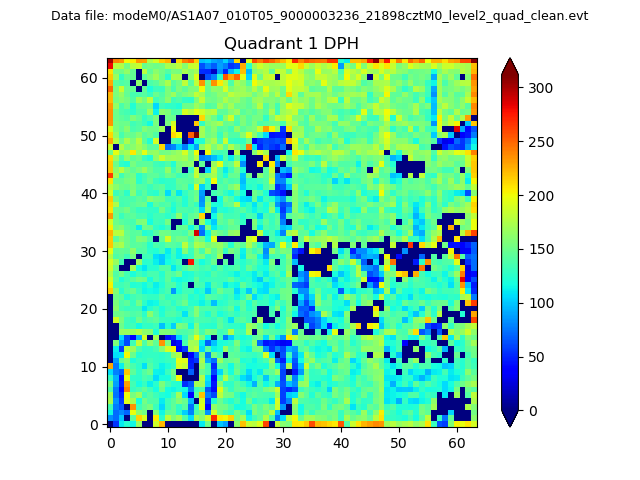 |
Quadrant B |
|---|---|---|---|
| Quadrant D | 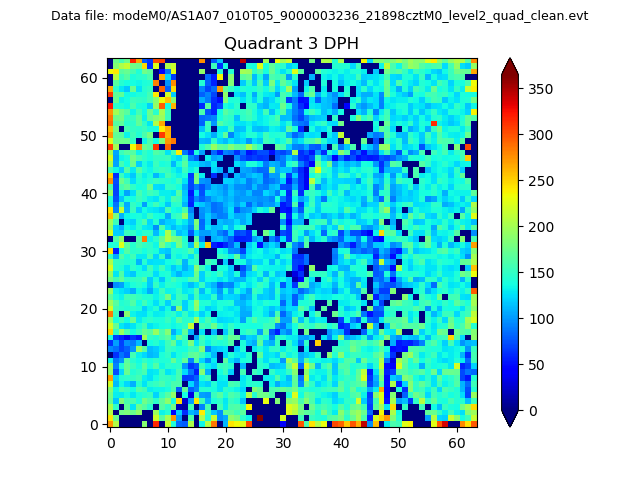 |
 |
Quadrant C |
| Plot type | Count rate plots | Images |
|---|---|---|
| Comparison with Poisson distribution Blue bars denote a histogram of data divided into 1 sec bins. Red curve is a Poisson curve with rate = median count rate of data. |
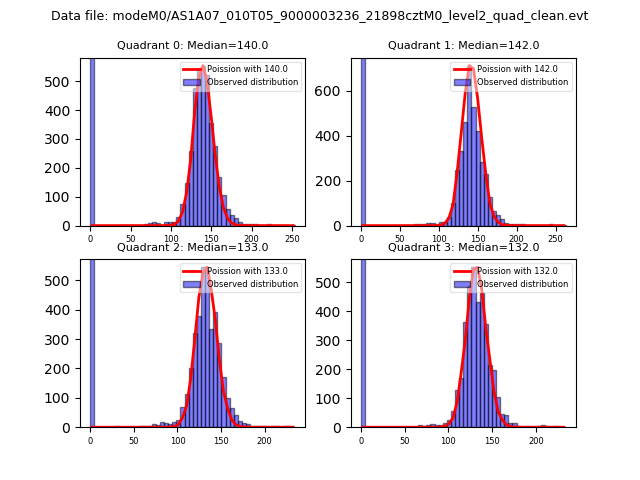 |
 |
| Quadrant-wise count rates Data is divided into 100 sec bins |
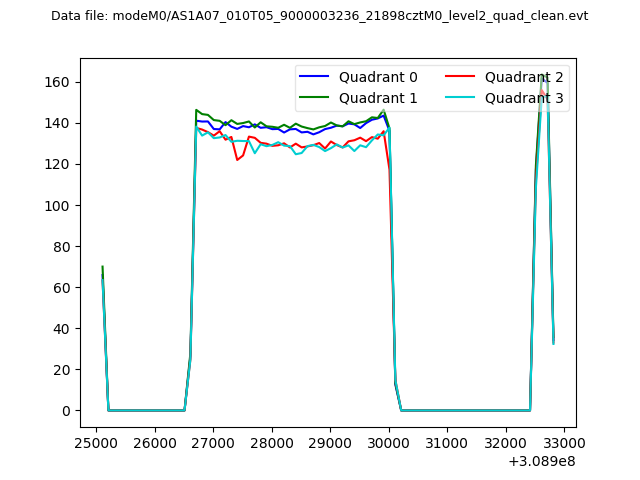 |
|
| Module-wise count rates for Quadrant A Data is divided into 100 sec bins |
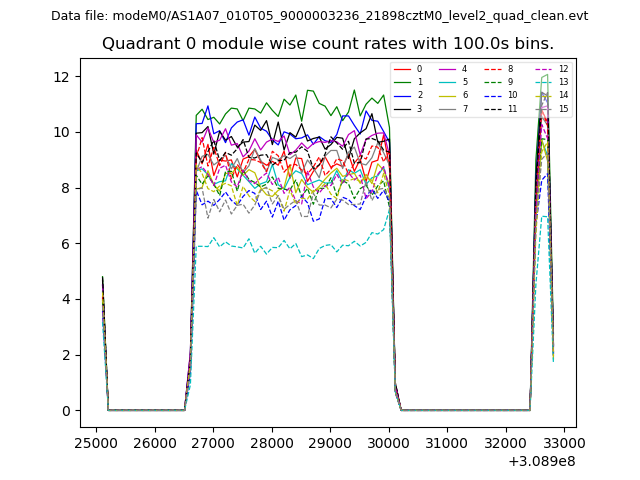 |
 |
| Module-wise count rates for Quadrant B Data is divided into 100 sec bins |
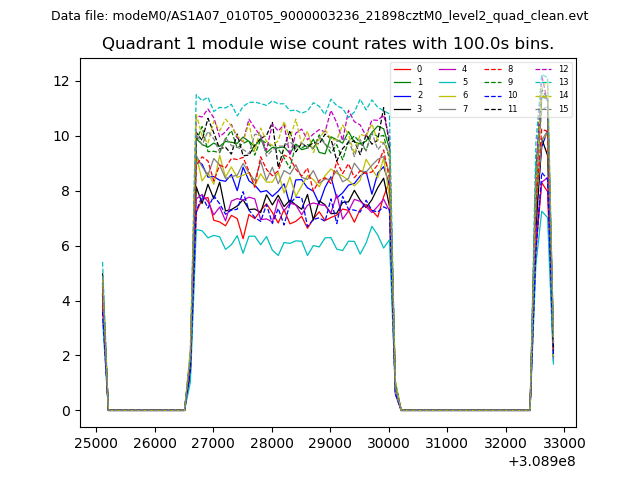 |
 |
| Module-wise count rates for Quadrant C Data is divided into 100 sec bins |
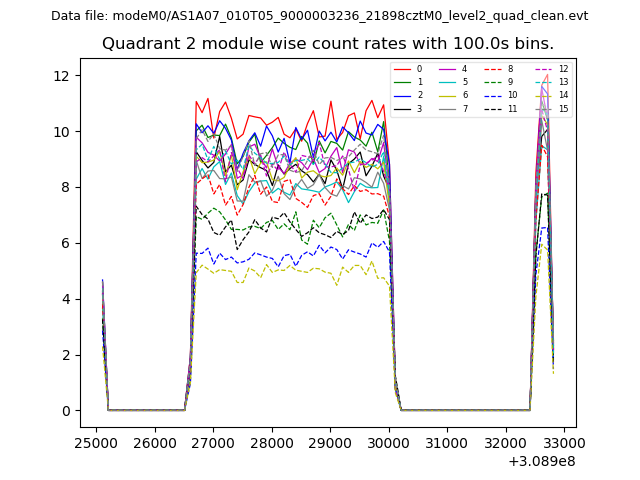 |
 |
| Module-wise count rates for Quadrant D Data is divided into 100 sec bins |
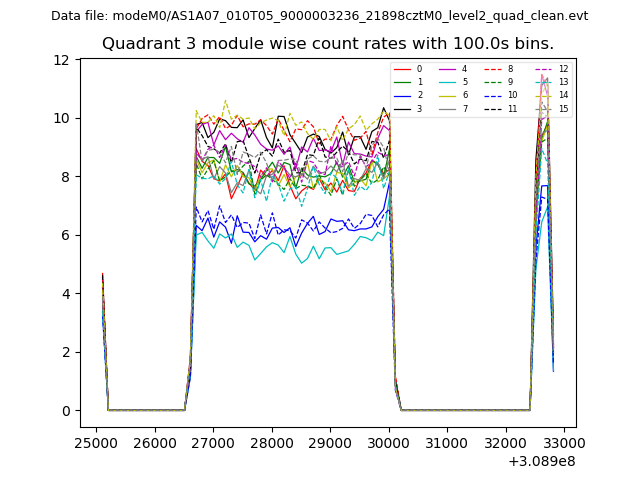 |
 |
| Parameter | Plot |
|---|---|
| CZT HV Monitor | 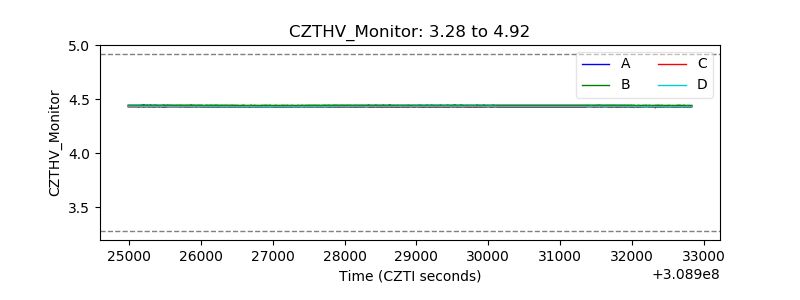 |
| D_VDD | 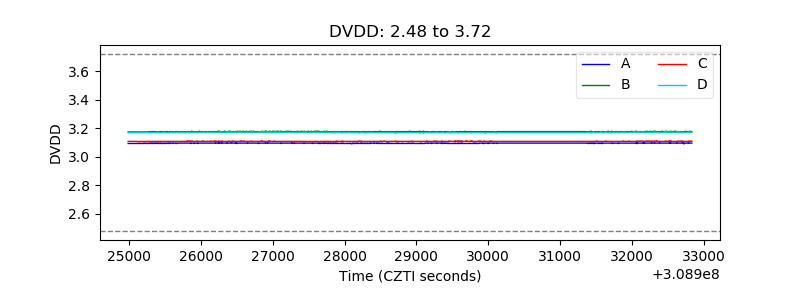 |
| Temperature 1 | 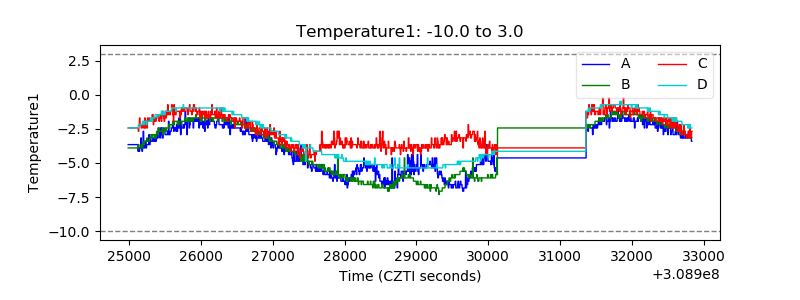 |
| Veto HV Monitor | 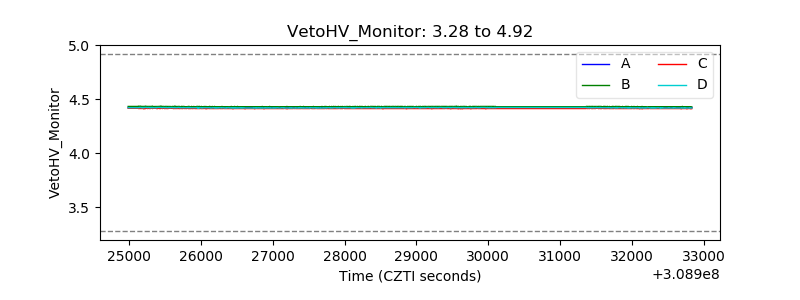 |
| Veto LLD | 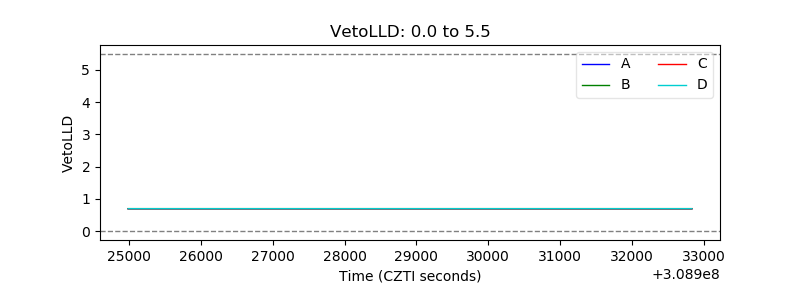 |
| Alpha Counter | 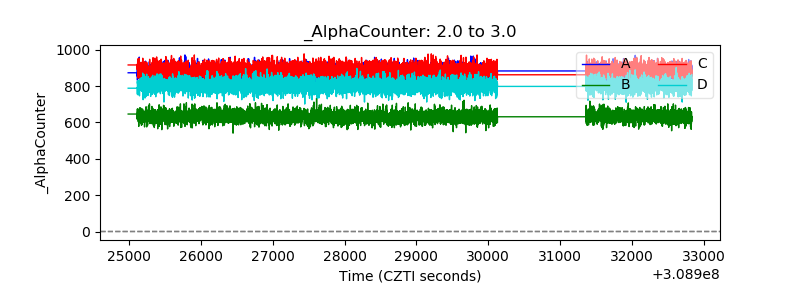 |
| _CPM_Rate | 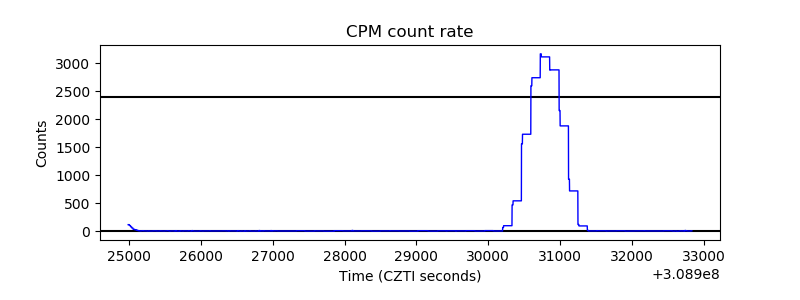 |
| CZT Counter | 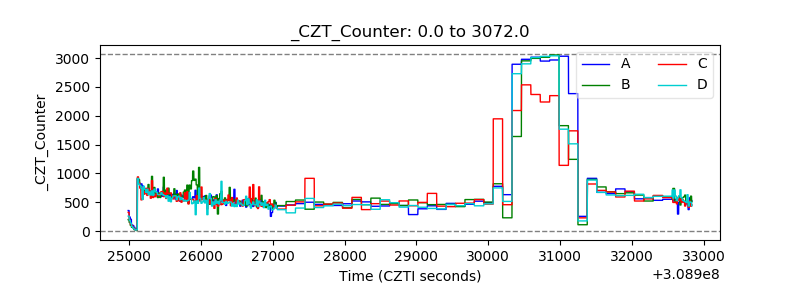 |
| +2.5 Volts monitor |  |
| +5 Volts monitor |  |
| _ROLL_ROT | 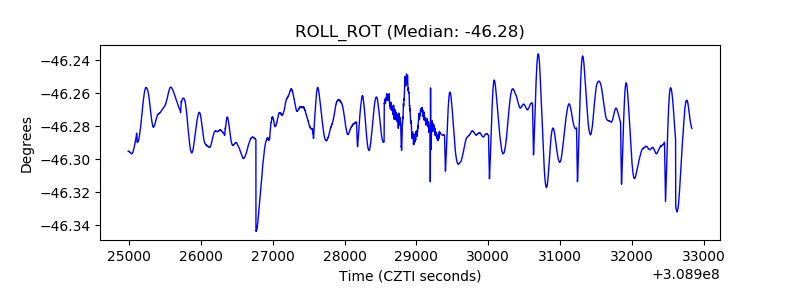 |
| _Roll_DEC | 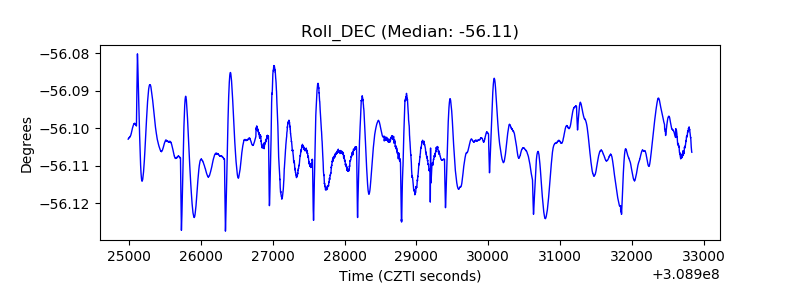 |
| _Roll_RA | 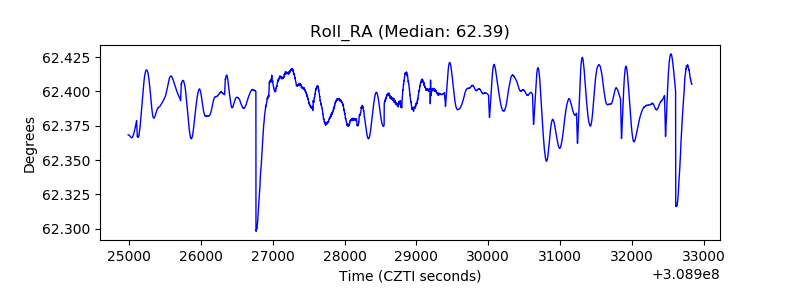 |
| Veto Counter | 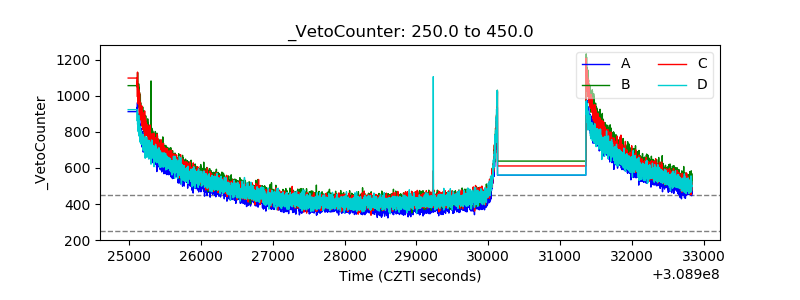 |