| Param | Original file | Final file |
|---|---|---|
| Filename | modeM0/AS1A07_010T05_9000003236_21899cztM0_level2.evt | modeM0/AS1A07_010T05_9000003236_21899cztM0_level2_quad_clean.evt |
| Size (bytes) | 223,453,440 | 42,102,720 |
| Size | 213.1 MB | 40.2 MB |
| Events in quadrant A | 1,641,416 | 273,268 |
| Events in quadrant B | 1,693,688 | 276,294 |
| Events in quadrant C | 1,571,600 | 257,671 |
| Events in quadrant D | 1,655,772 | 254,227 |
| Mode M0 | |||
|---|---|---|---|
| Quadrant | BADHDUFLAG | Total packets | Discarded packets |
| A | 0 | 6854 | 1 |
| B | 0 | 7009 | 1 |
| C | 0 | 6656 | 1 |
| D | 0 | 7080 | 1 |
| Mode SS | |||
|---|---|---|---|
| Quadrant | BADHDUFLAG | Total packets | Discarded packets |
| A | 0 | 60 | 0 |
| B | 0 | 60 | 0 |
| C | 0 | 60 | 0 |
| D | 0 | 60 | 0 |
| Mode M9 | |||
|---|---|---|---|
| Quadrant | BADHDUFLAG | Total packets | Discarded packets |
| A | 0 | 1 | 0 |
| B | 0 | 2 | 0 |
| C | 0 | 2 | 0 |
| D | 0 | 2 | 0 |
| Quadrant | Total seconds | Saturated seconds | Saturation percentage |
|---|---|---|---|
| A | 2988 | 12 | 0.401606% |
| B | 2988 | 17 | 0.568942% |
| C | 2988 | 29 | 0.970549% |
| D | 2988 | 6 | 0.200803% |
Noise dominated data is calculated using 1-second bins in cleaned event files. If a bin has >2000 counts, and if more than 50% of those come from <1% of pixels, then it is considered to be noise-dominated and hence unusable.
| Quadrant | # 1 sec bins | Bins with >0 counts | Bins with >2000 counts | High rate bins dominated by noise | Noise dominated (total time) | Noise dominated (detector-on time) | Marked lightcurve |
|---|---|---|---|---|---|---|---|
| A | 2988 | 2988 | 0 | 0 | 0.00% | 0.00% | 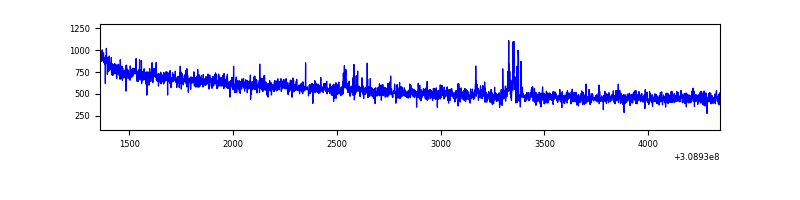 |
| B | 2988 | 2988 | 2 | 2 | 0.07% | 0.07% | 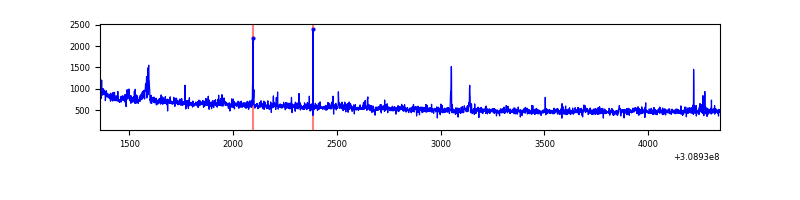 |
| C | 2988 | 2988 | 0 | 0 | 0.00% | 0.00% | 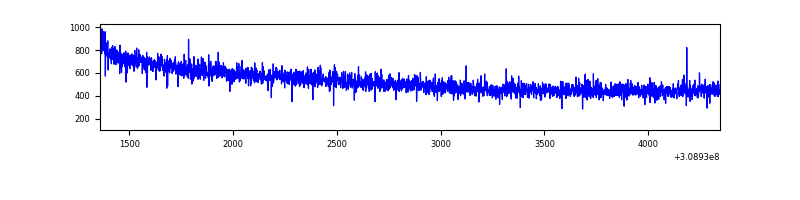 |
| D | 2988 | 2988 | 2 | 2 | 0.07% | 0.07% | 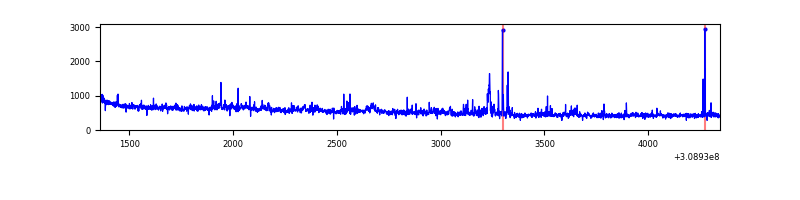 |
Top three noisy pixels from each quadrant. If the there are fewer than three noisy pixels in the level2.evt file, extra rows are filled as -1
| Pixel properties | Quadrant properties | ||||||
|---|---|---|---|---|---|---|---|
| Quadrant | DetID | PixID | Counts | Sigma | Mean | Median | Sigma |
| A | 5 | 16 | 21052 | 246.07 | 420 | 415 | 83.9 |
| A | 13 | 254 | 5685 | 62.84 | 420 | 415 | 83.9 |
| A | 0 | 226 | 3830 | 40.72 | 420 | 415 | 83.9 |
| B | 0 | 197 | 26811 | 342.75 | 416 | 409 | 77.0 |
| B | 0 | 190 | 12334 | 154.81 | 416 | 409 | 77.0 |
| B | 3 | 64 | 11429 | 143.06 | 416 | 409 | 77.0 |
| C | 14 | 238 | 63694 | 710.61 | 386 | 388 | 89.1 |
| C | 13 | 61 | 2763 | 26.65 | 386 | 388 | 89.1 |
| C | 10 | 22 | 2344 | 21.95 | 386 | 388 | 89.1 |
| D | 12 | 227 | 70956 | 748.62 | 394 | 384 | 94.3 |
| D | 13 | 104 | 24703 | 257.97 | 394 | 384 | 94.3 |
| D | 7 | 238 | 18105 | 187.98 | 394 | 384 | 94.3 |
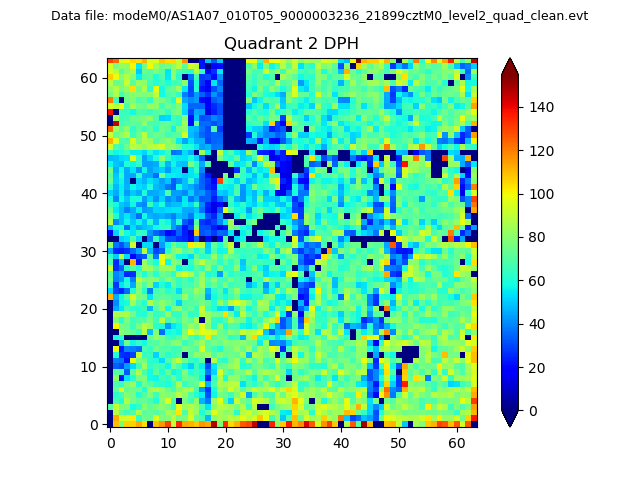
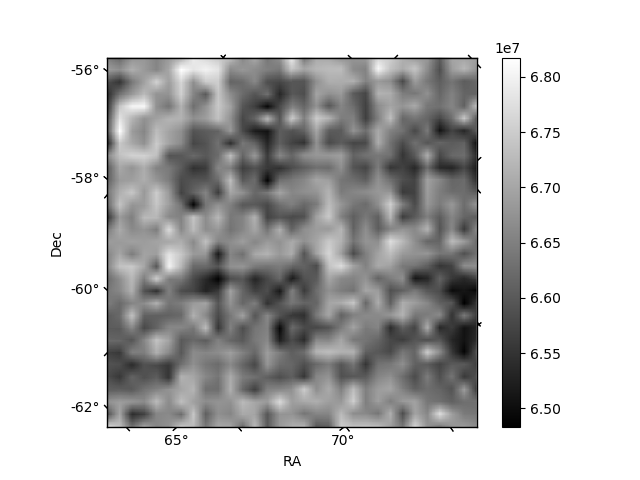
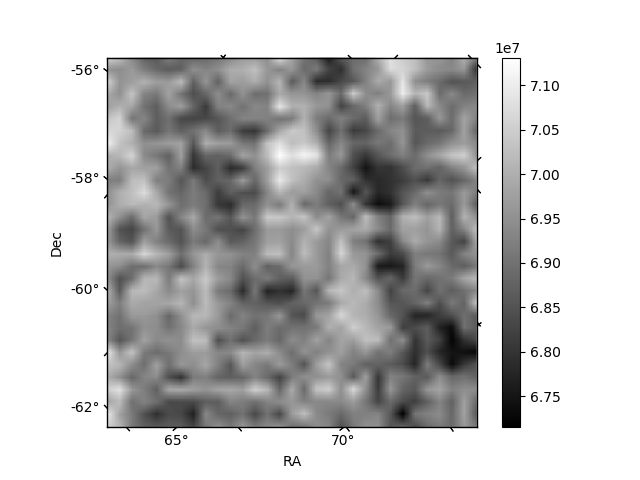
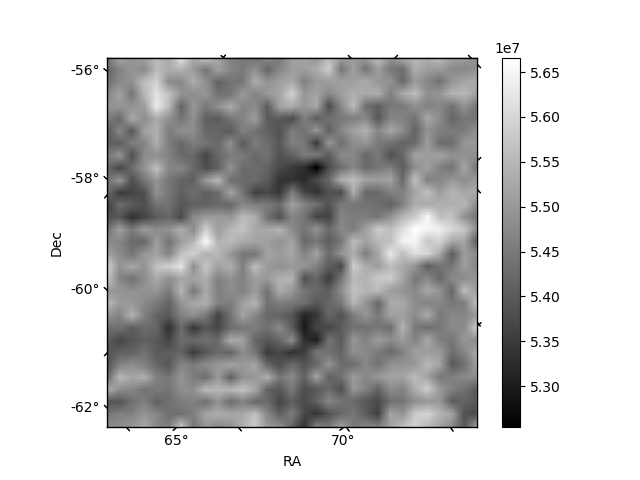
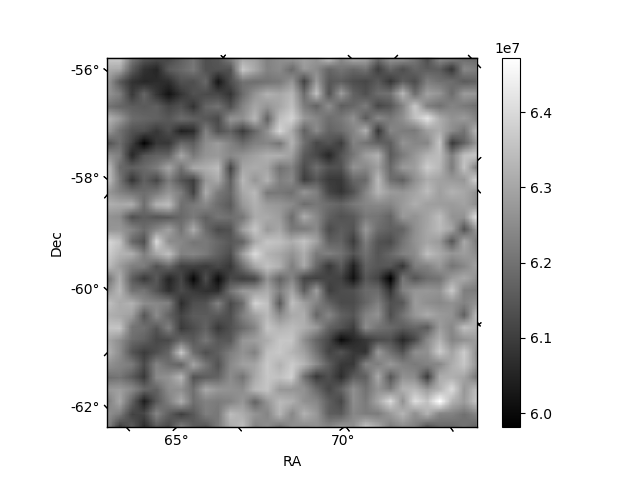
Histogram calculated using DETX and DETY for each event in the final _common_clean file
| Quadrant A | 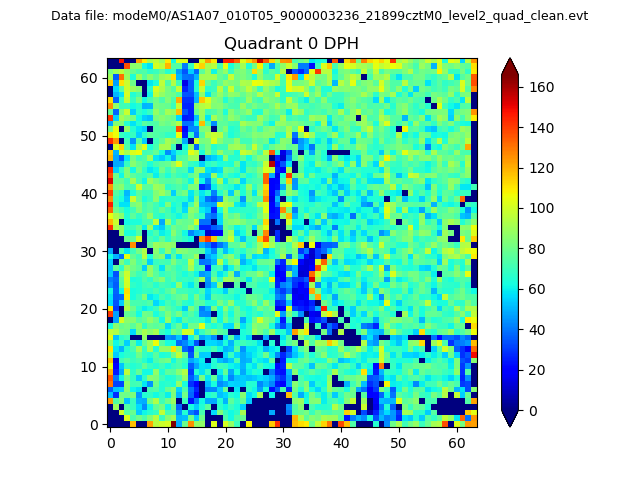 |
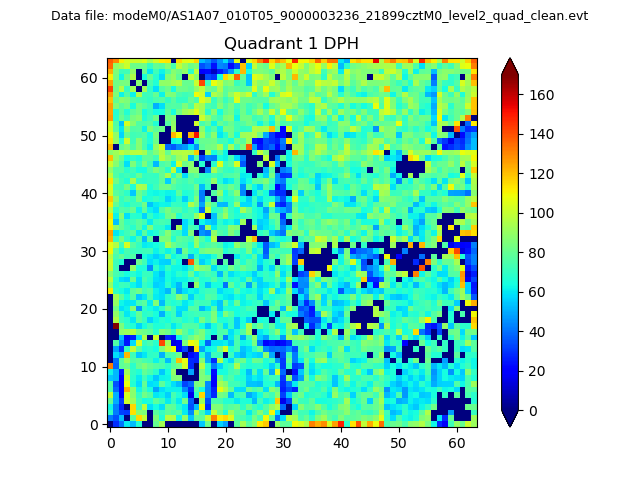 |
Quadrant B |
|---|---|---|---|
| Quadrant D | 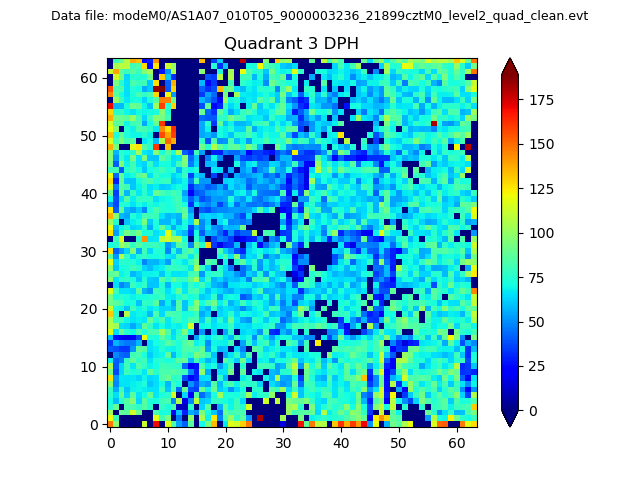 |
 |
Quadrant C |
| Plot type | Count rate plots | Images |
|---|---|---|
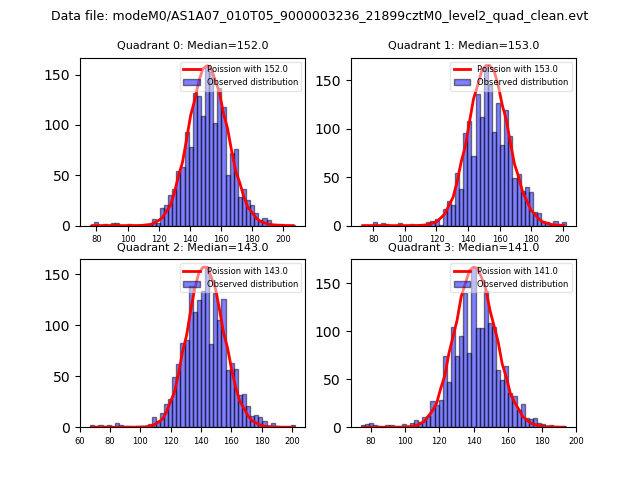
| Comparison with Poisson distribution Blue bars denote a histogram of data divided into 1 sec bins. Red curve is a Poisson curve with rate = median count rate of data. |
 |
 |
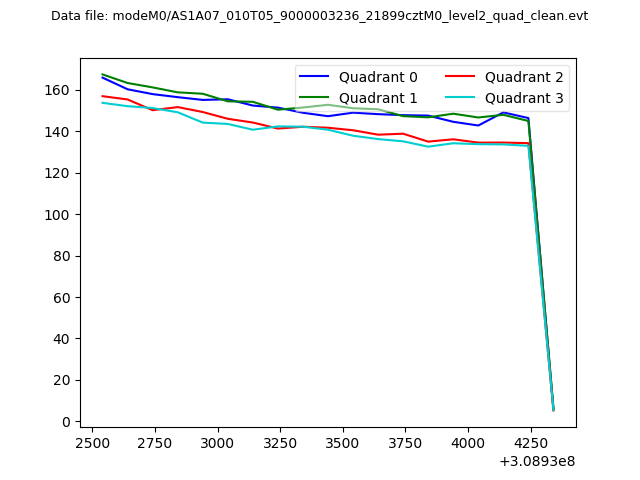
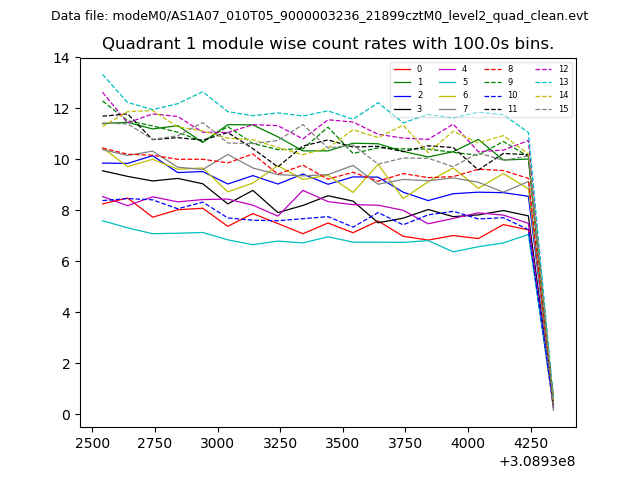
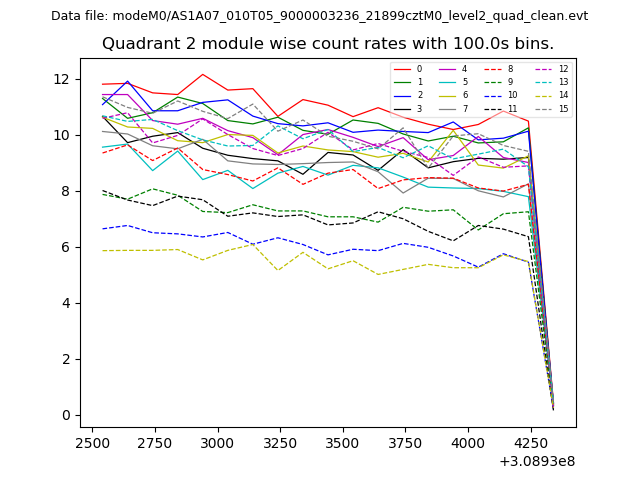
| Quadrant-wise count rates Data is divided into 100 sec bins |
 |
|
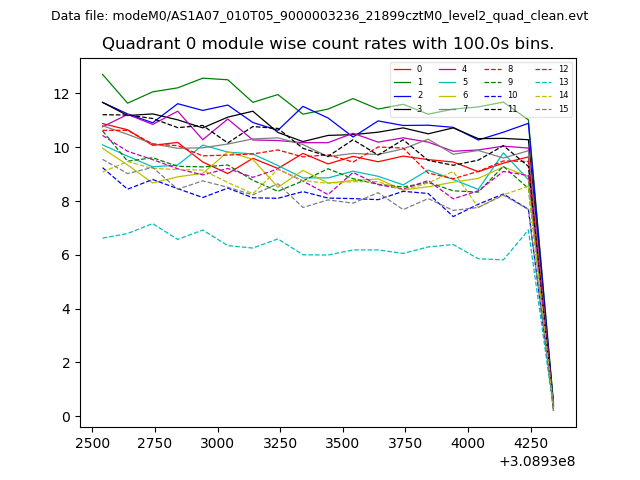
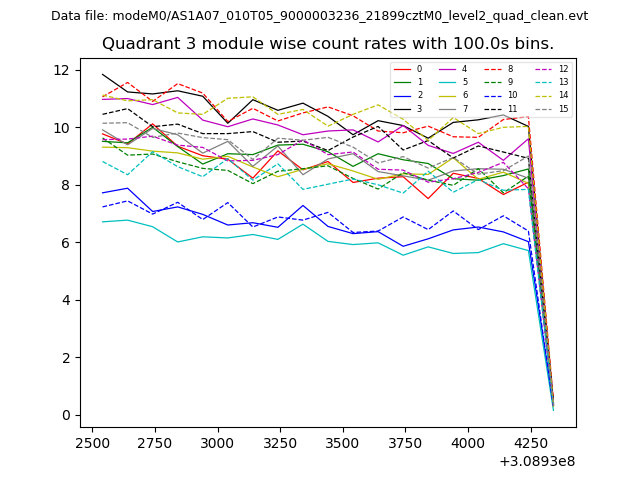
| Module-wise count rates for Quadrant A Data is divided into 100 sec bins |
 |
 |
| Module-wise count rates for Quadrant B Data is divided into 100 sec bins |
 |
 |
| Module-wise count rates for Quadrant C Data is divided into 100 sec bins |
 |
 |
| Module-wise count rates for Quadrant D Data is divided into 100 sec bins |
 |
 |
| Parameter | Plot |
|---|---|
| CZT HV Monitor | 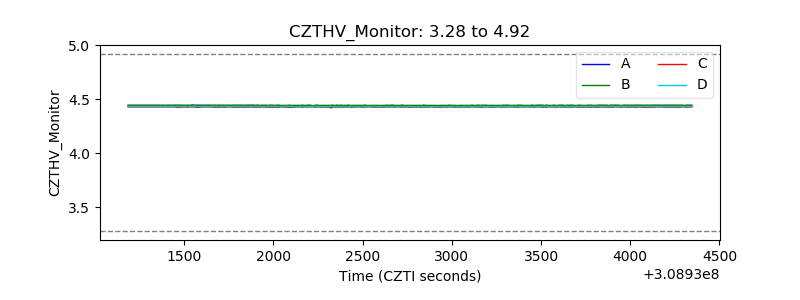 |
| D_VDD |  |
| Temperature 1 | 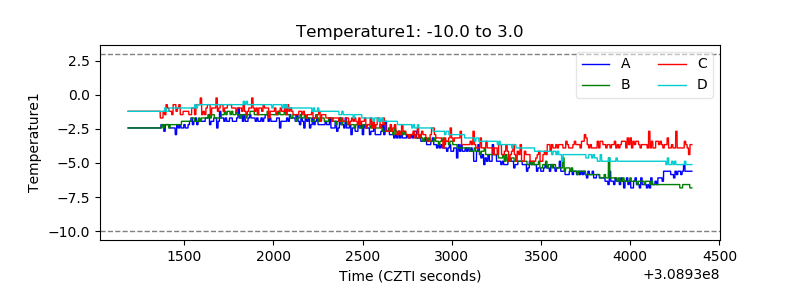 |
| Veto HV Monitor | 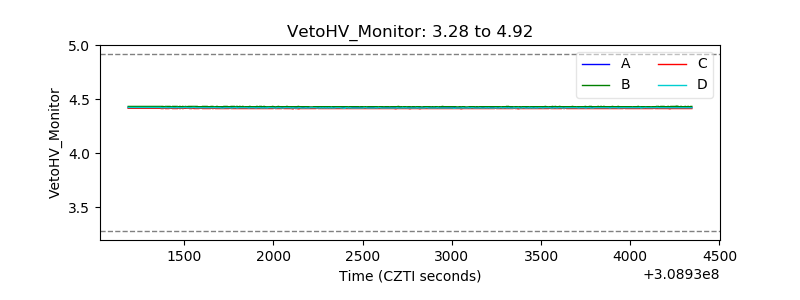 |
| Veto LLD | 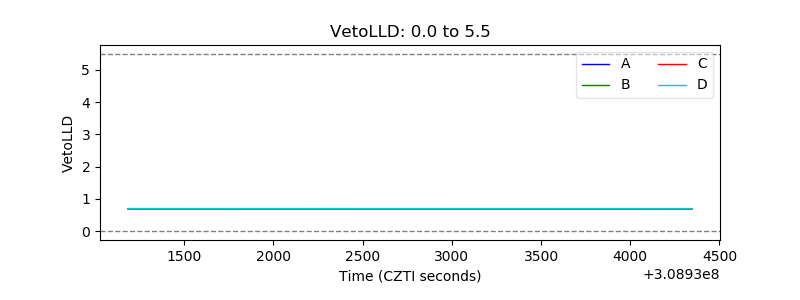 |
| Alpha Counter | 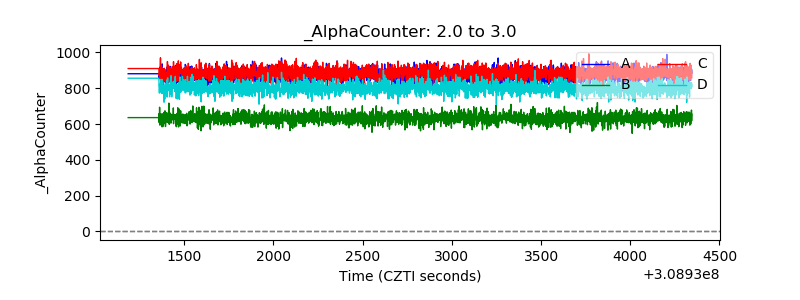 |
| _CPM_Rate | 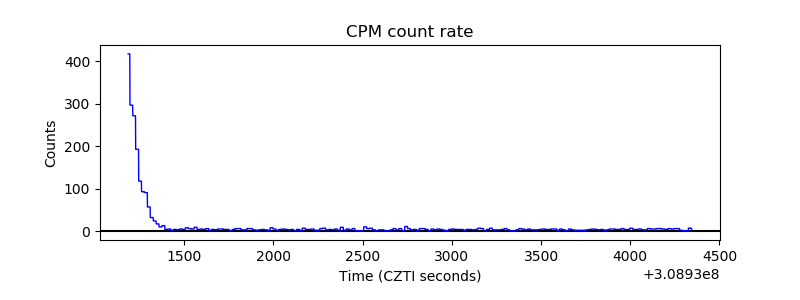 |
| CZT Counter | 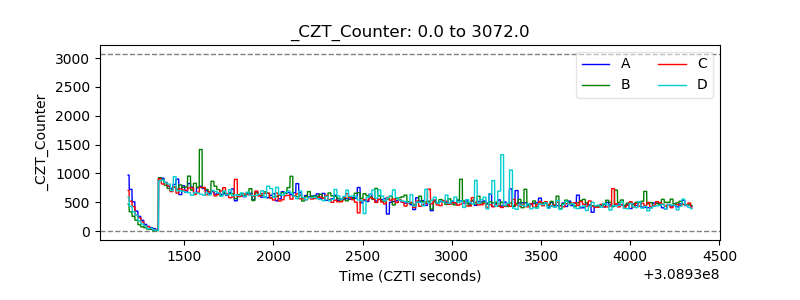 |
| +2.5 Volts monitor |  |
| +5 Volts monitor |  |
| _ROLL_ROT | 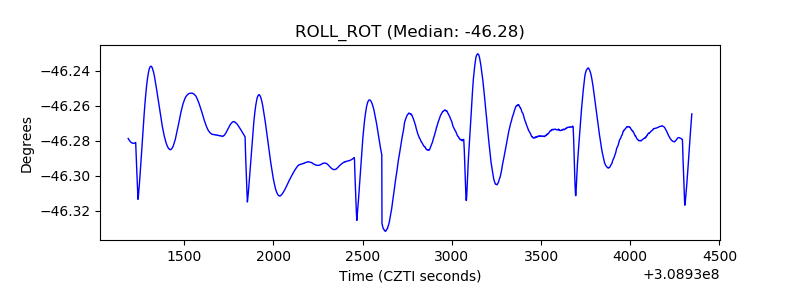 |
| _Roll_DEC | 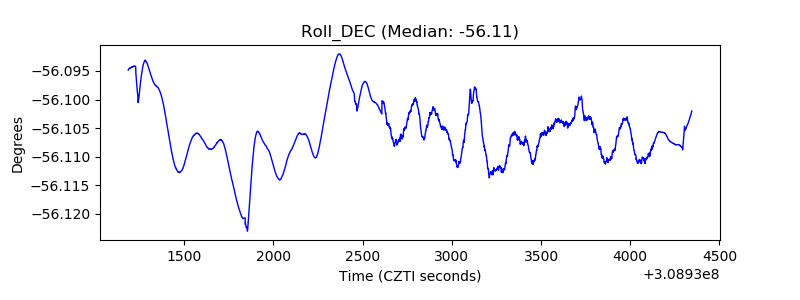 |
| _Roll_RA | 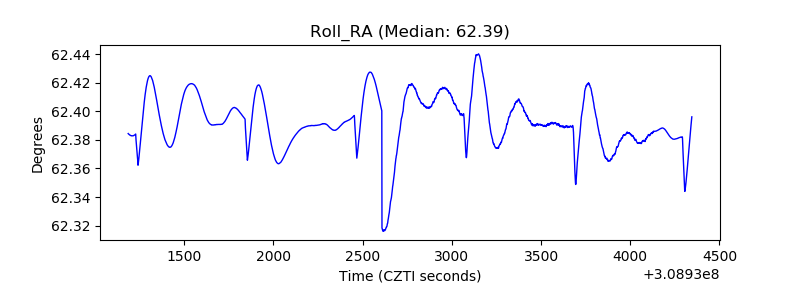 |
| Veto Counter | 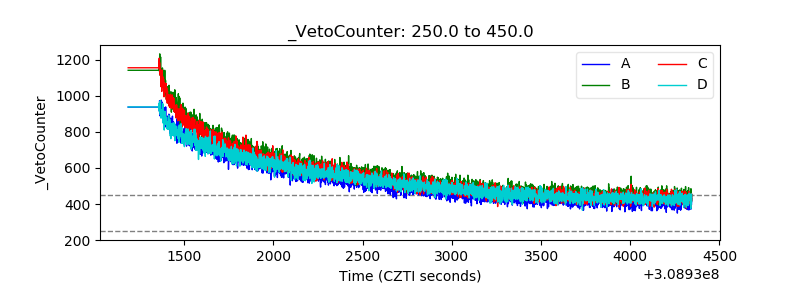 |