| Param | Original file | Final file |
|---|---|---|
| Filename | modeM0/AS1A07_010T05_9000003236_22078cztM0_level2.evt | modeM0/AS1A07_010T05_9000003236_22078cztM0_level2_quad_clean.evt |
| Size (bytes) | 320,878,080 | 50,627,520 |
| Size | 306.0 MB | 48.3 MB |
| Events in quadrant A | 1,750,109 | 324,097 |
| Events in quadrant B | 1,843,840 | 327,414 |
| Events in quadrant C | 1,917,799 | 307,203 |
| Events in quadrant D | 3,929,327 | 287,641 |
| Mode M0 | |||
|---|---|---|---|
| Quadrant | BADHDUFLAG | Total packets | Discarded packets |
| A | 0 | 8528 | 392 |
| B | 0 | 8695 | 430 |
| C | 0 | 8936 | 411 |
| D | 0 | 15522 | 1012 |
| Mode SS | |||
|---|---|---|---|
| Quadrant | BADHDUFLAG | Total packets | Discarded packets |
| A | 0 | 86 | 4 |
| B | 0 | 85 | 3 |
| C | 0 | 86 | 6 |
| D | 0 | 86 | 2 |
| Quadrant | Total seconds | Saturated seconds | Saturation percentage |
|---|---|---|---|
| A | 4065 | 0 | 0.000000% |
| B | 4065 | 2 | 0.049200% |
| C | 4055 | 30 | 0.739827% |
| D | 4040 | 252 | 6.237624% |
Noise dominated data is calculated using 1-second bins in cleaned event files. If a bin has >2000 counts, and if more than 50% of those come from <1% of pixels, then it is considered to be noise-dominated and hence unusable.
| Quadrant | # 1 sec bins | Bins with >0 counts | Bins with >2000 counts | High rate bins dominated by noise | Noise dominated (total time) | Noise dominated (detector-on time) | Marked lightcurve |
|---|---|---|---|---|---|---|---|
| A | 4224 | 4104 | 0 | 0 | 0.00% | 0.00% | 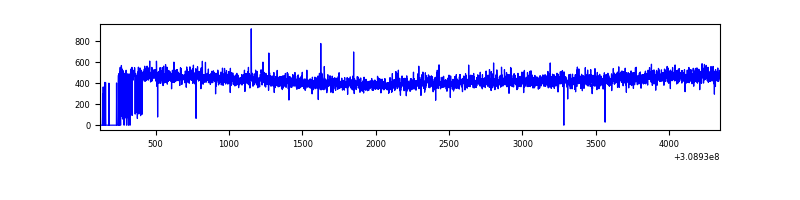 |
| B | 4226 | 4095 | 1 | 1 | 0.02% | 0.02% | 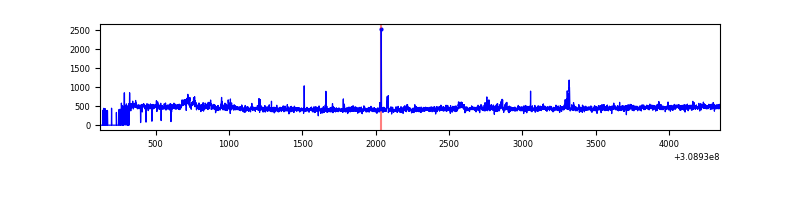 |
| C | 4187 | 4090 | 13 | 13 | 0.31% | 0.32% | 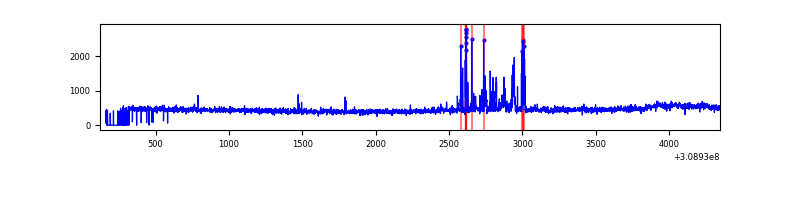 |
| D | 4144 | 4073 | 253 | 253 | 6.11% | 6.21% | 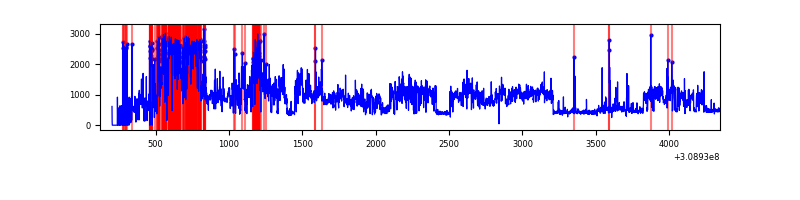 |
Top three noisy pixels from each quadrant. If the there are fewer than three noisy pixels in the level2.evt file, extra rows are filled as -1
| Pixel properties | Quadrant properties | ||||||
|---|---|---|---|---|---|---|---|
| Quadrant | DetID | PixID | Counts | Sigma | Mean | Median | Sigma |
| A | 13 | 254 | 6790 | 68.53 | 452 | 443 | 92.6 |
| A | 0 | 226 | 3894 | 37.26 | 452 | 443 | 92.6 |
| A | 3 | 137 | 3847 | 36.76 | 452 | 443 | 92.6 |
| B | 3 | 64 | 23581 | 268.01 | 454 | 442 | 86.3 |
| B | 0 | 230 | 15490 | 174.3 | 454 | 442 | 86.3 |
| B | 6 | 36 | 11495 | 128.02 | 454 | 442 | 86.3 |
| C | 9 | 54 | 134039 | 1305.41 | 433 | 435 | 102.3 |
| C | 14 | 238 | 69317 | 673.03 | 433 | 435 | 102.3 |
| C | 10 | 91 | 26446 | 254.15 | 433 | 435 | 102.3 |
| D | 1 | 52 | 2017492 | 19757.06 | 423 | 411 | 102.1 |
| D | 5 | 222 | 79874 | 778.33 | 423 | 411 | 102.1 |
| D | 7 | 223 | 71620 | 697.48 | 423 | 411 | 102.1 |
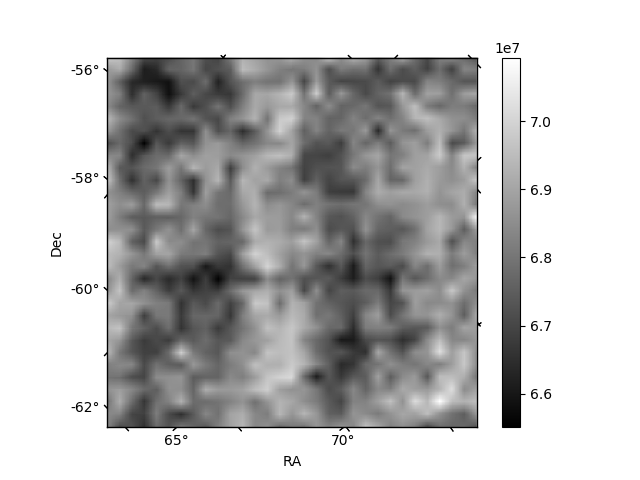
Histogram calculated using DETX and DETY for each event in the final _common_clean file
| Quadrant A | 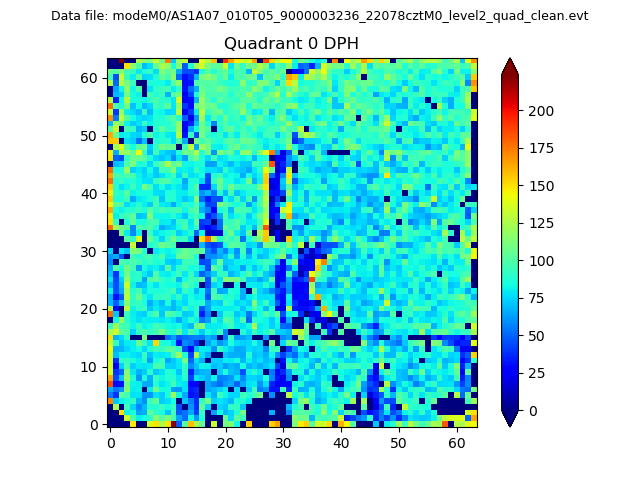 |
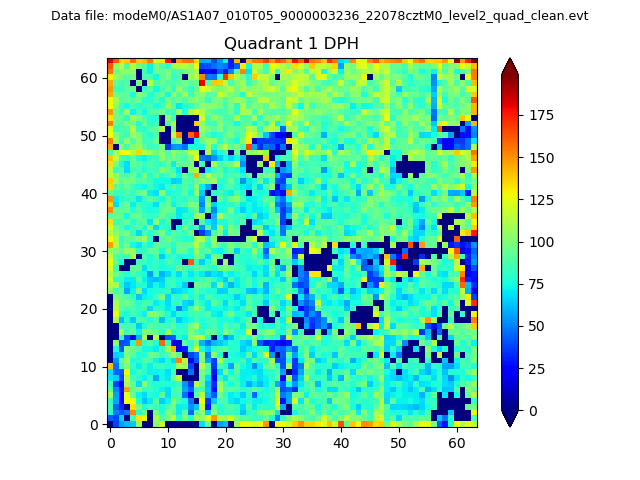 |
Quadrant B |
|---|---|---|---|
| Quadrant D | 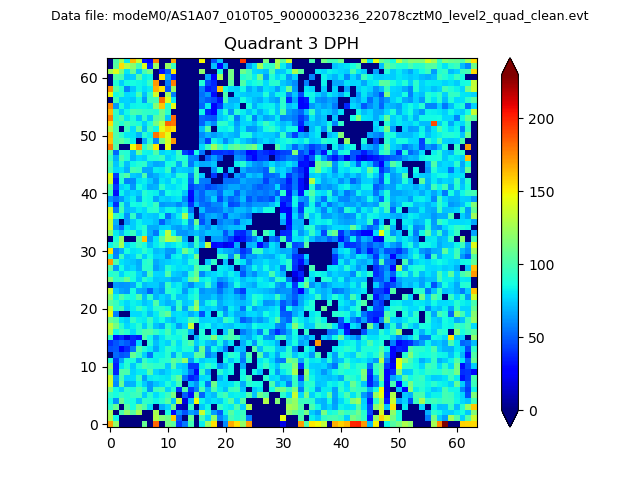 |
 |
Quadrant C |
| Plot type | Count rate plots | Images |
|---|---|---|
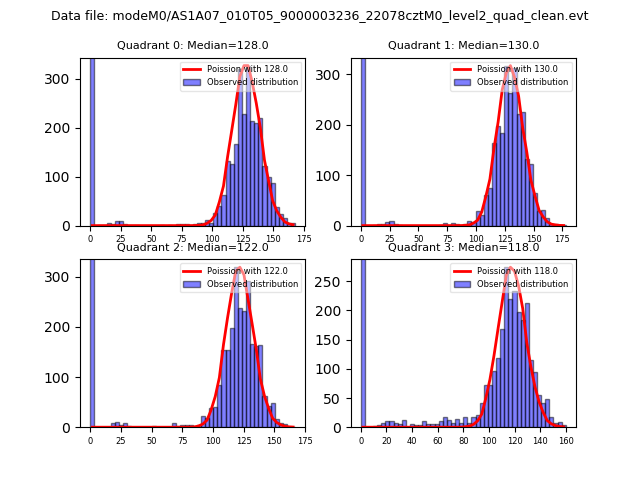
| Comparison with Poisson distribution Blue bars denote a histogram of data divided into 1 sec bins. Red curve is a Poisson curve with rate = median count rate of data. |
 |
 |
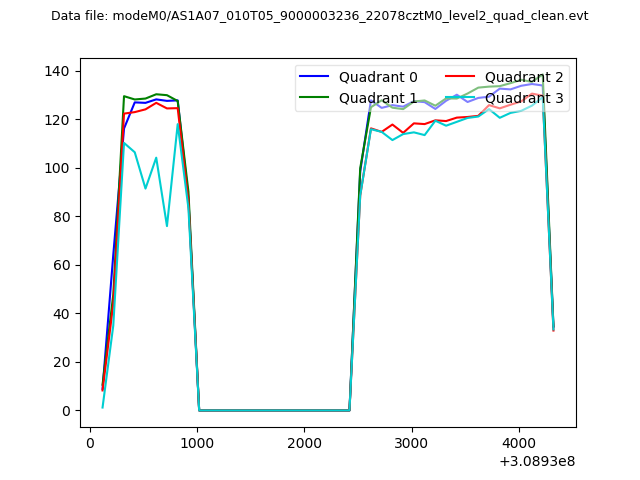
| Quadrant-wise count rates Data is divided into 100 sec bins |
 |
|
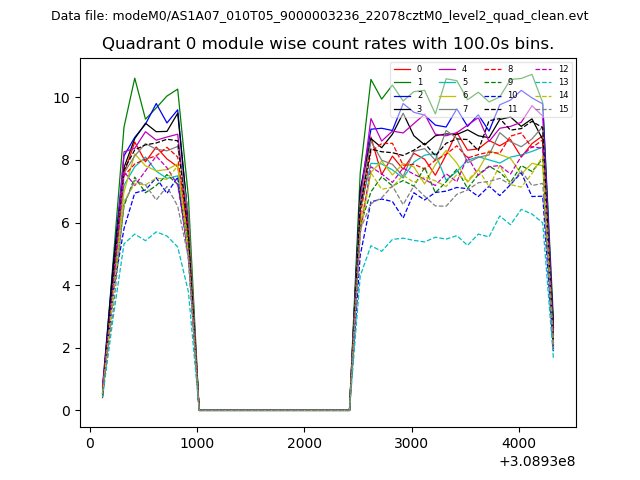
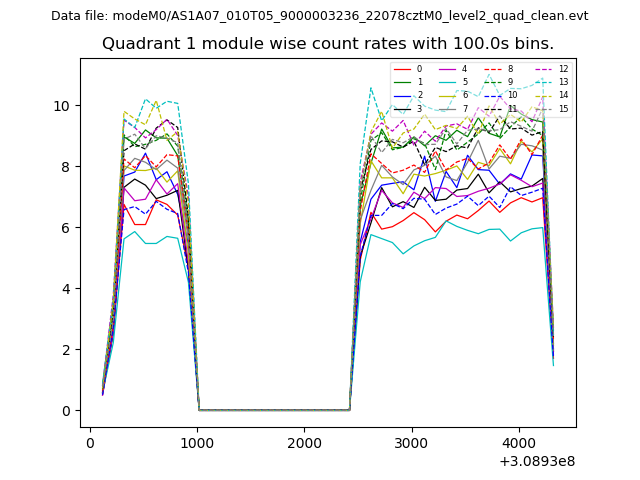
| Module-wise count rates for Quadrant A Data is divided into 100 sec bins |
 |
 |
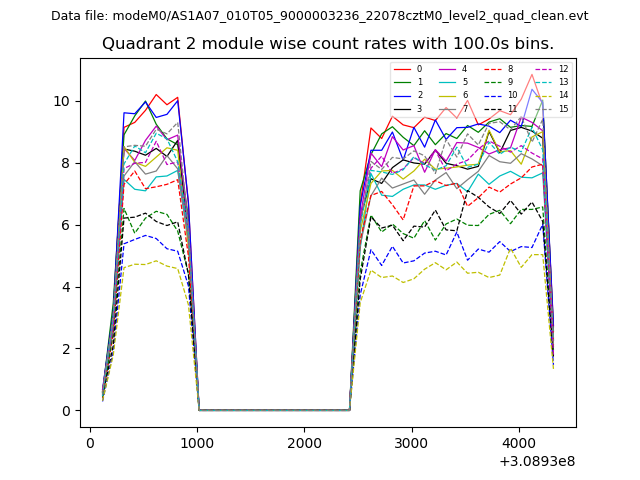
| Module-wise count rates for Quadrant B Data is divided into 100 sec bins |
 |
 |
| Module-wise count rates for Quadrant C Data is divided into 100 sec bins |
 |
 |
| Module-wise count rates for Quadrant D Data is divided into 100 sec bins |
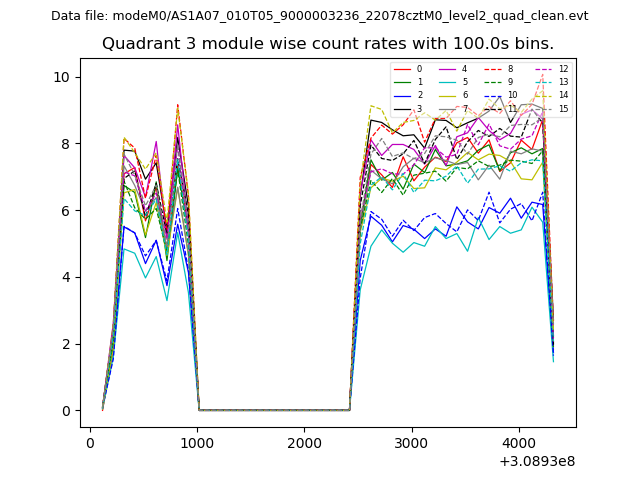 |
 |
| Parameter | Plot |
|---|---|
| CZT HV Monitor | 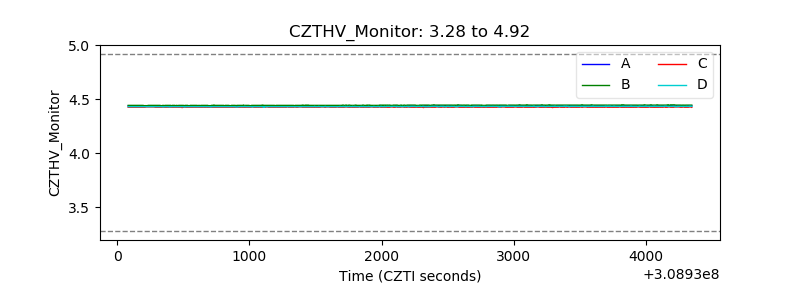 |
| D_VDD |  |
| Temperature 1 | 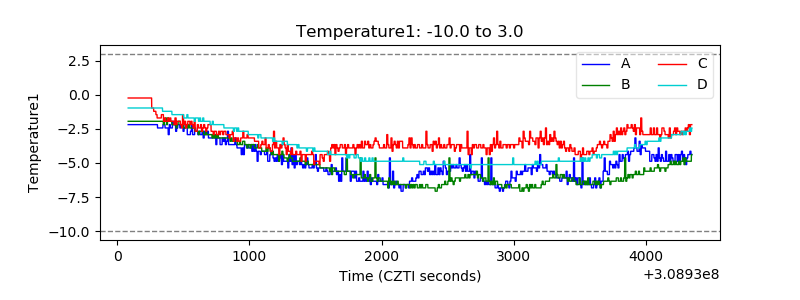 |
| Veto HV Monitor |  |
| Veto LLD | 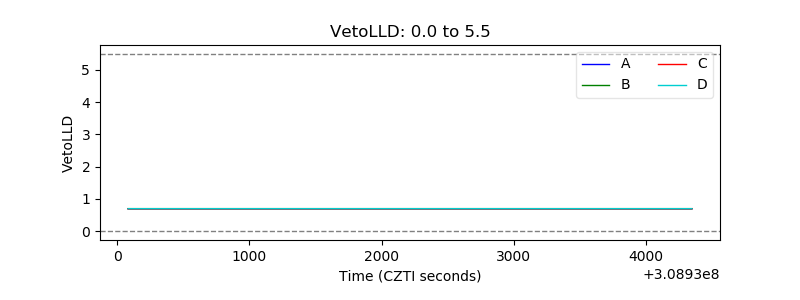 |
| Alpha Counter | 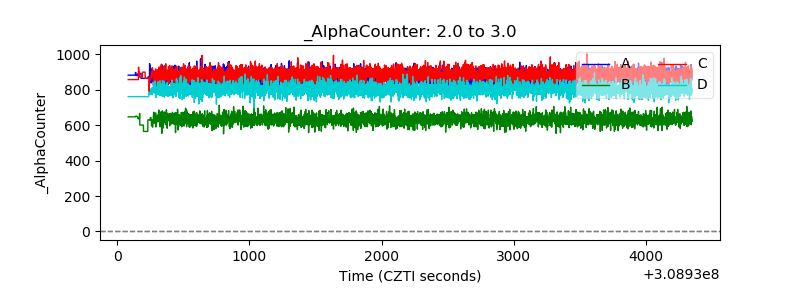 |
| _CPM_Rate | 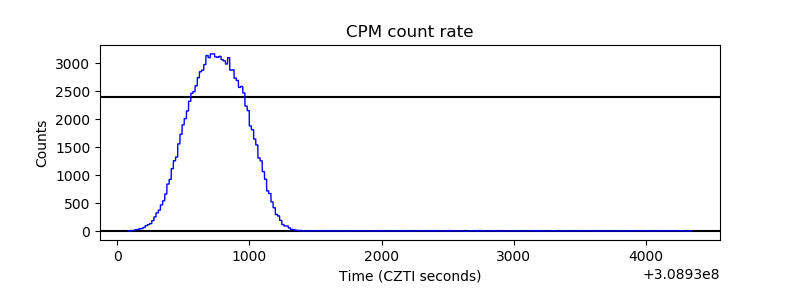 |
| CZT Counter |  |
| +2.5 Volts monitor |  |
| +5 Volts monitor |  |
| _ROLL_ROT | 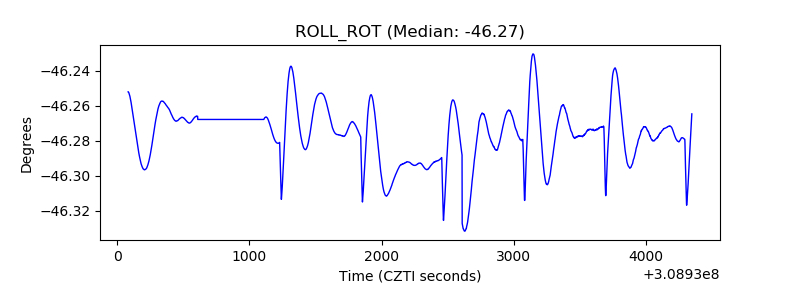 |
| _Roll_DEC | 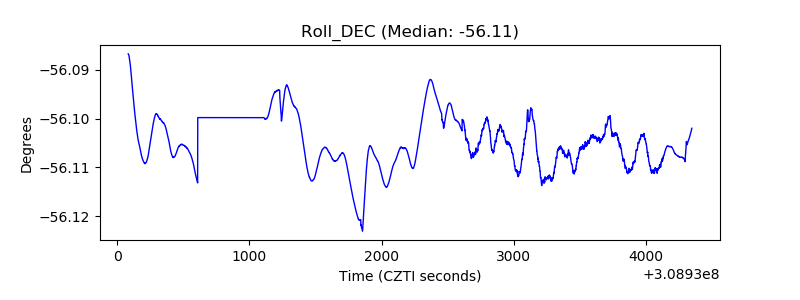 |
| _Roll_RA | 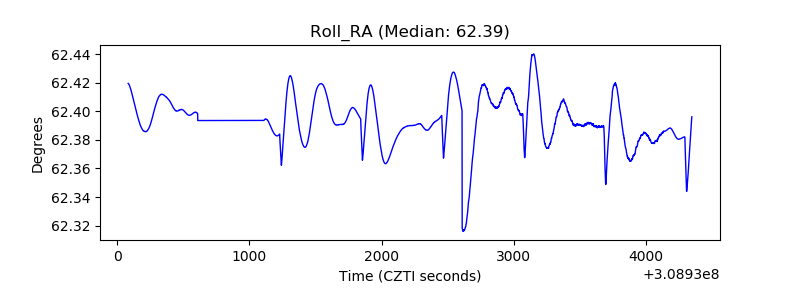 |
| Veto Counter | 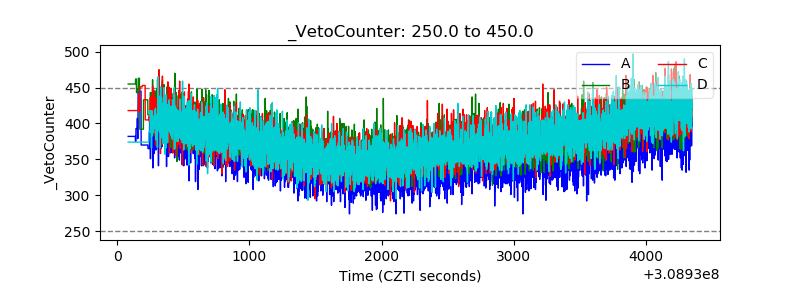 |