| Param | Original file | Final file |
|---|---|---|
| Filename | modeM0/AS1A07_010T06_9000003238_21901cztM0_level2.evt | modeM0/AS1A07_010T06_9000003238_21901cztM0_level2_quad_clean.evt |
| Size (bytes) | 725,702,400 | 117,820,800 |
| Size | 692.1 MB | 112.4 MB |
| Events in quadrant A | 3,297,271 | 849,014 |
| Events in quadrant B | 3,403,514 | 872,676 |
| Events in quadrant C | 5,027,466 | 748,678 |
| Events in quadrant D | 9,817,320 | 651,064 |
| Mode SS | |||
|---|---|---|---|
| Quadrant | BADHDUFLAG | Total packets | Discarded packets |
| A | 0 | 132 | 0 |
| B | 0 | 132 | 0 |
| C | 0 | 132 | 0 |
| D | 0 | 132 | 0 |
| Mode M0 | |||
|---|---|---|---|
| Quadrant | BADHDUFLAG | Total packets | Discarded packets |
| A | 0 | 13880 | 2 |
| B | 0 | 14138 | 2 |
| C | 0 | 18978 | 2 |
| D | 0 | 33525 | 2 |
| Mode M9 | |||
|---|---|---|---|
| Quadrant | BADHDUFLAG | Total packets | Discarded packets |
| A | 0 | 27 | 0 |
| B | 0 | 27 | 0 |
| C | 0 | 27 | 0 |
| D | 0 | 27 | 0 |
| Quadrant | Total seconds | Saturated seconds | Saturation percentage |
|---|---|---|---|
| A | 6387 | 129 | 2.019728% |
| B | 6388 | 139 | 2.175955% |
| C | 6388 | 848 | 13.274890% |
| D | 6388 | 2565 | 40.153413% |
Noise dominated data is calculated using 1-second bins in cleaned event files. If a bin has >2000 counts, and if more than 50% of those come from <1% of pixels, then it is considered to be noise-dominated and hence unusable.
| Quadrant | # 1 sec bins | Bins with >0 counts | Bins with >2000 counts | High rate bins dominated by noise | Noise dominated (total time) | Noise dominated (detector-on time) | Marked lightcurve |
|---|---|---|---|---|---|---|---|
| A | 9062 | 6387 | 1 | 1 | 0.01% | 0.02% | 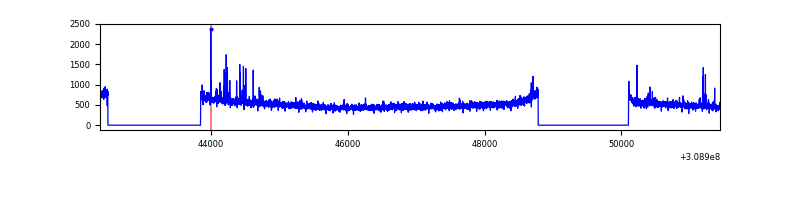 |
| B | 9063 | 6389 | 5 | 5 | 0.06% | 0.08% | 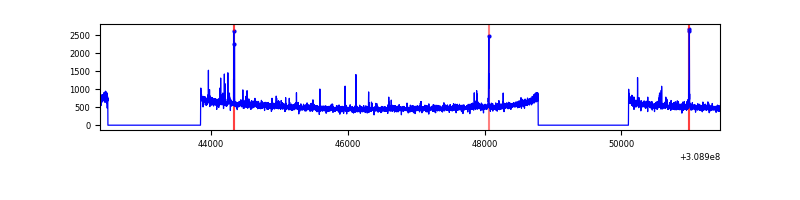 |
| C | 9063 | 6389 | 650 | 650 | 7.17% | 10.17% | 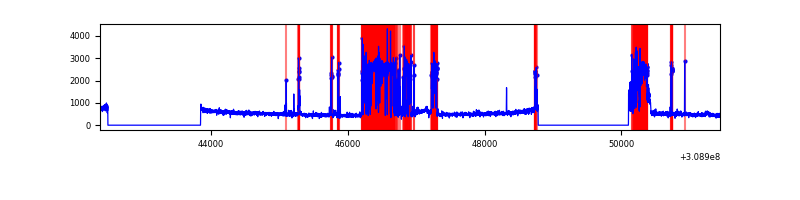 |
| D | 9063 | 6388 | 2486 | 2486 | 27.43% | 38.92% | 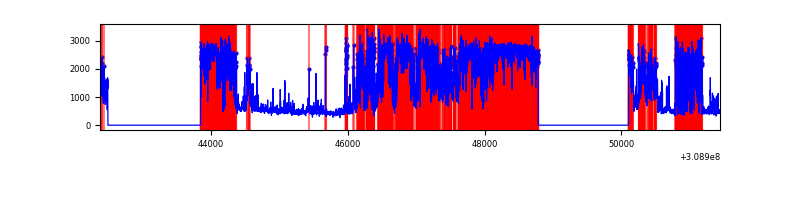 |
Top three noisy pixels from each quadrant. If the there are fewer than three noisy pixels in the level2.evt file, extra rows are filled as -1
| Pixel properties | Quadrant properties | ||||||
|---|---|---|---|---|---|---|---|
| Quadrant | DetID | PixID | Counts | Sigma | Mean | Median | Sigma |
| A | 4 | 2 | 36204 | 214.33 | 836 | 824 | 165.1 |
| A | 5 | 16 | 36016 | 213.19 | 836 | 824 | 165.1 |
| A | 13 | 254 | 11243 | 63.12 | 836 | 824 | 165.1 |
| B | 3 | 64 | 44084 | 280.54 | 841 | 821 | 154.2 |
| B | 12 | 111 | 17615 | 108.9 | 841 | 821 | 154.2 |
| B | 0 | 190 | 16823 | 103.77 | 841 | 821 | 154.2 |
| C | 10 | 22 | 1988942 | 11627.61 | 745 | 752 | 171.0 |
| C | 14 | 238 | 120175 | 698.43 | 745 | 752 | 171.0 |
| C | 0 | 10 | 6648 | 34.48 | 745 | 752 | 171.0 |
| D | 7 | 238 | 7222143 | 46673.91 | 642 | 625 | 154.7 |
| D | 2 | 136 | 45293 | 288.7 | 642 | 625 | 154.7 |
| D | 0 | 11 | 44820 | 285.64 | 642 | 625 | 154.7 |
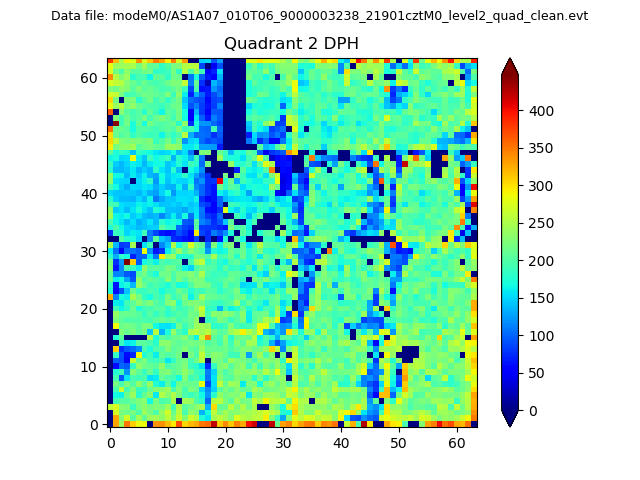
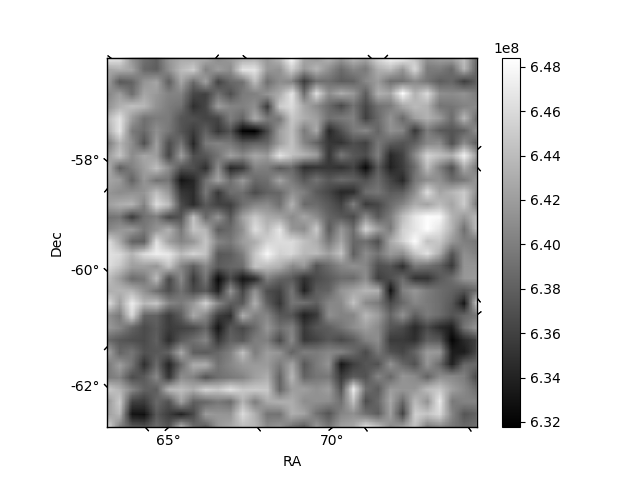
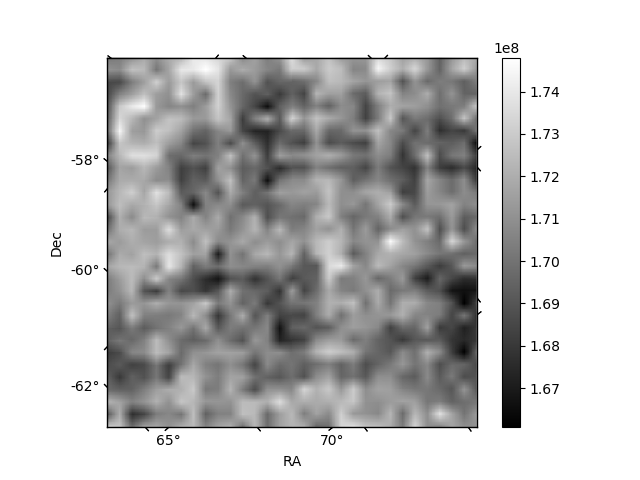
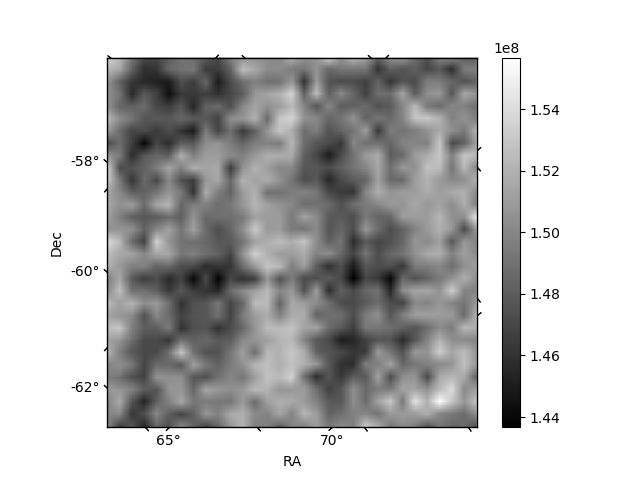
Histogram calculated using DETX and DETY for each event in the final _common_clean file
| Quadrant A | 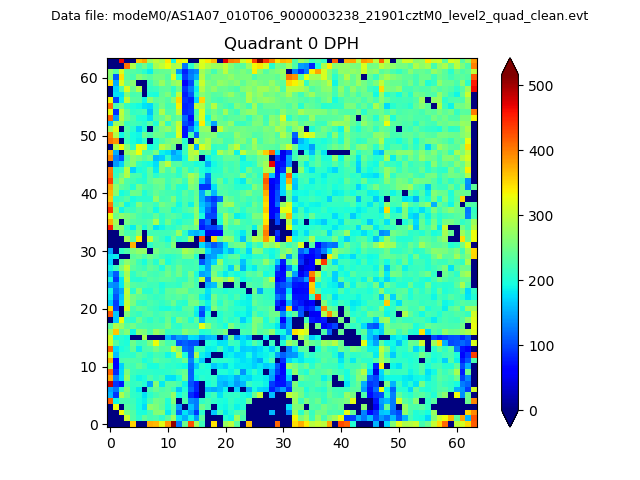 |
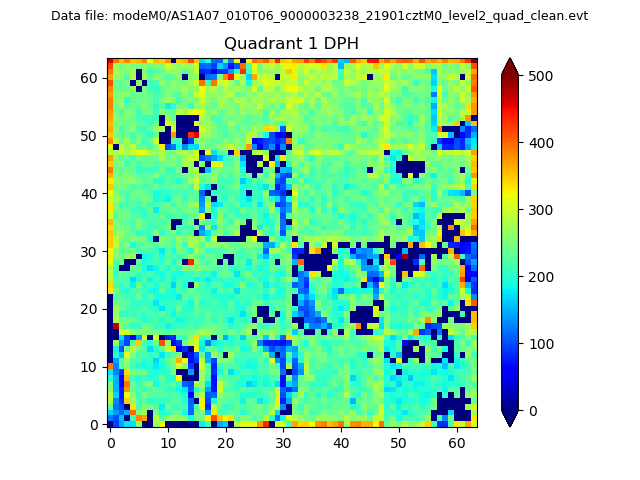 |
Quadrant B |
|---|---|---|---|
| Quadrant D | 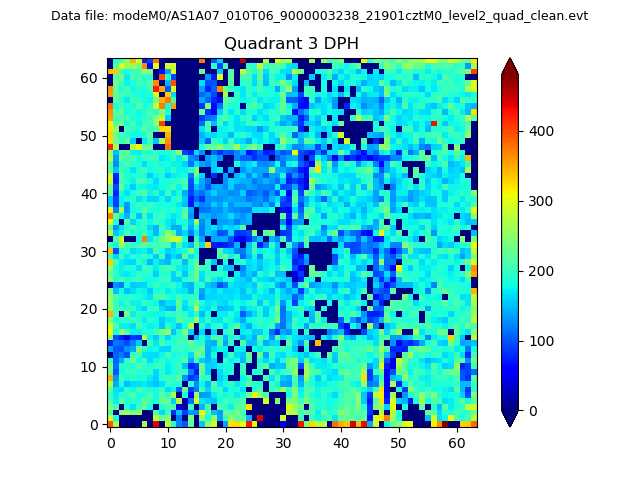 |
 |
Quadrant C |
| Plot type | Count rate plots | Images |
|---|---|---|
| Comparison with Poisson distribution Blue bars denote a histogram of data divided into 1 sec bins. Red curve is a Poisson curve with rate = median count rate of data. |
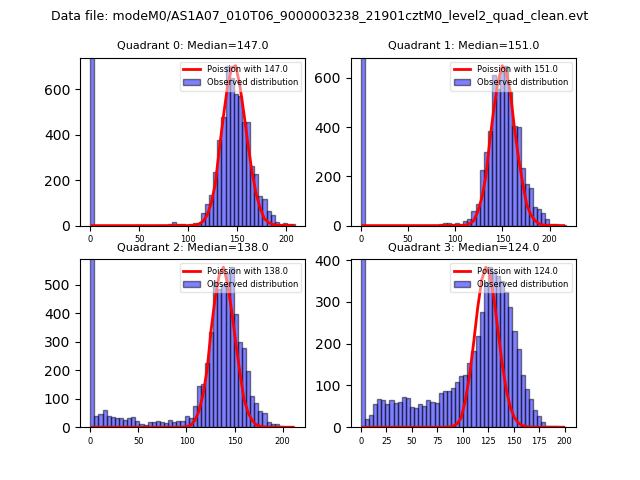 |
 |
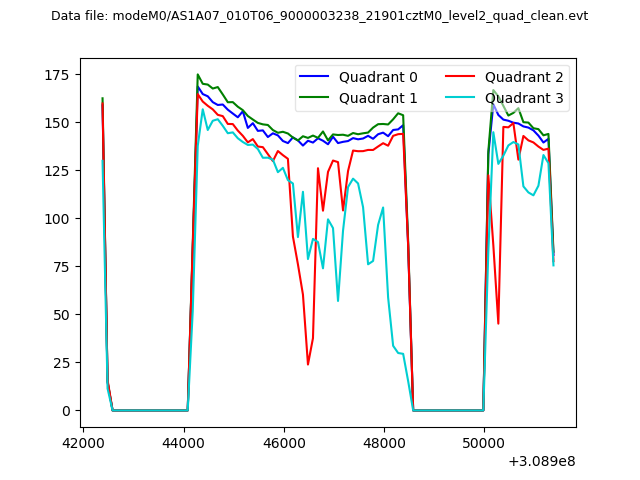
| Quadrant-wise count rates Data is divided into 100 sec bins |
 |
|
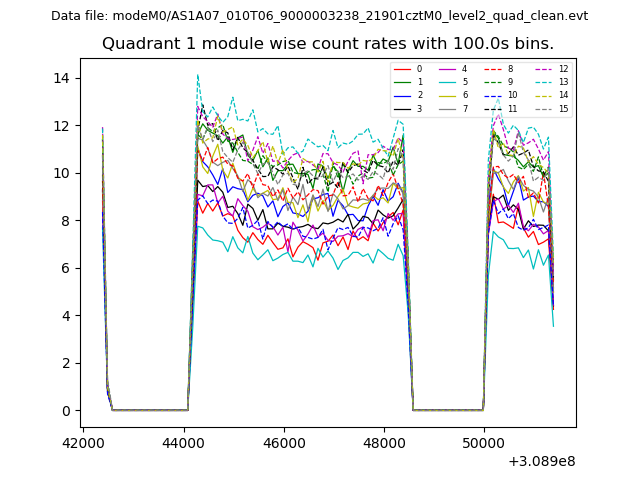
| Module-wise count rates for Quadrant A Data is divided into 100 sec bins |
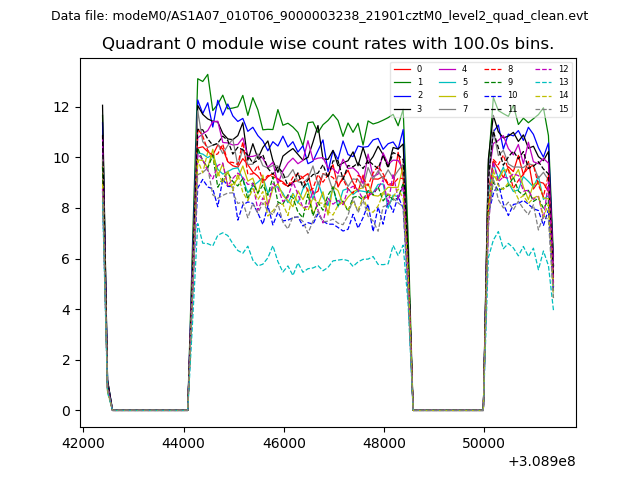 |
 |
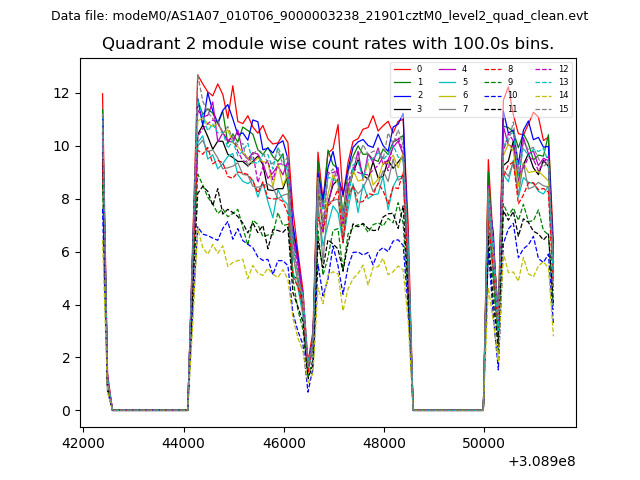
| Module-wise count rates for Quadrant B Data is divided into 100 sec bins |
 |
 |
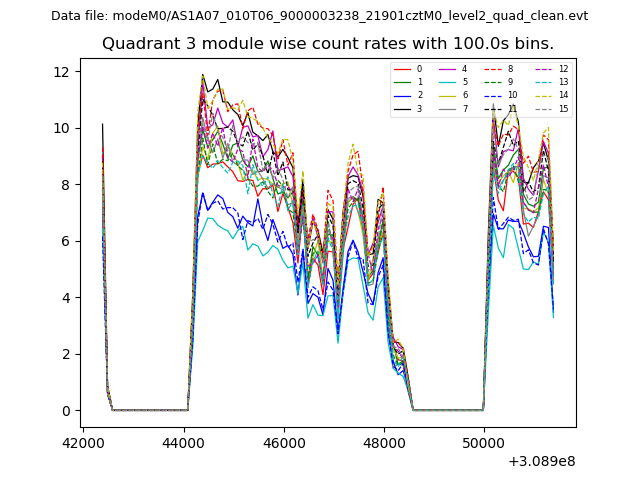
| Module-wise count rates for Quadrant C Data is divided into 100 sec bins |
 |
 |
| Module-wise count rates for Quadrant D Data is divided into 100 sec bins |
 |
 |
| Parameter | Plot |
|---|---|
| CZT HV Monitor | 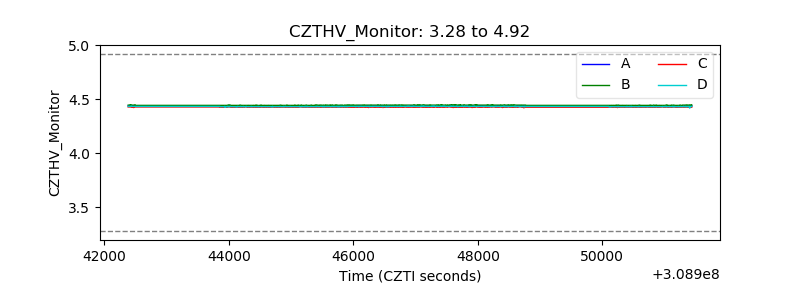 |
| D_VDD | 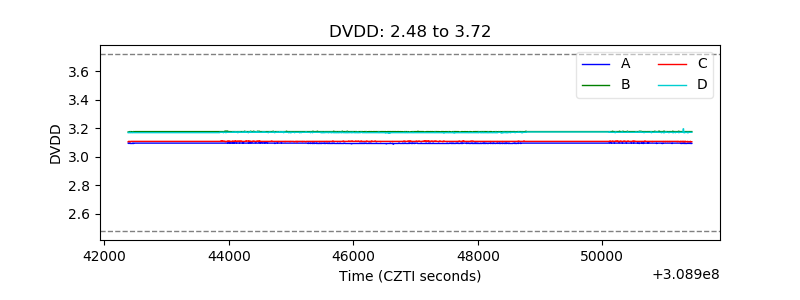 |
| Temperature 1 | 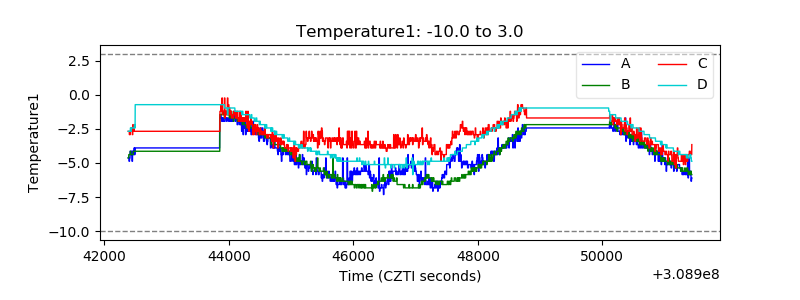 |
| Veto HV Monitor | 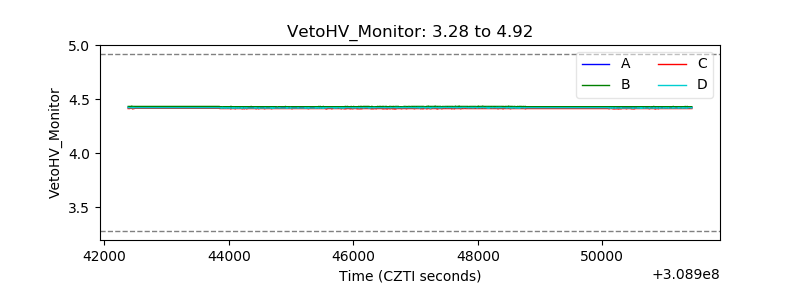 |
| Veto LLD | 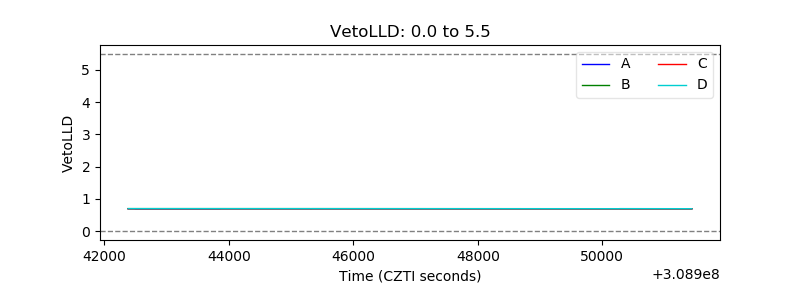 |
| Alpha Counter | 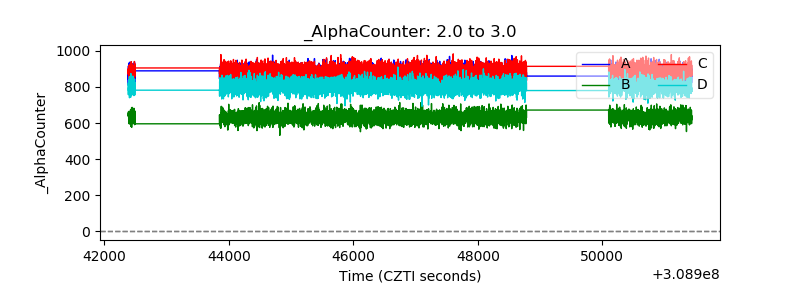 |
| _CPM_Rate | 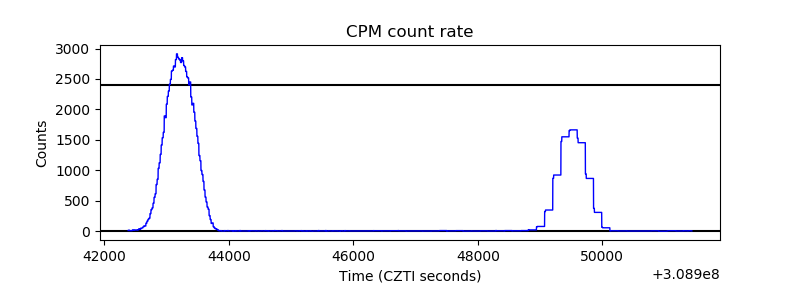 |
| CZT Counter |  |
| +2.5 Volts monitor | 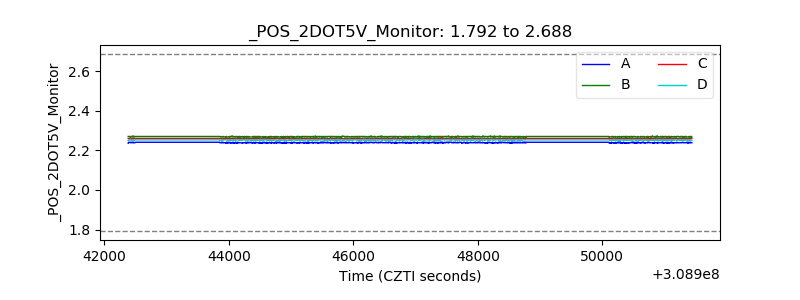 |
| +5 Volts monitor |  |
| _ROLL_ROT | 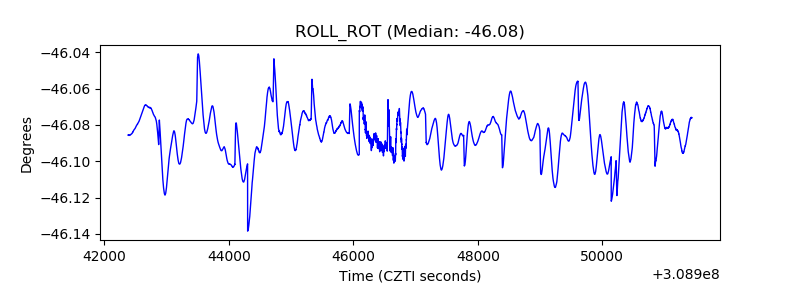 |
| _Roll_DEC | 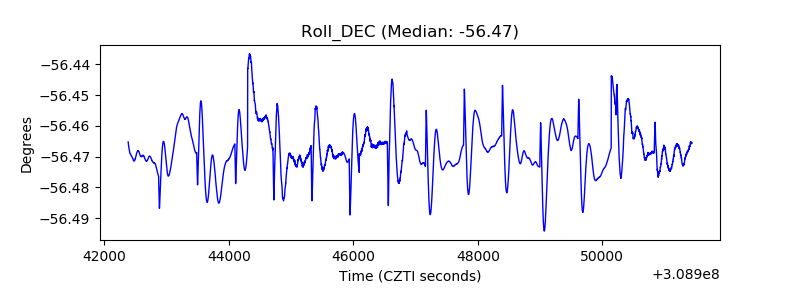 |
| _Roll_RA | 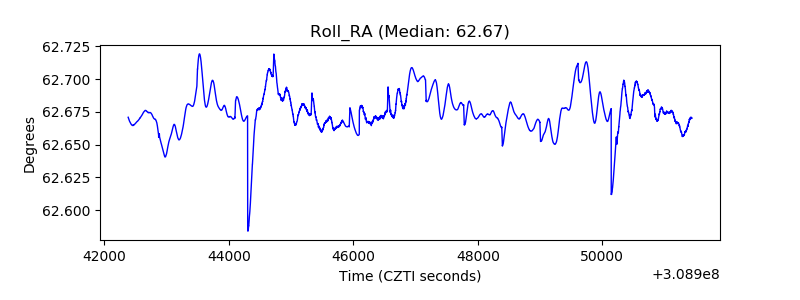 |
| Veto Counter | 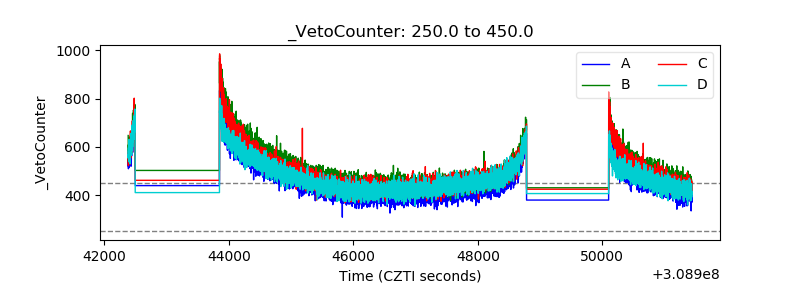 |