| Param | Original file | Final file |
|---|---|---|
| Filename | modeM0/AS1A07_010T06_9000003238_21902cztM0_level2.evt | modeM0/AS1A07_010T06_9000003238_21902cztM0_level2_quad_clean.evt |
| Size (bytes) | 641,851,200 | 113,664,960 |
| Size | 612.1 MB | 108.4 MB |
| Events in quadrant A | 3,318,109 | 781,171 |
| Events in quadrant B | 3,327,992 | 801,281 |
| Events in quadrant C | 3,586,922 | 732,914 |
| Events in quadrant D | 8,763,916 | 671,901 |
| Mode SS | |||
|---|---|---|---|
| Quadrant | BADHDUFLAG | Total packets | Discarded packets |
| A | 0 | 132 | 0 |
| B | 0 | 132 | 0 |
| C | 0 | 132 | 0 |
| D | 0 | 132 | 0 |
| Mode M0 | |||
|---|---|---|---|
| Quadrant | BADHDUFLAG | Total packets | Discarded packets |
| A | 0 | 14099 | 2 |
| B | 0 | 14044 | 2 |
| C | 0 | 14835 | 2 |
| D | 0 | 30530 | 2 |
| Mode M9 | |||
|---|---|---|---|
| Quadrant | BADHDUFLAG | Total packets | Discarded packets |
| A | 0 | 19 | 0 |
| B | 0 | 20 | 0 |
| C | 0 | 20 | 0 |
| D | 0 | 20 | 0 |
| Quadrant | Total seconds | Saturated seconds | Saturation percentage |
|---|---|---|---|
| A | 6523 | 74 | 1.134447% |
| B | 6523 | 60 | 0.919822% |
| C | 6523 | 261 | 4.001226% |
| D | 6523 | 1877 | 28.775103% |
Noise dominated data is calculated using 1-second bins in cleaned event files. If a bin has >2000 counts, and if more than 50% of those come from <1% of pixels, then it is considered to be noise-dominated and hence unusable.
| Quadrant | # 1 sec bins | Bins with >0 counts | Bins with >2000 counts | High rate bins dominated by noise | Noise dominated (total time) | Noise dominated (detector-on time) | Marked lightcurve |
|---|---|---|---|---|---|---|---|
| A | 7618 | 6524 | 50 | 50 | 0.66% | 0.77% | 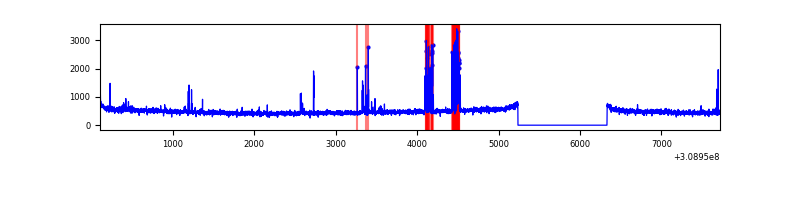 |
| B | 7618 | 6524 | 17 | 17 | 0.22% | 0.26% | 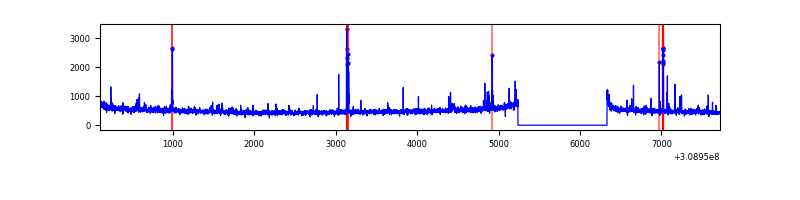 |
| C | 7618 | 6524 | 166 | 166 | 2.18% | 2.54% | 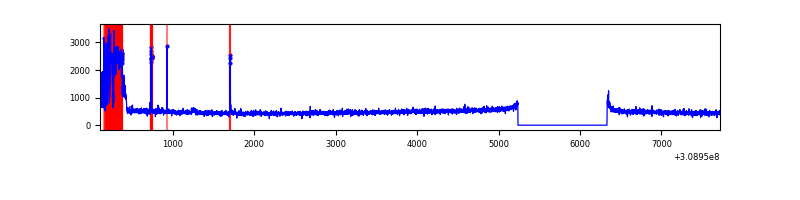 |
| D | 7618 | 6524 | 1823 | 1823 | 23.93% | 27.94% | 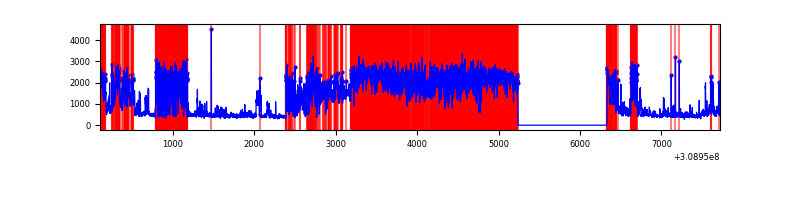 |
Top three noisy pixels from each quadrant. If the there are fewer than three noisy pixels in the level2.evt file, extra rows are filled as -1
| Pixel properties | Quadrant properties | ||||||
|---|---|---|---|---|---|---|---|
| Quadrant | DetID | PixID | Counts | Sigma | Mean | Median | Sigma |
| A | 5 | 16 | 251248 | 1579.94 | 795 | 779 | 158.5 |
| A | 13 | 254 | 12091 | 71.35 | 795 | 779 | 158.5 |
| A | 0 | 226 | 6723 | 37.49 | 795 | 779 | 158.5 |
| B | 3 | 64 | 98322 | 655.72 | 803 | 784 | 148.8 |
| B | 4 | 171 | 19189 | 123.73 | 803 | 784 | 148.8 |
| B | 0 | 197 | 17343 | 111.32 | 803 | 784 | 148.8 |
| C | 10 | 22 | 519552 | 2971.85 | 752 | 756 | 174.6 |
| C | 14 | 238 | 119143 | 678.16 | 752 | 756 | 174.6 |
| C | 0 | 10 | 12127 | 65.14 | 752 | 756 | 174.6 |
| D | 7 | 238 | 5957784 | 35263.99 | 700 | 681 | 168.9 |
| D | 1 | 52 | 45998 | 268.26 | 700 | 681 | 168.9 |
| D | 2 | 136 | 39472 | 229.63 | 700 | 681 | 168.9 |
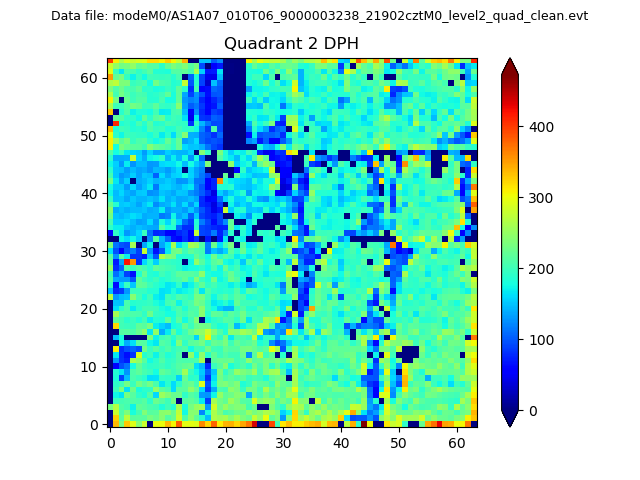
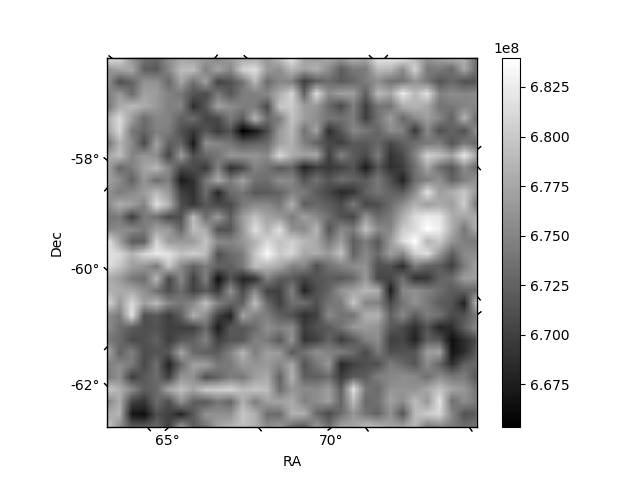
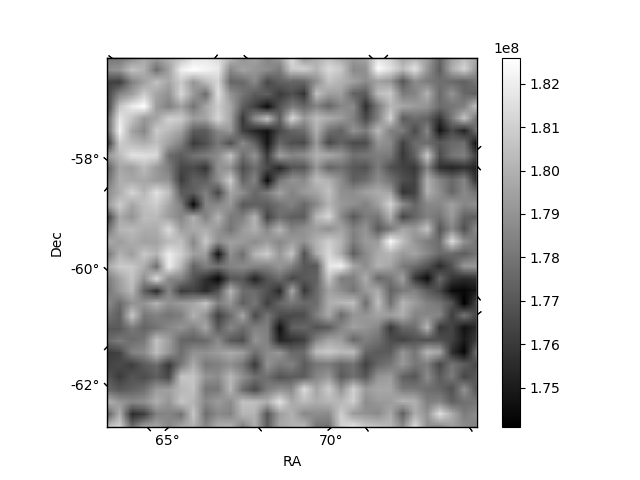
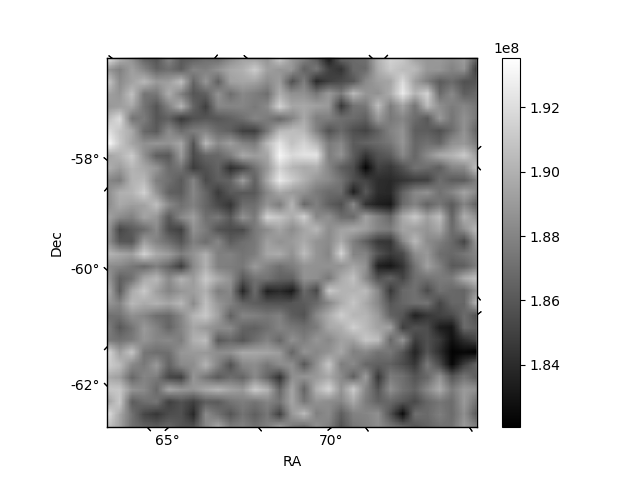
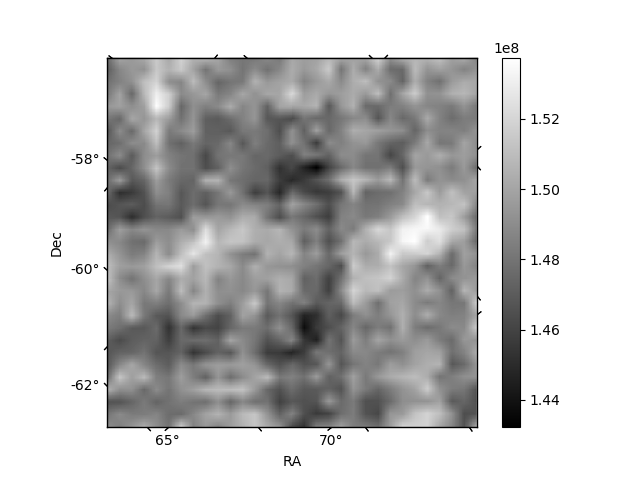
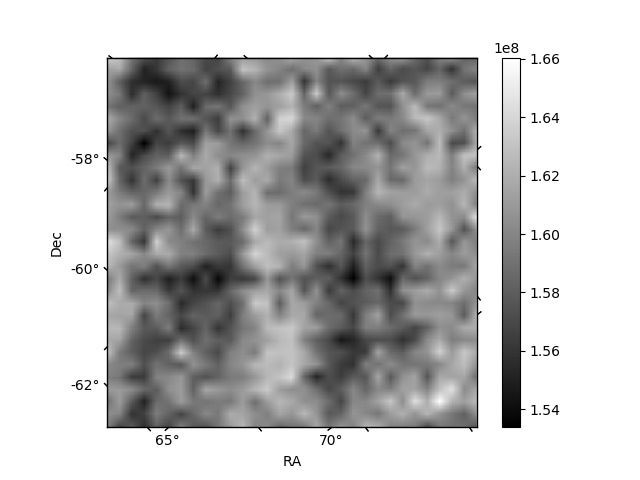
Histogram calculated using DETX and DETY for each event in the final _common_clean file
| Quadrant A | 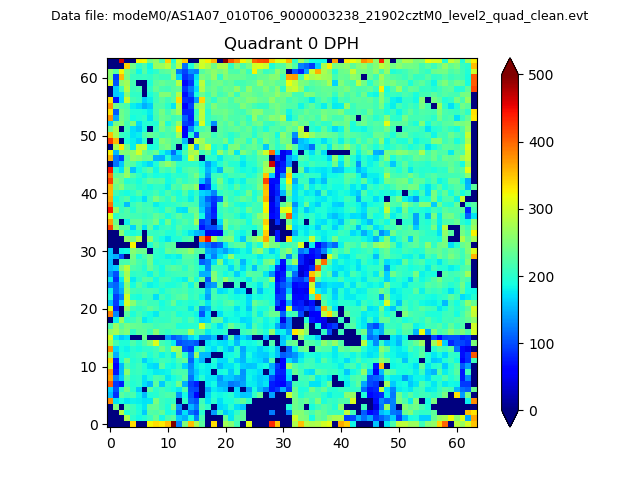 |
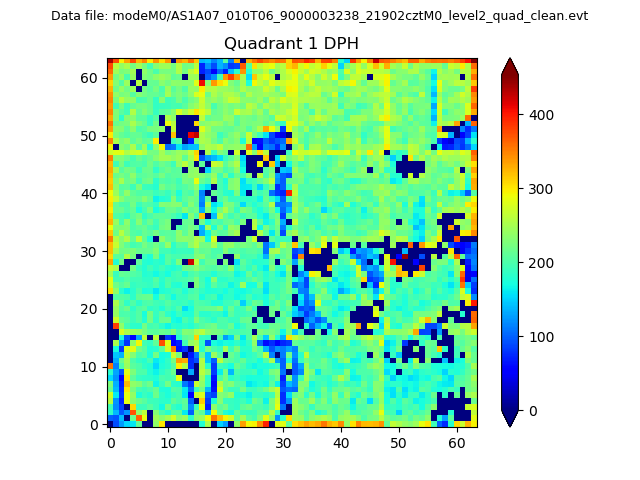 |
Quadrant B |
|---|---|---|---|
| Quadrant D | 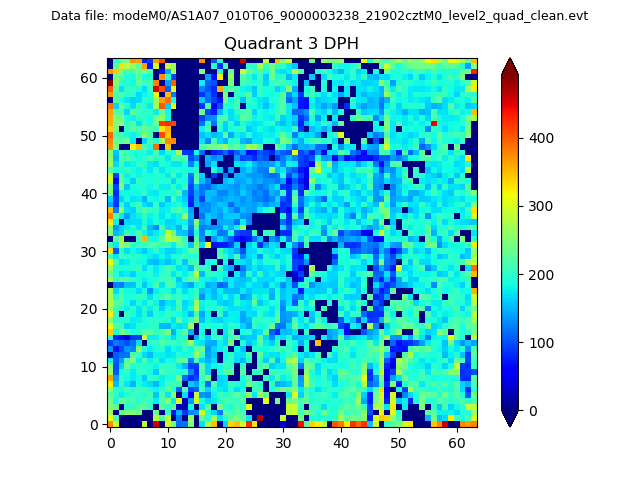 |
 |
Quadrant C |
| Plot type | Count rate plots | Images |
|---|---|---|
| Comparison with Poisson distribution Blue bars denote a histogram of data divided into 1 sec bins. Red curve is a Poisson curve with rate = median count rate of data. |
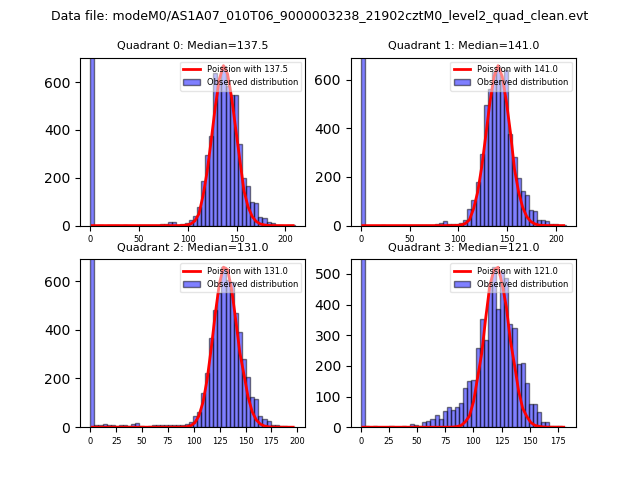 |
 |
| Quadrant-wise count rates Data is divided into 100 sec bins |
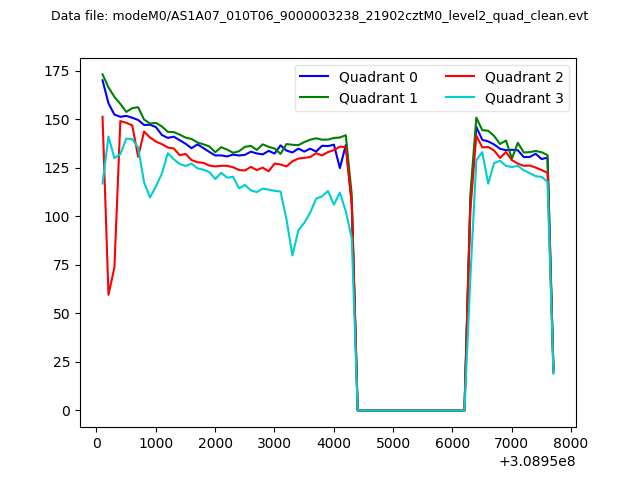 |
|
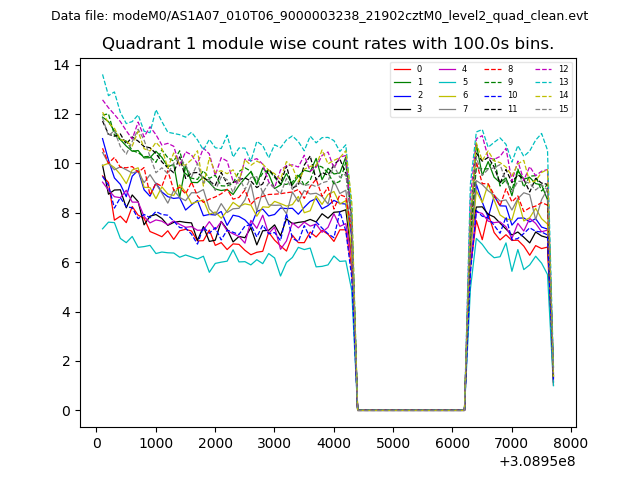
| Module-wise count rates for Quadrant A Data is divided into 100 sec bins |
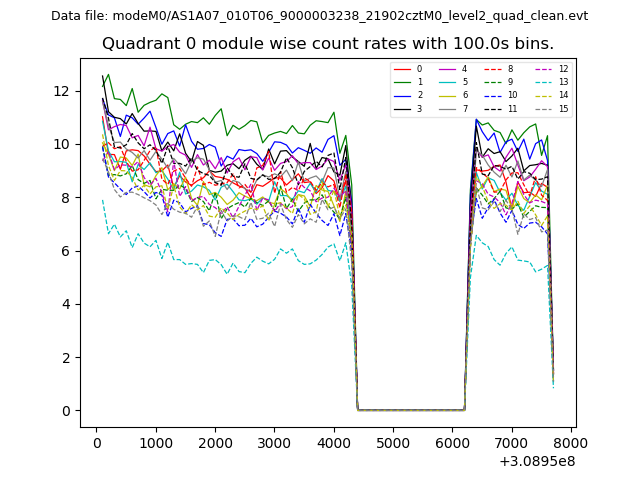 |
 |
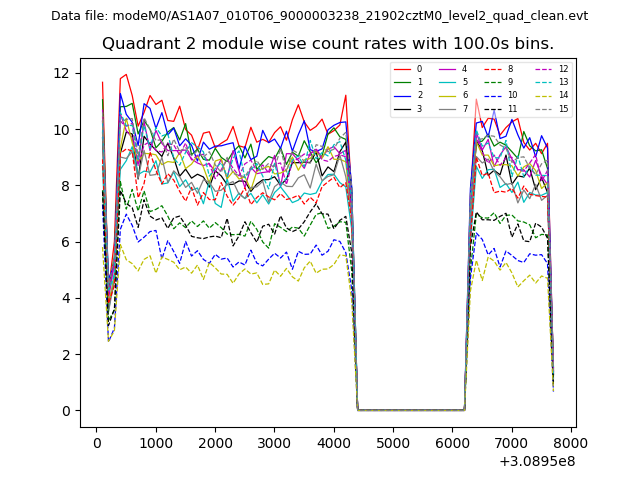
| Module-wise count rates for Quadrant B Data is divided into 100 sec bins |
 |
 |
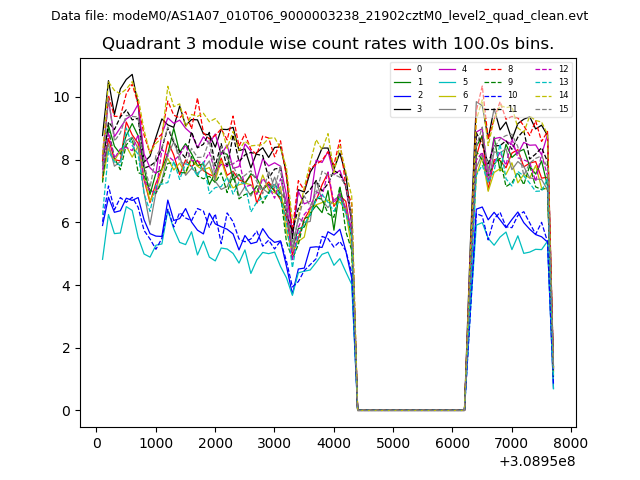
| Module-wise count rates for Quadrant C Data is divided into 100 sec bins |
 |
 |
| Module-wise count rates for Quadrant D Data is divided into 100 sec bins |
 |
 |
| Parameter | Plot |
|---|---|
| CZT HV Monitor | 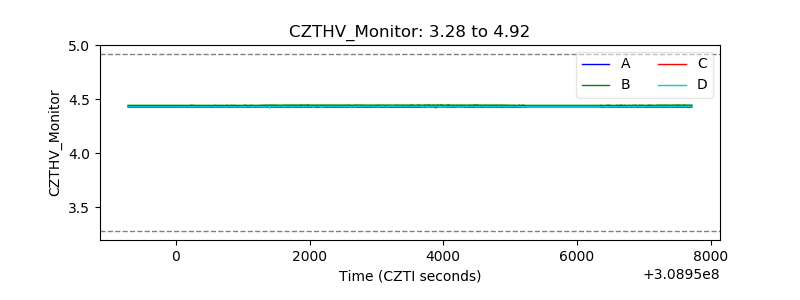 |
| D_VDD | 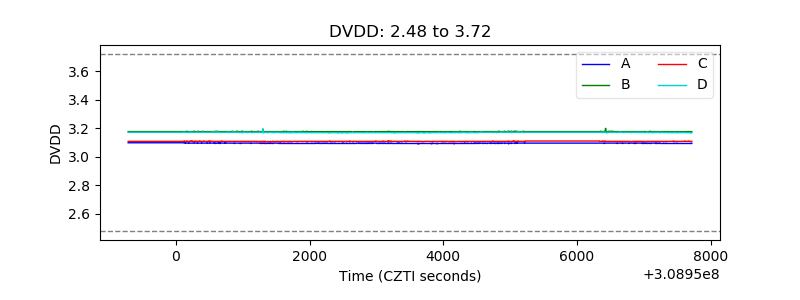 |
| Temperature 1 | 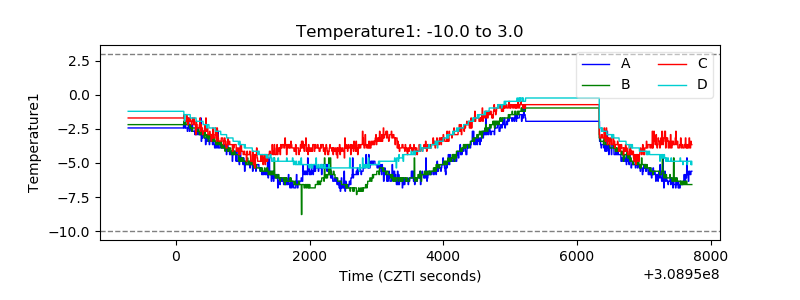 |
| Veto HV Monitor | 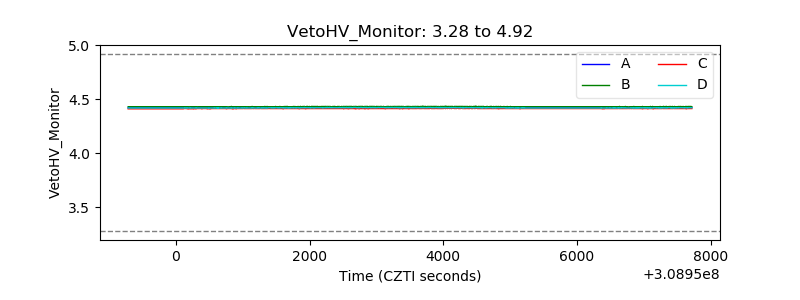 |
| Veto LLD | 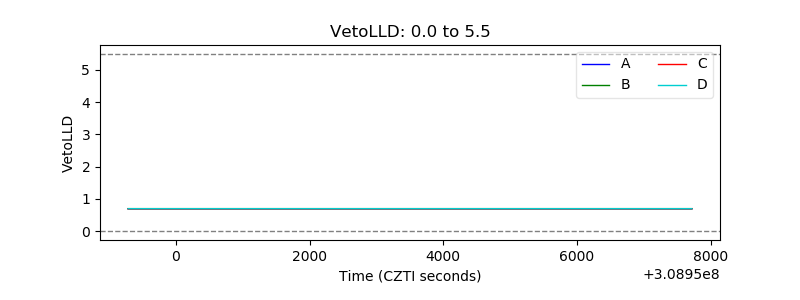 |
| Alpha Counter | 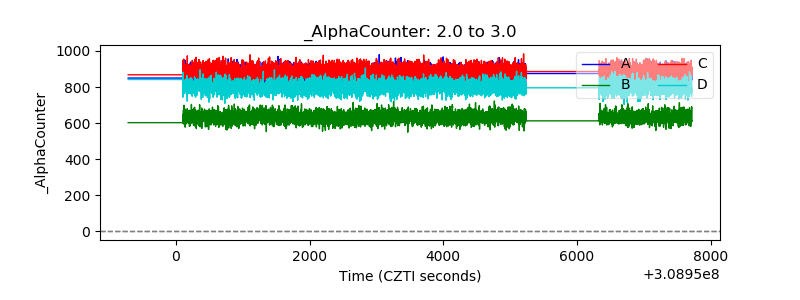 |
| _CPM_Rate | 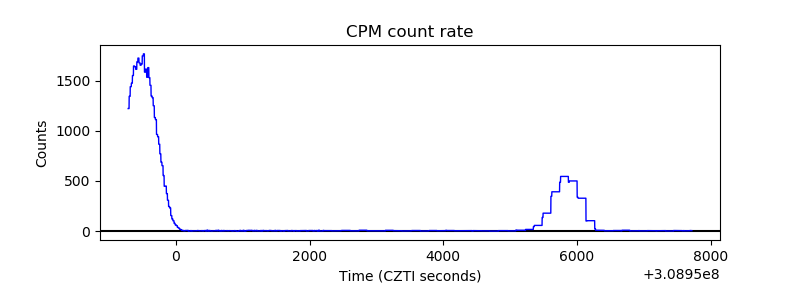 |
| CZT Counter | 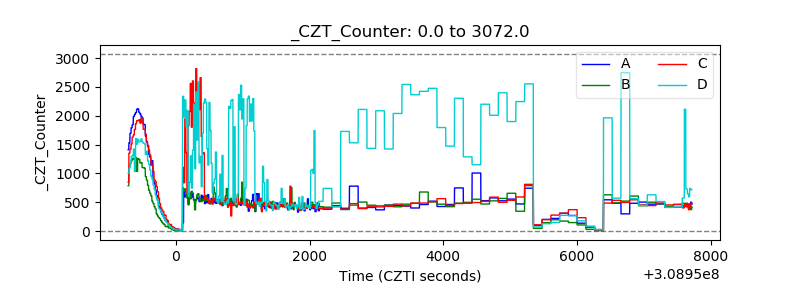 |
| +2.5 Volts monitor |  |
| +5 Volts monitor |  |
| _ROLL_ROT | 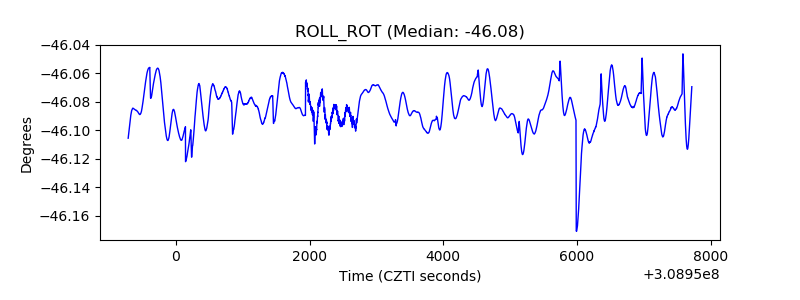 |
| _Roll_DEC | 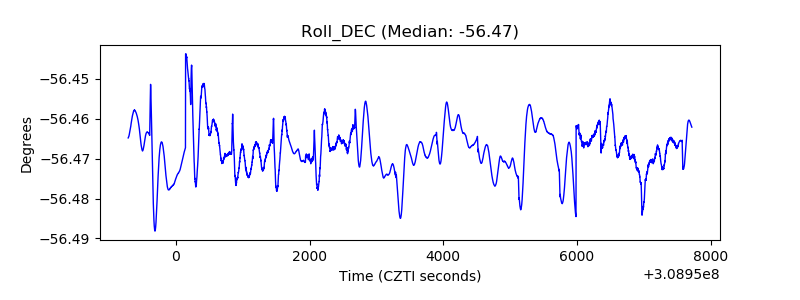 |
| _Roll_RA | 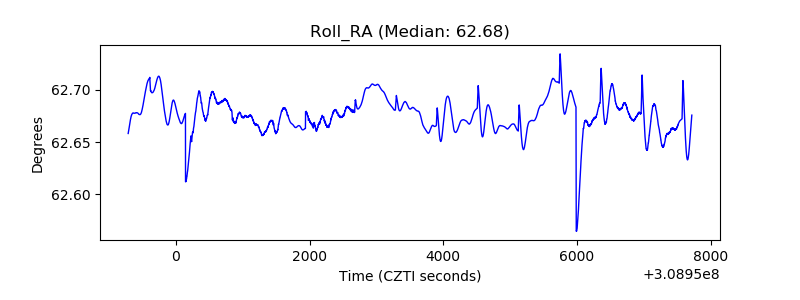 |
| Veto Counter | 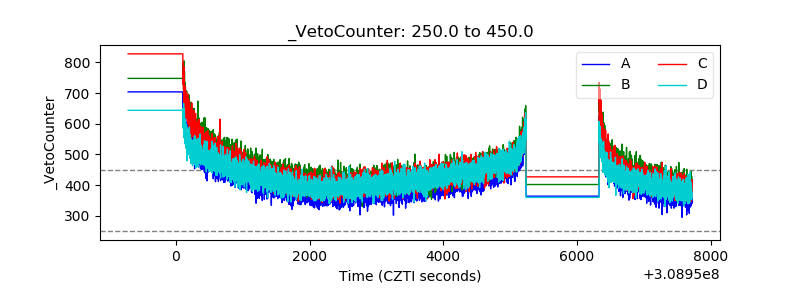 |