| Param | Original file | Final file |
|---|---|---|
| Filename | modeM0/AS1A07_010T06_9000003238_22078cztM0_level2.evt | modeM0/AS1A07_010T06_9000003238_22078cztM0_level2_quad_clean.evt |
| Size (bytes) | 186,621,120 | 39,672,000 |
| Size | 178.0 MB | 37.8 MB |
| Events in quadrant A | 1,305,046 | 254,055 |
| Events in quadrant B | 1,494,879 | 260,002 |
| Events in quadrant C | 1,302,062 | 253,192 |
| Events in quadrant D | 1,372,551 | 248,819 |
| Mode SS | |||
|---|---|---|---|
| Quadrant | BADHDUFLAG | Total packets | Discarded packets |
| A | 0 | 54 | 0 |
| B | 0 | 54 | 0 |
| C | 0 | 54 | 0 |
| D | 0 | 54 | 0 |
| Mode M0 | |||
|---|---|---|---|
| Quadrant | BADHDUFLAG | Total packets | Discarded packets |
| A | 0 | 5485 | 1 |
| B | 0 | 6082 | 1 |
| C | 0 | 5495 | 1 |
| D | 0 | 5782 | 1 |
| Mode M9 | |||
|---|---|---|---|
| Quadrant | BADHDUFLAG | Total packets | Discarded packets |
| A | 0 | 3 | 0 |
| B | 0 | 3 | 0 |
| C | 0 | 3 | 0 |
| D | 0 | 3 | 0 |
| Quadrant | Total seconds | Saturated seconds | Saturation percentage |
|---|---|---|---|
| A | 2575 | 50 | 1.941748% |
| B | 2575 | 86 | 3.339806% |
| C | 2575 | 62 | 2.407767% |
| D | 2575 | 24 | 0.932039% |
Noise dominated data is calculated using 1-second bins in cleaned event files. If a bin has >2000 counts, and if more than 50% of those come from <1% of pixels, then it is considered to be noise-dominated and hence unusable.
| Quadrant | # 1 sec bins | Bins with >0 counts | Bins with >2000 counts | High rate bins dominated by noise | Noise dominated (total time) | Noise dominated (detector-on time) | Marked lightcurve |
|---|---|---|---|---|---|---|---|
| A | 2855 | 2575 | 2 | 2 | 0.07% | 0.08% |  |
| B | 2855 | 2575 | 9 | 9 | 0.32% | 0.35% |  |
| C | 2855 | 2576 | 1 | 1 | 0.04% | 0.04% |  |
| D | 2855 | 2576 | 8 | 8 | 0.28% | 0.31% |  |
Top three noisy pixels from each quadrant. If the there are fewer than three noisy pixels in the level2.evt file, extra rows are filled as -1
| Pixel properties | Quadrant properties | ||||||
|---|---|---|---|---|---|---|---|
| Quadrant | DetID | PixID | Counts | Sigma | Mean | Median | Sigma |
| A | 15 | 174 | 5715 | 78.03 | 335 | 328 | 69.0 |
| A | 13 | 254 | 4449 | 59.69 | 335 | 328 | 69.0 |
| A | 4 | 2 | 3023 | 39.04 | 335 | 328 | 69.0 |
| B | 0 | 228 | 104934 | 1622.31 | 332 | 323 | 64.5 |
| B | 0 | 190 | 56732 | 874.79 | 332 | 323 | 64.5 |
| B | 3 | 64 | 15178 | 230.37 | 332 | 323 | 64.5 |
| C | 14 | 238 | 49780 | 663.72 | 315 | 316 | 74.5 |
| C | 9 | 54 | 13901 | 182.29 | 315 | 316 | 74.5 |
| C | 8 | 128 | 3124 | 37.68 | 315 | 316 | 74.5 |
| D | 1 | 52 | 70656 | 880.26 | 324 | 313 | 79.9 |
| D | 13 | 172 | 31315 | 387.95 | 324 | 313 | 79.9 |
| D | 2 | 234 | 11545 | 140.56 | 324 | 313 | 79.9 |
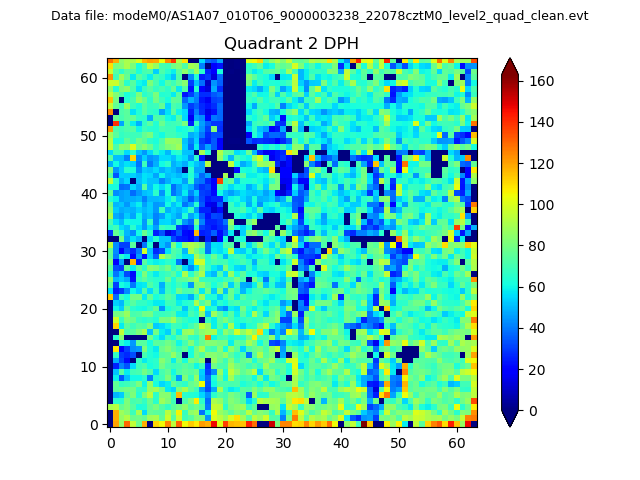
Histogram calculated using DETX and DETY for each event in the final _common_clean file
| Quadrant A | 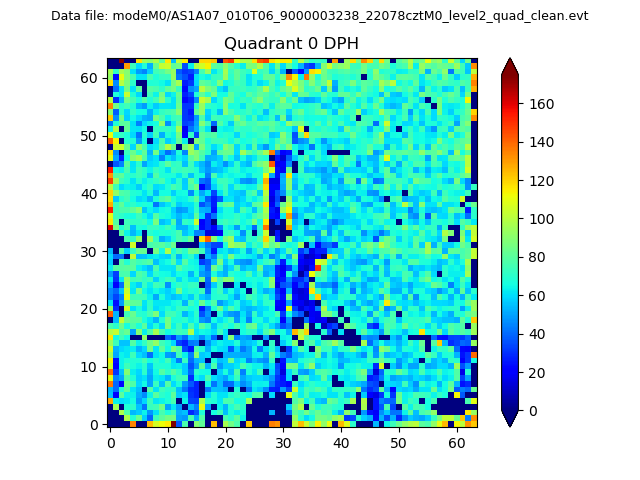 |
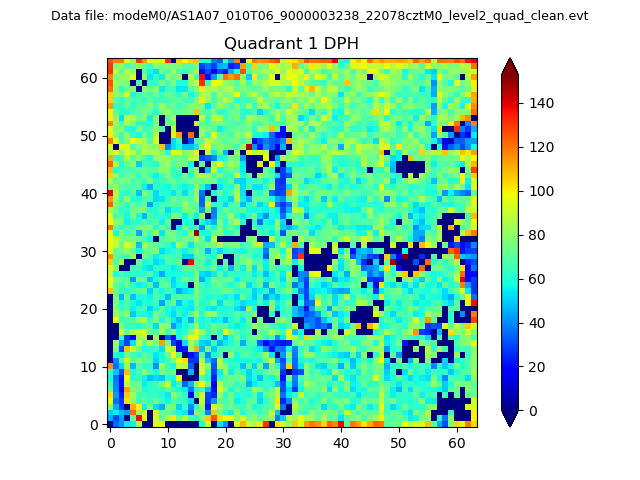 |
Quadrant B |
|---|---|---|---|
| Quadrant D | 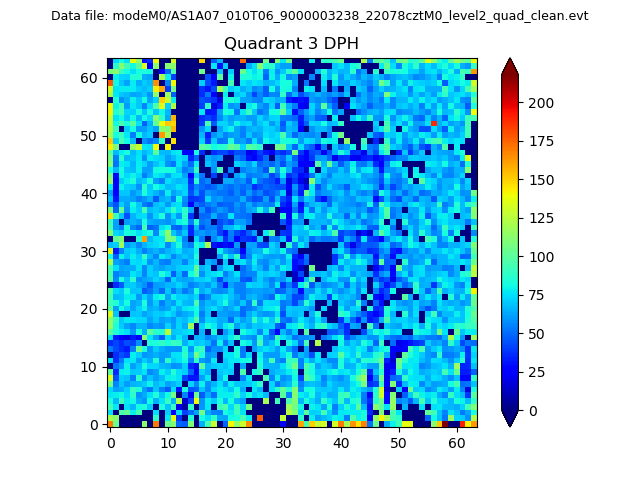 |
 |
Quadrant C |
| Plot type | Count rate plots | Images |
|---|---|---|
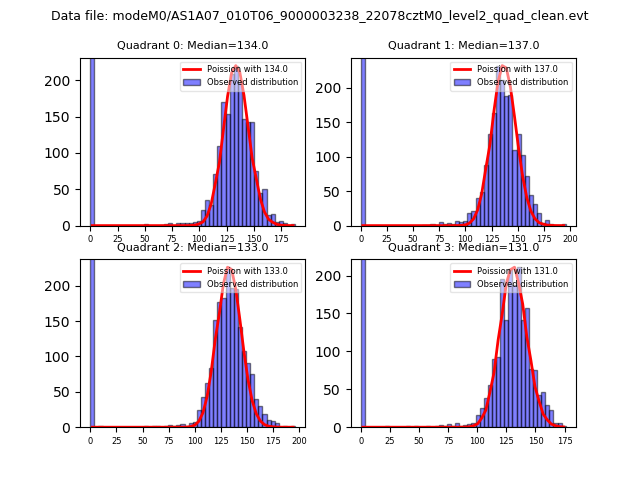
| Comparison with Poisson distribution Blue bars denote a histogram of data divided into 1 sec bins. Red curve is a Poisson curve with rate = median count rate of data. |
 |
 |
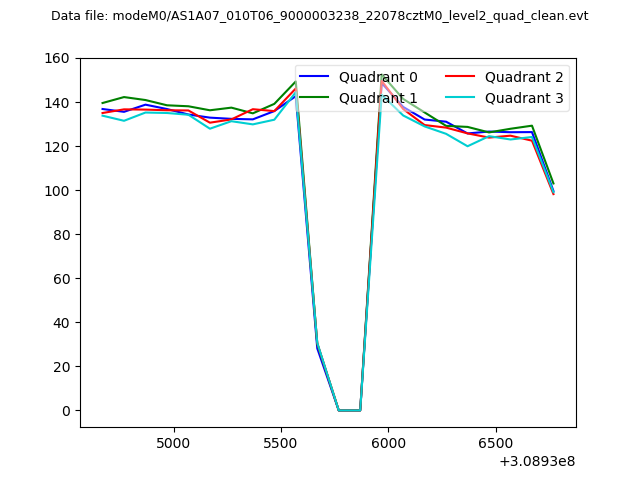
| Quadrant-wise count rates Data is divided into 100 sec bins |
 |
|
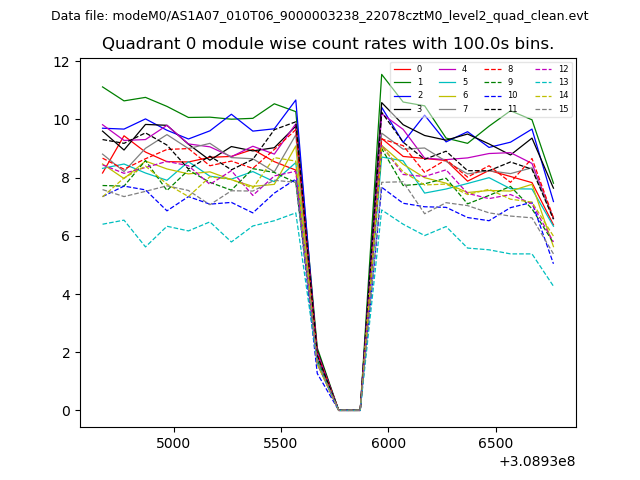
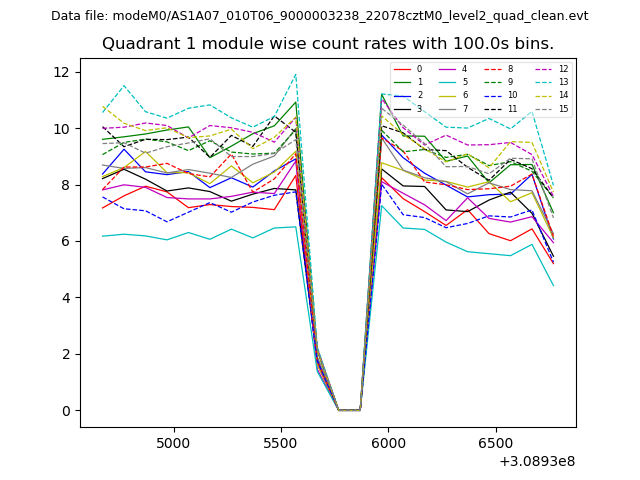
| Module-wise count rates for Quadrant A Data is divided into 100 sec bins |
 |
 |
| Module-wise count rates for Quadrant B Data is divided into 100 sec bins |
 |
 |
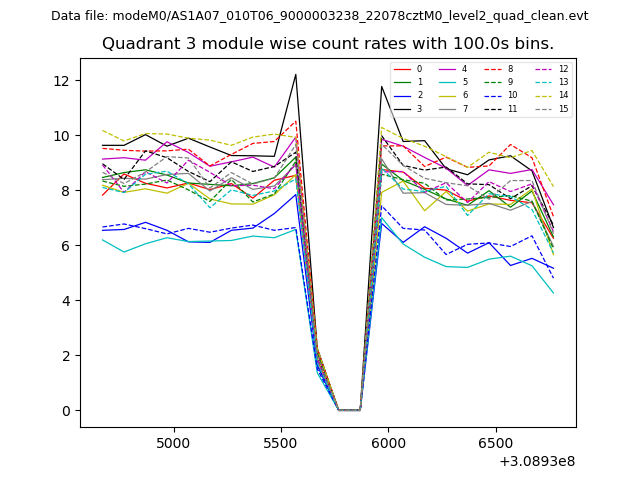
| Module-wise count rates for Quadrant C Data is divided into 100 sec bins |
 |
 |
| Module-wise count rates for Quadrant D Data is divided into 100 sec bins |
 |
 |
| Parameter | Plot |
|---|---|
| CZT HV Monitor | 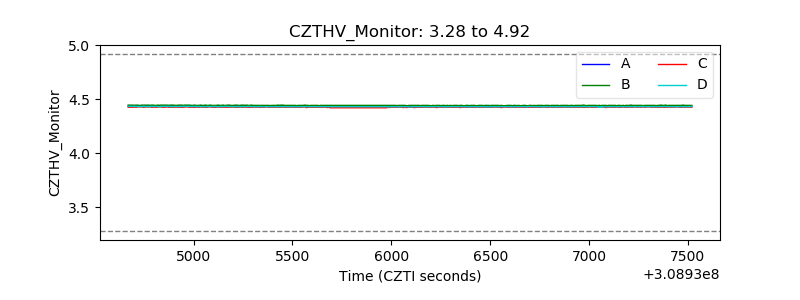 |
| D_VDD |  |
| Temperature 1 | 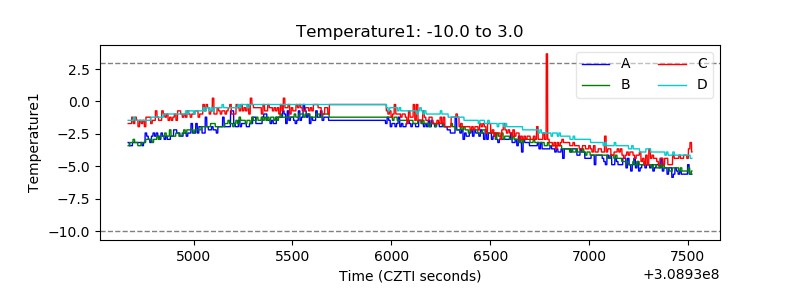 |
| Veto HV Monitor | 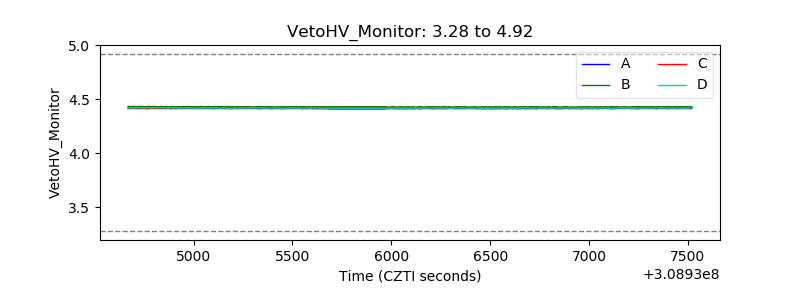 |
| Veto LLD | 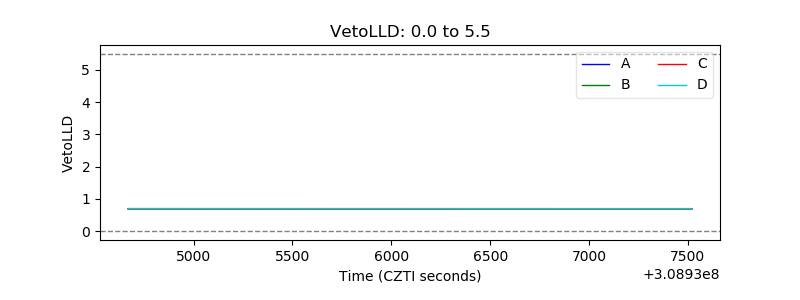 |
| Alpha Counter | 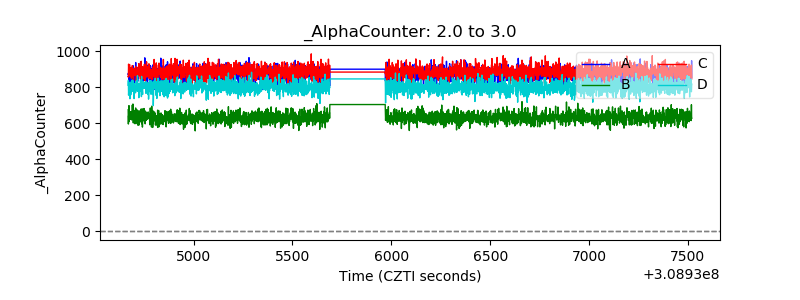 |
| _CPM_Rate | 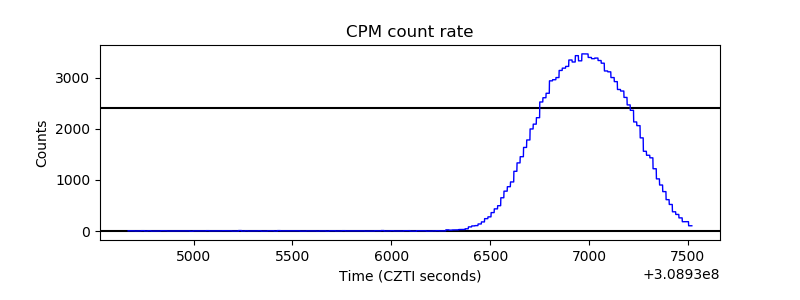 |
| CZT Counter | 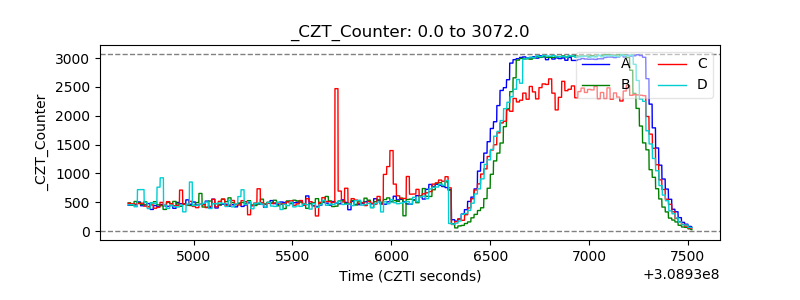 |
| +2.5 Volts monitor |  |
| +5 Volts monitor |  |
| _ROLL_ROT | 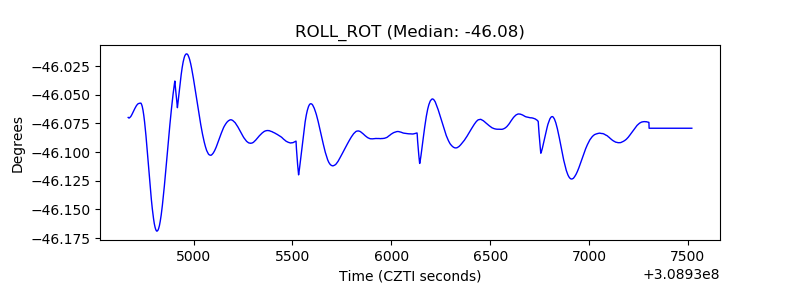 |
| _Roll_DEC | 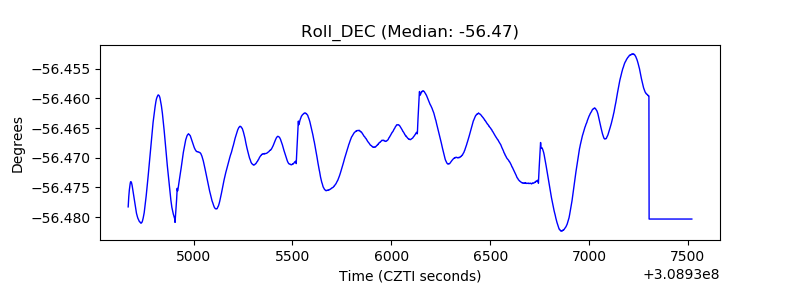 |
| _Roll_RA |  |
| Veto Counter | 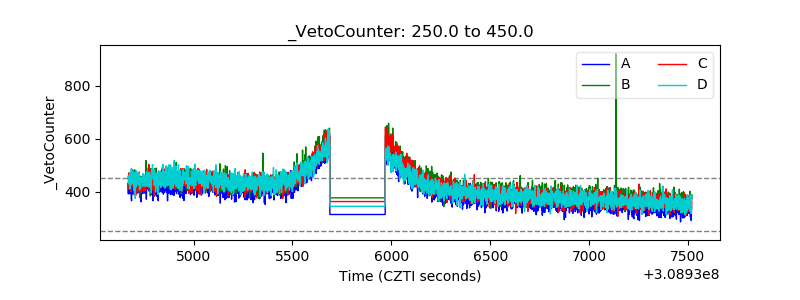 |