| Param | Original file | Final file |
|---|---|---|
| Filename | modeM0/AS1A07_010T11_9000003240cztM0_level2.fits | modeM0/AS1A07_010T11_9000003240cztM0_level2_quad_clean.evt |
| Size (bytes) | 341,979,840 | 382,625,280 |
| Size | 326.1 MB | 364.9 MB |
| Events in quadrant A | 2,095,936 | 2,406,118 |
| Events in quadrant B | 2,008,844 | 2,404,968 |
| Events in quadrant C | 2,048,068 | 2,284,386 |
| Events in quadrant D | 1,656,826 | 1,948,357 |
| Mode M0 | |||
|---|---|---|---|
| Quadrant | BADHDUFLAG | Total packets | Discarded packets |
| A | 0 | 75650 | 0 |
| B | 0 | 80373 | 0 |
| C | 0 | 76457 | 0 |
| D | 0 | 125384 | 0 |
| Mode SS | |||
|---|---|---|---|
| Quadrant | BADHDUFLAG | Total packets | Discarded packets |
| A | 0 | 752 | 0 |
| B | 0 | 752 | 0 |
| C | 0 | 752 | 0 |
| D | 0 | 752 | 0 |
| Mode M9 | |||
|---|---|---|---|
| Quadrant | BADHDUFLAG | Total packets | Discarded packets |
| A | 0 | 29 | 0 |
| B | 0 | 29 | 0 |
| C | 0 | 29 | 0 |
| D | 0 | 29 | 0 |
| Quadrant | Total seconds | Saturated seconds | Saturation percentage |
|---|---|---|---|
| A | 37050 | 226 | 0.609987% |
| B | 37049 | 719 | 1.940673% |
| C | 37047 | 557 | 1.503496% |
| D | 37042 | 6209 | 16.762054% |
Noise dominated data is calculated using 1-second bins in cleaned event files. If a bin has >2000 counts, and if more than 50% of those come from <1% of pixels, then it is considered to be noise-dominated and hence unusable.
| Quadrant | # 1 sec bins | Bins with >0 counts | Bins with >2000 counts | High rate bins dominated by noise | Noise dominated (total time) | Noise dominated (detector-on time) | Marked lightcurve |
|---|---|---|---|---|---|---|---|
| A | 39933 | 37067 | 0 | 0 | 0.00% | 0.00% |  |
| B | 39933 | 37056 | 0 | 0 | 0.00% | 0.00% |  |
| C | 39933 | 37060 | 0 | 0 | 0.00% | 0.00% |  |
| D | 39933 | 37051 | 0 | 0 | 0.00% | 0.00% | 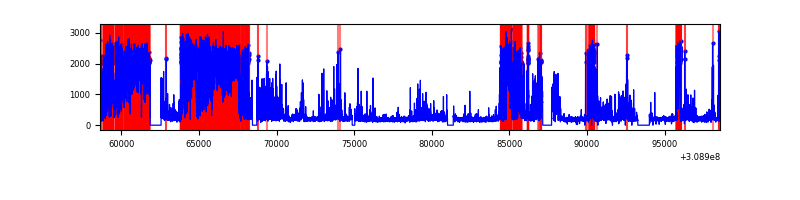 |
Top three noisy pixels from each quadrant. If the there are fewer than three noisy pixels in the level2.evt file, extra rows are filled as -1
| Pixel properties | Quadrant properties | ||||||
|---|---|---|---|---|---|---|---|
| Quadrant | DetID | PixID | Counts | Sigma | Mean | Median | Sigma |
| A | 0 | 29 | 1892 | 10.14 | 545 | 512 | 136.1 |
| A | 7 | 110 | 1764 | 9.2 | 545 | 512 | 136.1 |
| A | 9 | 19 | 1615 | 8.11 | 545 | 512 | 136.1 |
| B | 2 | 9 | 1622 | 10.59 | 531 | 504 | 105.6 |
| B | 2 | 8 | 1410 | 8.58 | 531 | 504 | 105.6 |
| B | 14 | 254 | 1345 | 7.97 | 531 | 504 | 105.6 |
| C | 1 | 81 | 1572 | 7.72 | 538 | 502 | 138.6 |
| C | 1 | 80 | 1561 | 7.64 | 538 | 502 | 138.6 |
| C | 12 | 241 | 1494 | 7.16 | 538 | 502 | 138.6 |
| D | 6 | 231 | 1225 | 6.27 | 472 | 431 | 126.5 |
| D | 6 | 67 | 1212 | 6.17 | 472 | 431 | 126.5 |
| D | 13 | 238 | 1188 | 5.98 | 472 | 431 | 126.5 |
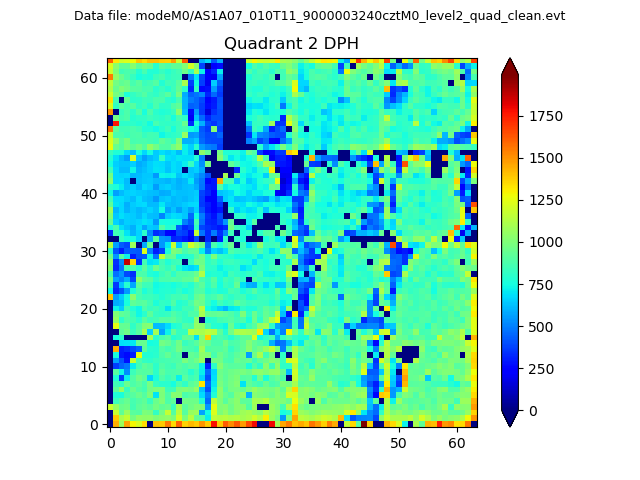
Histogram calculated using DETX and DETY for each event in the final _common_clean file
| Quadrant A | 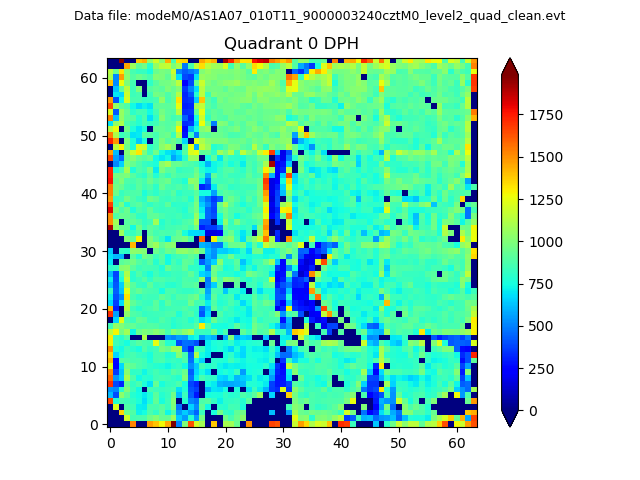 |
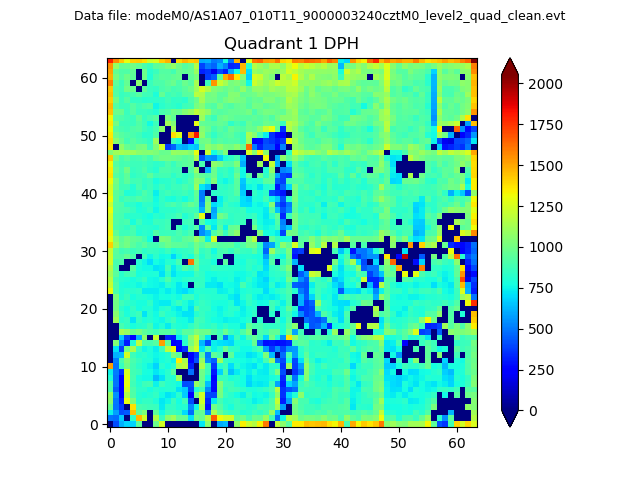 |
Quadrant B |
|---|---|---|---|
| Quadrant D | 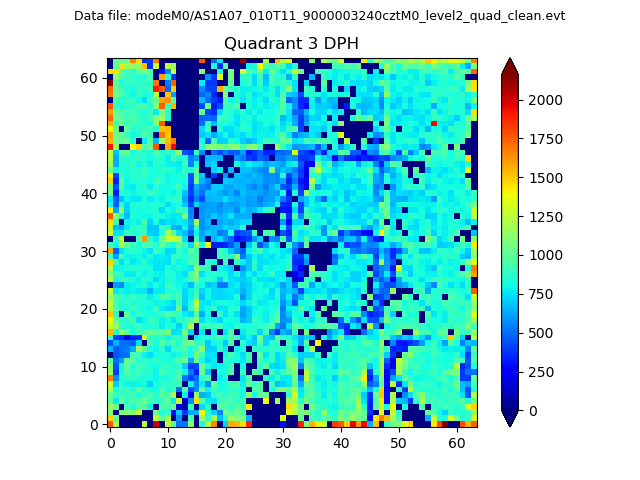 |
 |
Quadrant C |
| Plot type | Count rate plots | Images |
|---|---|---|
| Comparison with Poisson distribution Blue bars denote a histogram of data divided into 1 sec bins. Red curve is a Poisson curve with rate = median count rate of data. |
 |
 |
| Quadrant-wise count rates Data is divided into 100 sec bins |
 |
|
| Module-wise count rates for Quadrant A Data is divided into 100 sec bins |
 |
 |
| Module-wise count rates for Quadrant B Data is divided into 100 sec bins |
 |
 |
| Module-wise count rates for Quadrant C Data is divided into 100 sec bins |
 |
 |
| Module-wise count rates for Quadrant D Data is divided into 100 sec bins |
 |
 |
| Parameter | Plot |
|---|---|
| CZT HV Monitor |  |
| D_VDD |  |
| Temperature 1 |  |
| Veto HV Monitor |  |
| Veto LLD |  |
| Alpha Counter |  |
| _CPM_Rate |  |
| CZT Counter |  |
| +2.5 Volts monitor |  |
| +5 Volts monitor |  |
| _ROLL_ROT |  |
| _Roll_DEC |  |
| _Roll_RA | 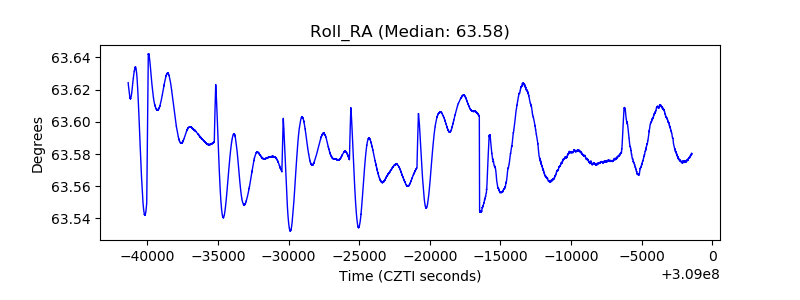 |
| Veto Counter |  |