| Param | Original file | Final file |
|---|---|---|
| Filename | modeM0/AS1A07_010T11_9000003240_21903cztM0_level2.evt | modeM0/AS1A07_010T11_9000003240_21903cztM0_level2_quad_clean.evt |
| Size (bytes) | 491,647,680 | 64,373,760 |
| Size | 468.9 MB | 61.4 MB |
| Events in quadrant A | 2,299,468 | 417,662 |
| Events in quadrant B | 2,461,241 | 427,111 |
| Events in quadrant C | 2,410,689 | 402,364 |
| Events in quadrant D | 7,389,504 | 362,355 |
| Mode M0 | |||
|---|---|---|---|
| Quadrant | BADHDUFLAG | Total packets | Discarded packets |
| A | 0 | 9945 | 1 |
| B | 0 | 10426 | 1 |
| C | 0 | 10287 | 1 |
| D | 0 | 25294 | 1 |
| Mode SS | |||
|---|---|---|---|
| Quadrant | BADHDUFLAG | Total packets | Discarded packets |
| A | 0 | 98 | 0 |
| B | 0 | 98 | 0 |
| C | 0 | 98 | 0 |
| D | 0 | 98 | 0 |
| Mode M9 | |||
|---|---|---|---|
| Quadrant | BADHDUFLAG | Total packets | Discarded packets |
| A | 0 | 7 | 0 |
| B | 0 | 7 | 0 |
| C | 0 | 7 | 0 |
| D | 0 | 7 | 0 |
| Quadrant | Total seconds | Saturated seconds | Saturation percentage |
|---|---|---|---|
| A | 4840 | 13 | 0.268595% |
| B | 4839 | 50 | 1.033271% |
| C | 4839 | 52 | 1.074602% |
| D | 4839 | 1926 | 39.801612% |
Noise dominated data is calculated using 1-second bins in cleaned event files. If a bin has >2000 counts, and if more than 50% of those come from <1% of pixels, then it is considered to be noise-dominated and hence unusable.
| Quadrant | # 1 sec bins | Bins with >0 counts | Bins with >2000 counts | High rate bins dominated by noise | Noise dominated (total time) | Noise dominated (detector-on time) | Marked lightcurve |
|---|---|---|---|---|---|---|---|
| A | 5550 | 4841 | 4 | 4 | 0.07% | 0.08% | 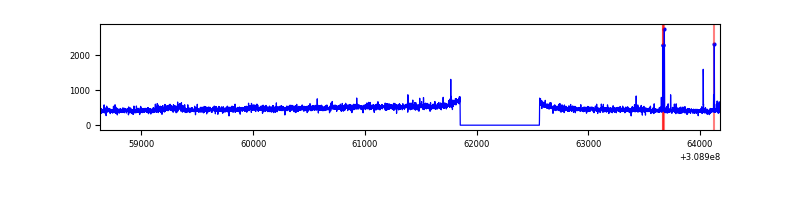 |
| B | 5549 | 4840 | 20 | 20 | 0.36% | 0.41% | 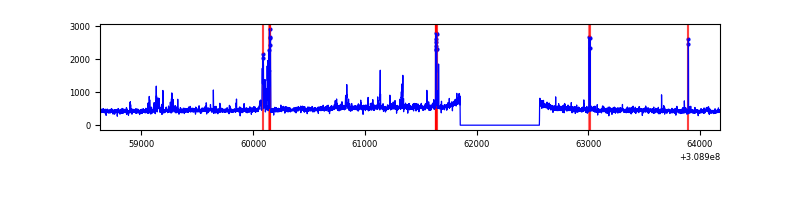 |
| C | 5549 | 4840 | 7 | 7 | 0.13% | 0.14% |  |
| D | 5549 | 4839 | 1828 | 1828 | 32.94% | 37.78% | 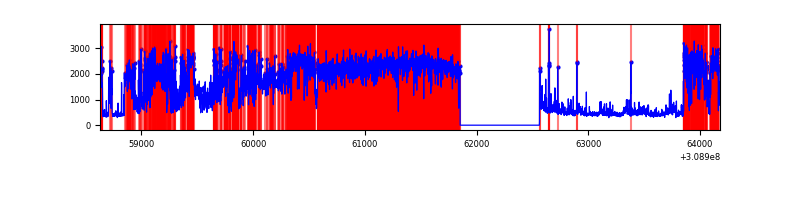 |
Top three noisy pixels from each quadrant. If the there are fewer than three noisy pixels in the level2.evt file, extra rows are filled as -1
| Pixel properties | Quadrant properties | ||||||
|---|---|---|---|---|---|---|---|
| Quadrant | DetID | PixID | Counts | Sigma | Mean | Median | Sigma |
| A | 5 | 16 | 47876 | 401.81 | 582 | 568 | 117.7 |
| A | 13 | 254 | 8868 | 70.5 | 582 | 568 | 117.7 |
| A | 3 | 1 | 5184 | 39.21 | 582 | 568 | 117.7 |
| B | 3 | 64 | 136694 | 1232.37 | 582 | 568 | 110.5 |
| B | 12 | 111 | 13051 | 113.01 | 582 | 568 | 110.5 |
| B | 0 | 197 | 11645 | 100.28 | 582 | 568 | 110.5 |
| C | 10 | 22 | 134532 | 1015.07 | 561 | 565 | 132.0 |
| C | 14 | 238 | 88000 | 662.49 | 561 | 565 | 132.0 |
| C | 13 | 61 | 4112 | 26.88 | 561 | 565 | 132.0 |
| D | 7 | 238 | 5326240 | 44162.66 | 497 | 482 | 120.6 |
| D | 1 | 52 | 43056 | 353.04 | 497 | 482 | 120.6 |
| D | 2 | 136 | 36419 | 298.0 | 497 | 482 | 120.6 |
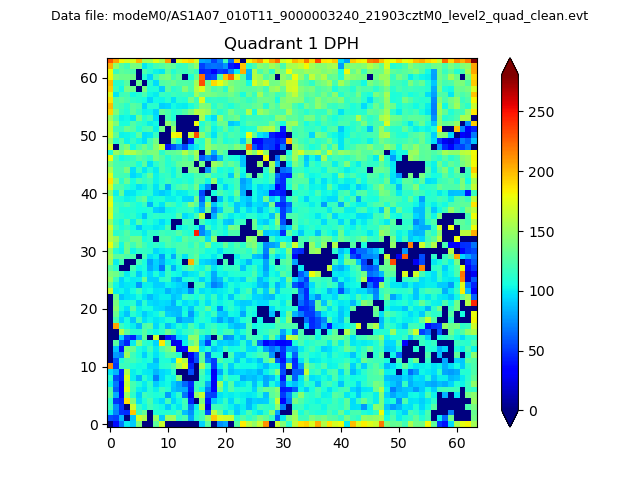
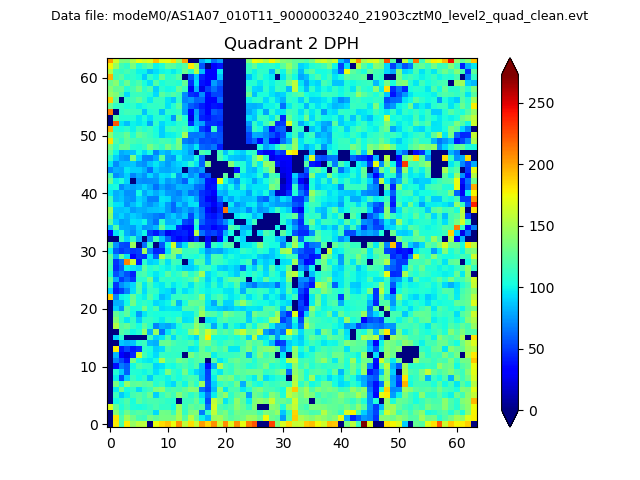
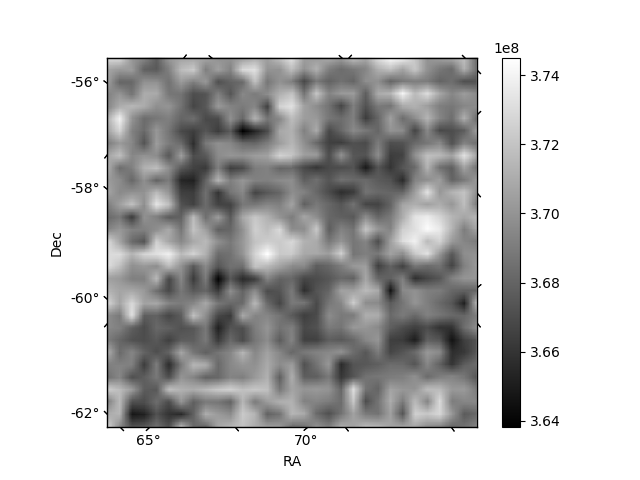
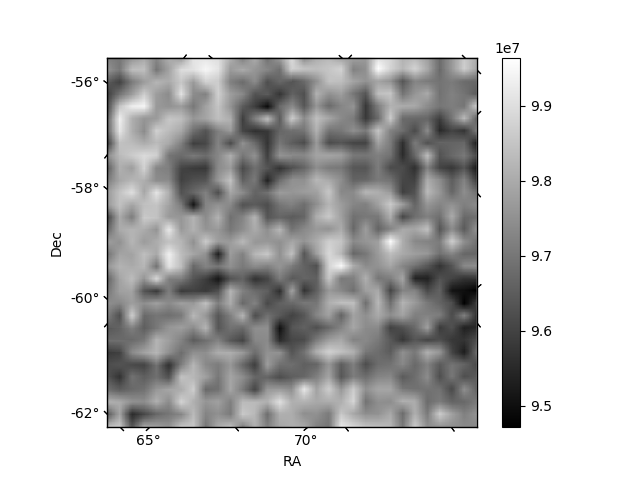
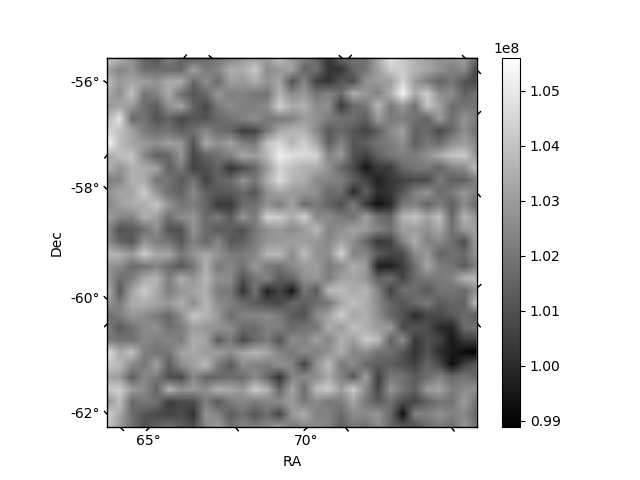
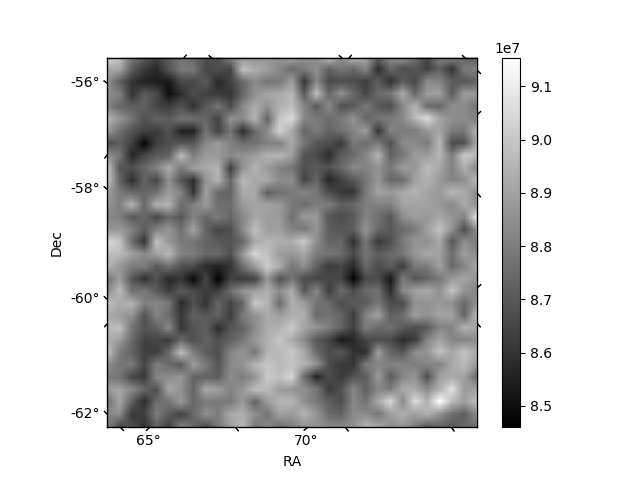
Histogram calculated using DETX and DETY for each event in the final _common_clean file
| Quadrant A | 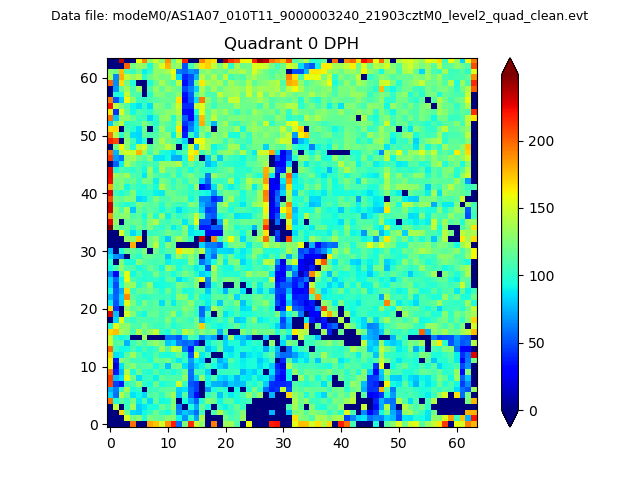 |
 |
Quadrant B |
|---|---|---|---|
| Quadrant D | 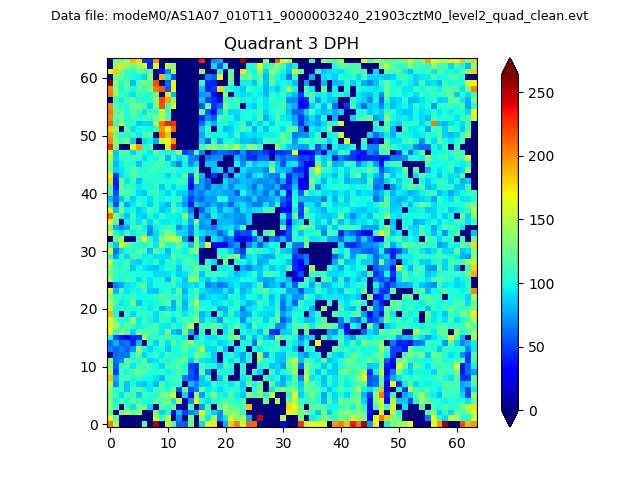 |
 |
Quadrant C |
| Plot type | Count rate plots | Images |
|---|---|---|
| Comparison with Poisson distribution Blue bars denote a histogram of data divided into 1 sec bins. Red curve is a Poisson curve with rate = median count rate of data. |
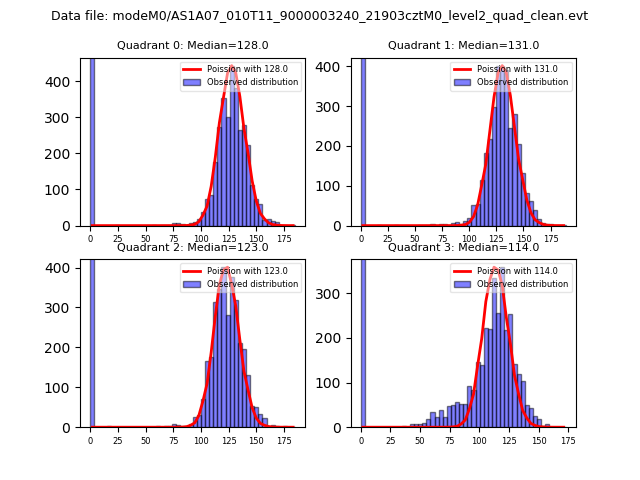 |
 |
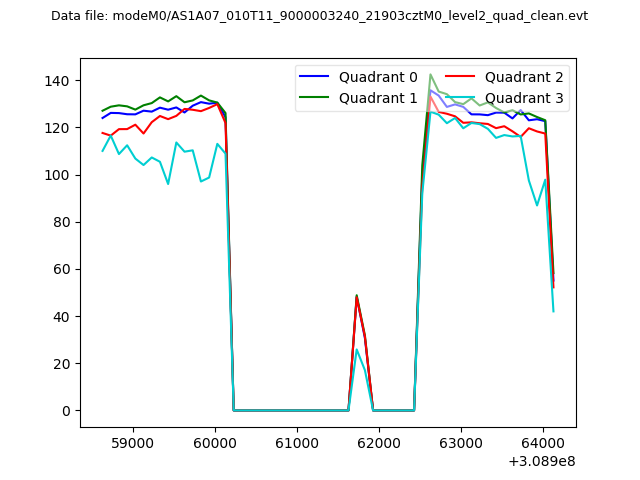
| Quadrant-wise count rates Data is divided into 100 sec bins |
 |
|
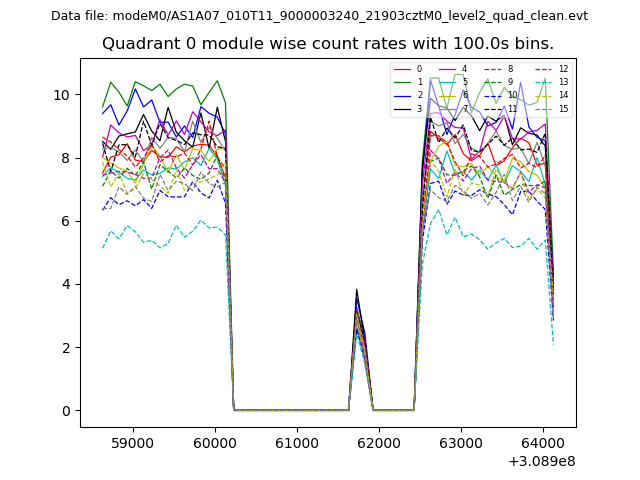
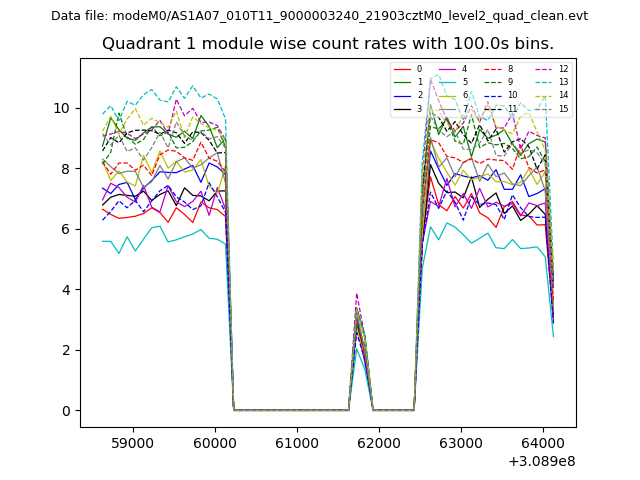
| Module-wise count rates for Quadrant A Data is divided into 100 sec bins |
 |
 |
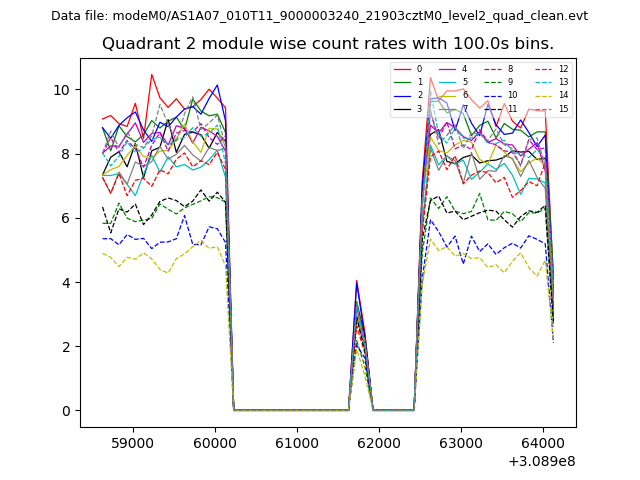
| Module-wise count rates for Quadrant B Data is divided into 100 sec bins |
 |
 |
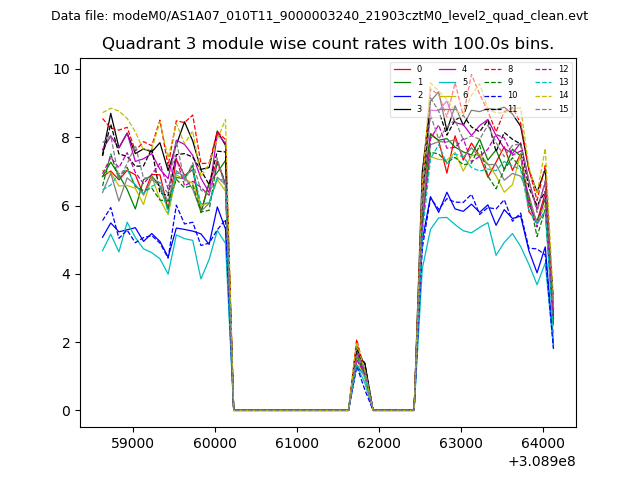
| Module-wise count rates for Quadrant C Data is divided into 100 sec bins |
 |
 |
| Module-wise count rates for Quadrant D Data is divided into 100 sec bins |
 |
 |
| Parameter | Plot |
|---|---|
| CZT HV Monitor | 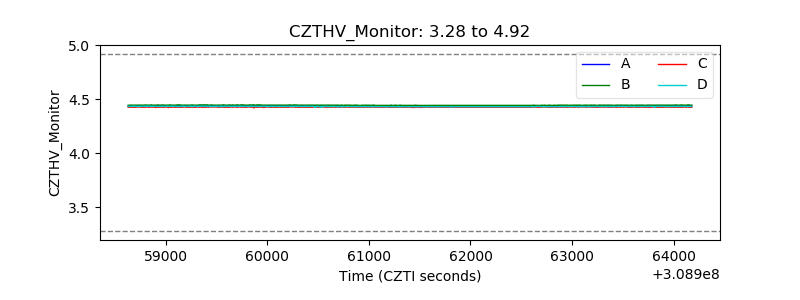 |
| D_VDD | 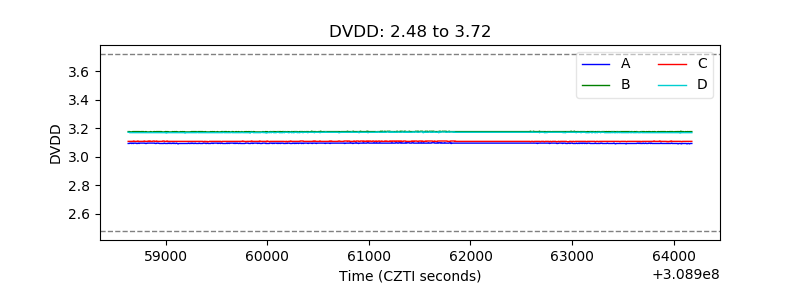 |
| Temperature 1 | 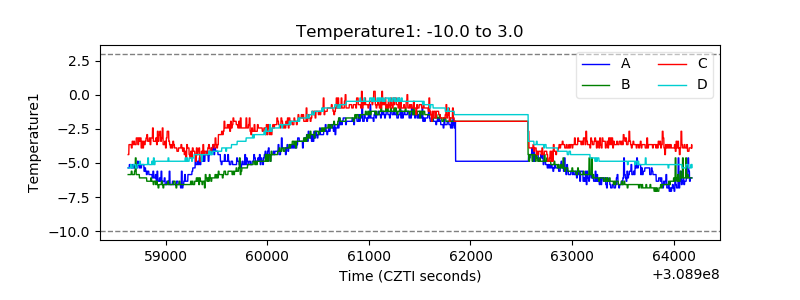 |
| Veto HV Monitor | 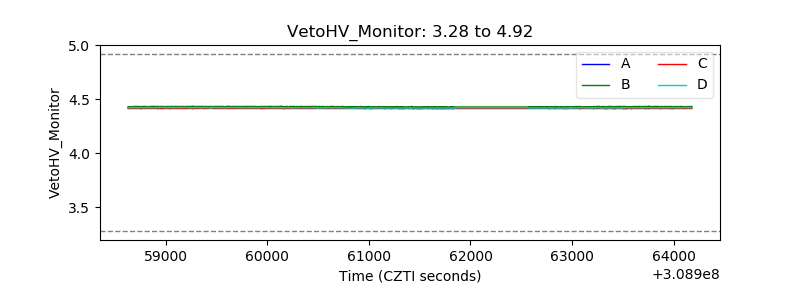 |
| Veto LLD | 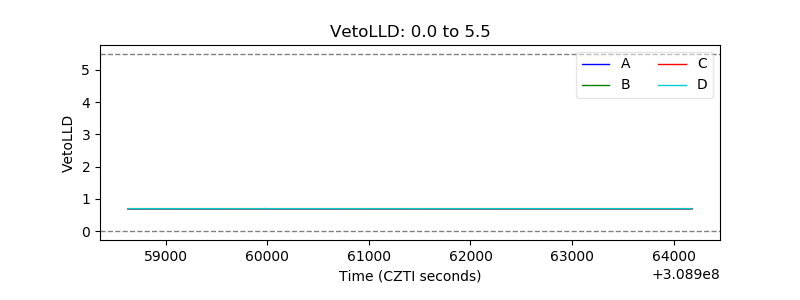 |
| Alpha Counter | 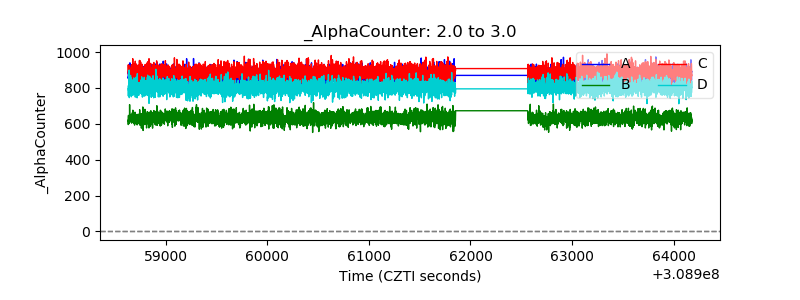 |
| _CPM_Rate | 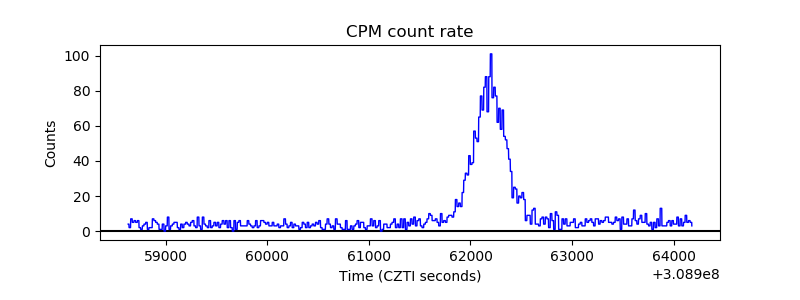 |
| CZT Counter | 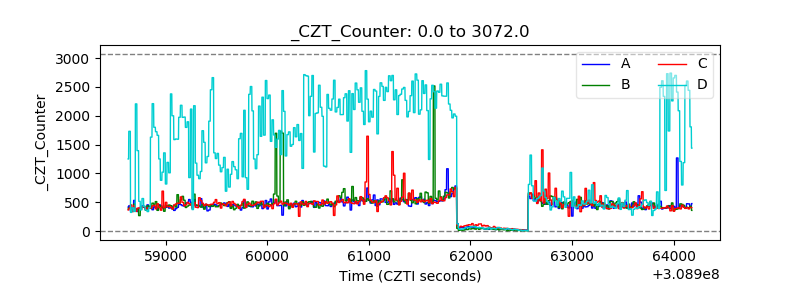 |
| +2.5 Volts monitor |  |
| +5 Volts monitor |  |
| _ROLL_ROT | 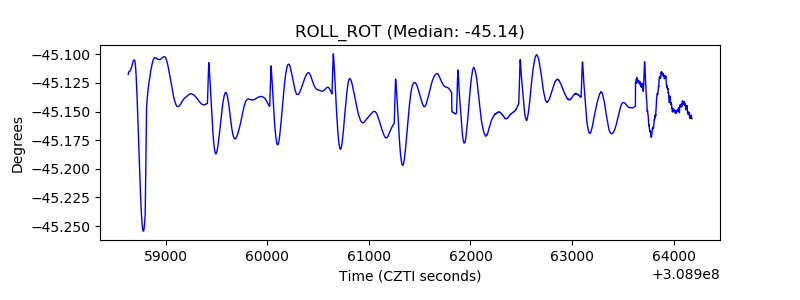 |
| _Roll_DEC | 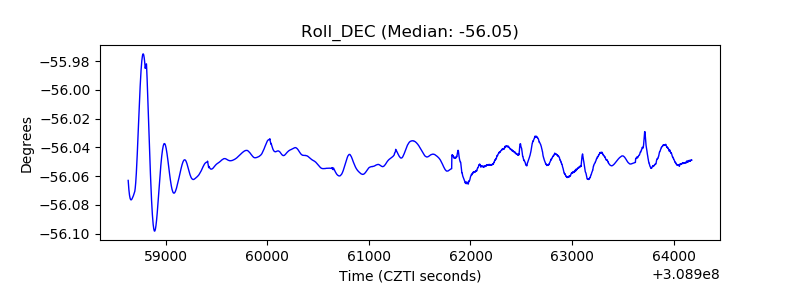 |
| _Roll_RA | 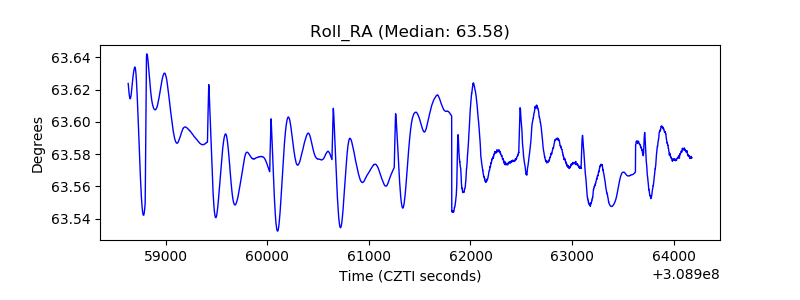 |
| Veto Counter | 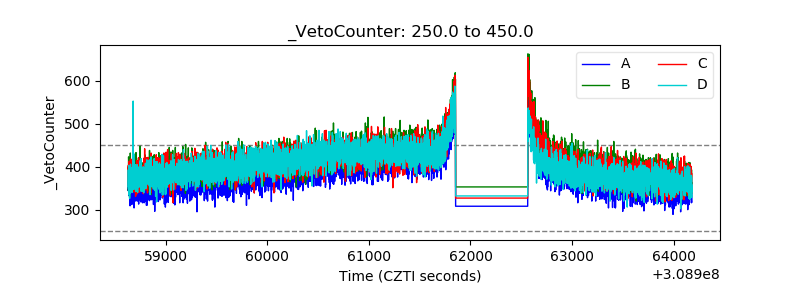 |