| Param | Original file | Final file |
|---|---|---|
| Filename | modeM0/AS1A07_010T11_9000003240_21909cztM0_level2.evt | modeM0/AS1A07_010T11_9000003240_21909cztM0_level2_quad_clean.evt |
| Size (bytes) | 1,554,039,360 | 303,122,880 |
| Size | 1.4 GB | 289.1 MB |
| Events in quadrant A | 10,003,353 | 1,956,695 |
| Events in quadrant B | 11,163,662 | 1,980,592 |
| Events in quadrant C | 10,322,274 | 1,897,498 |
| Events in quadrant D | 14,097,441 | 1,841,314 |
| Mode M0 | |||
|---|---|---|---|
| Quadrant | BADHDUFLAG | Total packets | Discarded packets |
| A | 0 | 44593 | 52 |
| B | 0 | 47499 | 54 |
| C | 0 | 45200 | 55 |
| D | 0 | 57310 | 90 |
| Mode SS | |||
|---|---|---|---|
| Quadrant | BADHDUFLAG | Total packets | Discarded packets |
| A | 0 | 444 | 0 |
| B | 0 | 444 | 0 |
| C | 0 | 444 | 0 |
| D | 0 | 444 | 0 |
| Mode M9 | |||
|---|---|---|---|
| Quadrant | BADHDUFLAG | Total packets | Discarded packets |
| A | 0 | 19 | 0 |
| B | 0 | 19 | 0 |
| C | 0 | 19 | 0 |
| D | 0 | 19 | 0 |
| Quadrant | Total seconds | Saturated seconds | Saturation percentage |
|---|---|---|---|
| A | 21865 | 196 | 0.896410% |
| B | 21864 | 483 | 2.209111% |
| C | 21862 | 411 | 1.879974% |
| D | 21858 | 1352 | 6.185378% |
Noise dominated data is calculated using 1-second bins in cleaned event files. If a bin has >2000 counts, and if more than 50% of those come from <1% of pixels, then it is considered to be noise-dominated and hence unusable.
| Quadrant | # 1 sec bins | Bins with >0 counts | Bins with >2000 counts | High rate bins dominated by noise | Noise dominated (total time) | Noise dominated (detector-on time) | Marked lightcurve |
|---|---|---|---|---|---|---|---|
| A | 23758 | 21886 | 2 | 2 | 0.01% | 0.01% | 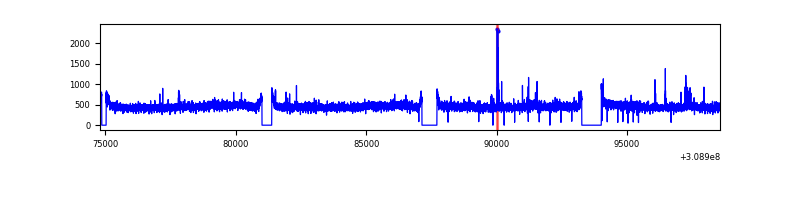 |
| B | 23758 | 21885 | 178 | 178 | 0.75% | 0.81% | 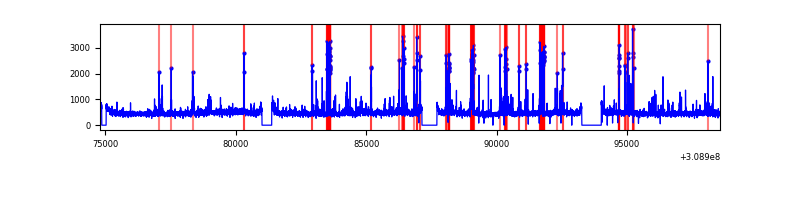 |
| C | 23758 | 21882 | 41 | 41 | 0.17% | 0.19% |  |
| D | 23759 | 21880 | 1143 | 1143 | 4.81% | 5.22% | 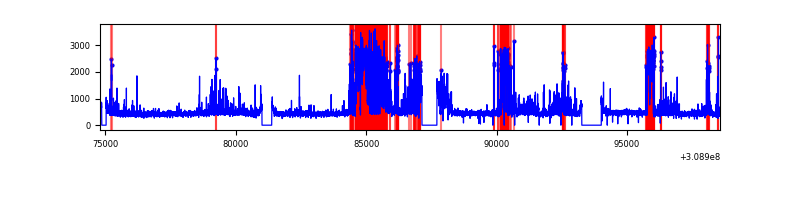 |
Top three noisy pixels from each quadrant. If the there are fewer than three noisy pixels in the level2.evt file, extra rows are filled as -1
| Pixel properties | Quadrant properties | ||||||
|---|---|---|---|---|---|---|---|
| Quadrant | DetID | PixID | Counts | Sigma | Mean | Median | Sigma |
| A | 5 | 16 | 84872 | 161.35 | 2561 | 2501 | 510.5 |
| A | 13 | 254 | 40222 | 73.89 | 2561 | 2501 | 510.5 |
| A | 4 | 2 | 35518 | 64.67 | 2561 | 2501 | 510.5 |
| B | 3 | 64 | 846222 | 1759.24 | 2555 | 2485 | 479.6 |
| B | 0 | 197 | 143277 | 293.56 | 2555 | 2485 | 479.6 |
| B | 0 | 190 | 84032 | 170.03 | 2555 | 2485 | 479.6 |
| C | 14 | 238 | 391835 | 677.32 | 2468 | 2479 | 574.8 |
| C | 10 | 22 | 289883 | 499.97 | 2468 | 2479 | 574.8 |
| C | 13 | 61 | 17128 | 25.48 | 2468 | 2479 | 574.8 |
| D | 1 | 52 | 4382464 | 7354.11 | 2454 | 2377 | 595.6 |
| D | 2 | 136 | 177903 | 294.71 | 2454 | 2377 | 595.6 |
| D | 2 | 234 | 96730 | 158.42 | 2454 | 2377 | 595.6 |
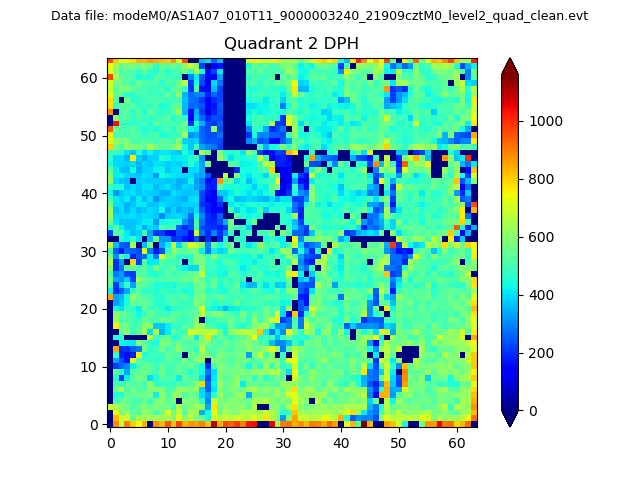
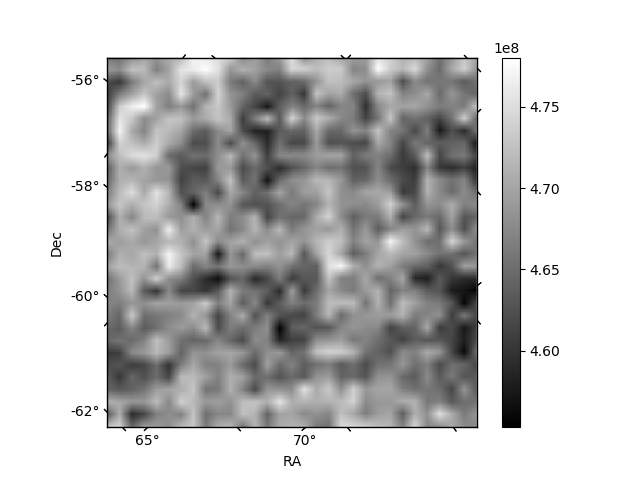
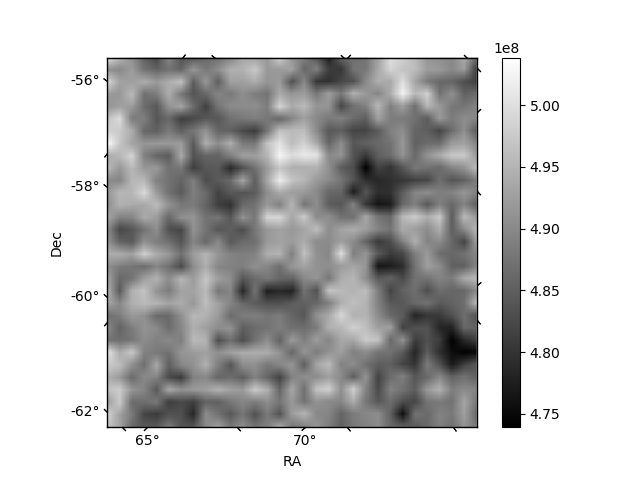
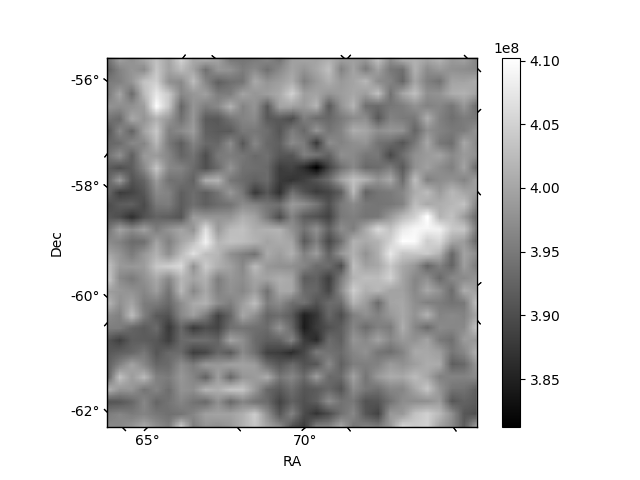
Histogram calculated using DETX and DETY for each event in the final _common_clean file
| Quadrant A | 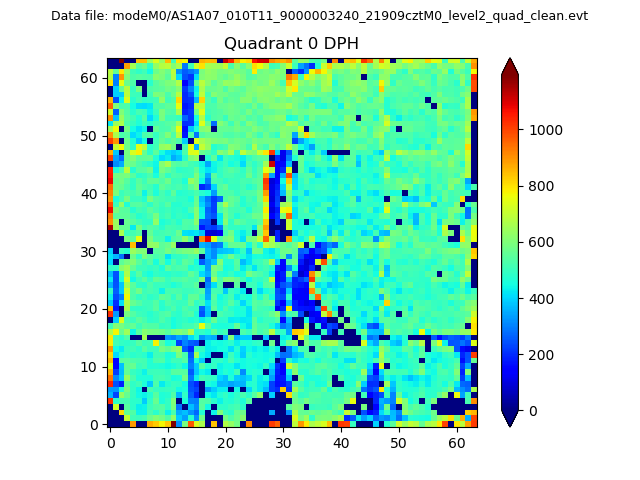 |
 |
Quadrant B |
|---|---|---|---|
| Quadrant D | 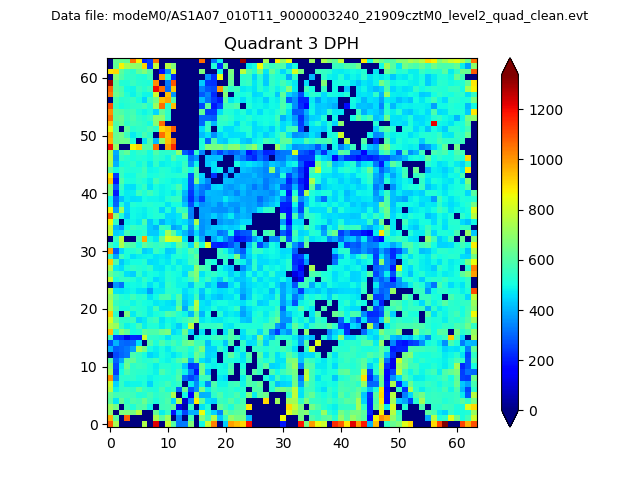 |
 |
Quadrant C |
| Plot type | Count rate plots | Images |
|---|---|---|
| Comparison with Poisson distribution Blue bars denote a histogram of data divided into 1 sec bins. Red curve is a Poisson curve with rate = median count rate of data. |
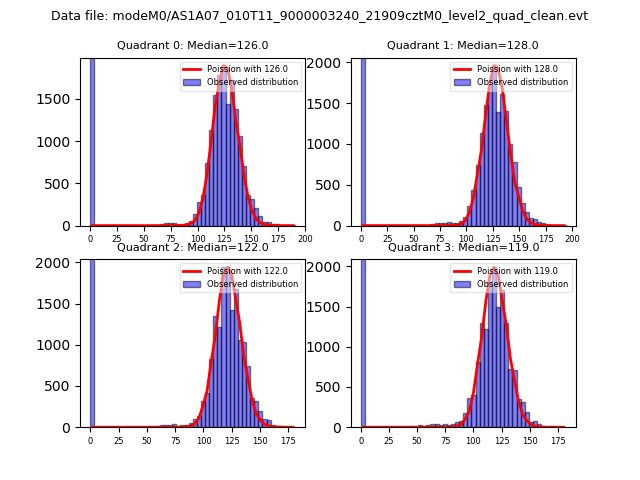 |
 |
| Quadrant-wise count rates Data is divided into 100 sec bins |
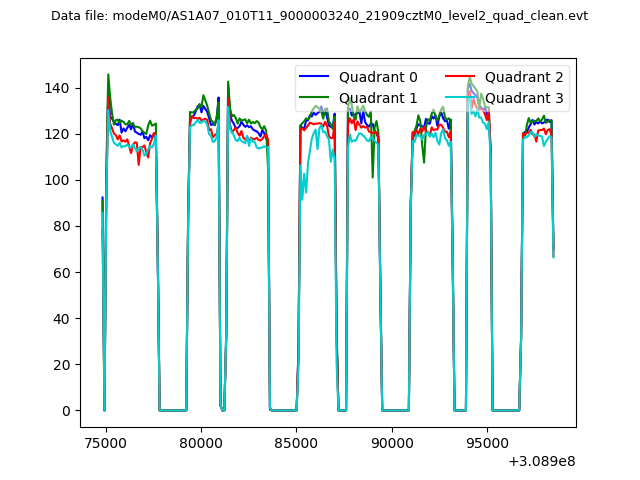 |
|
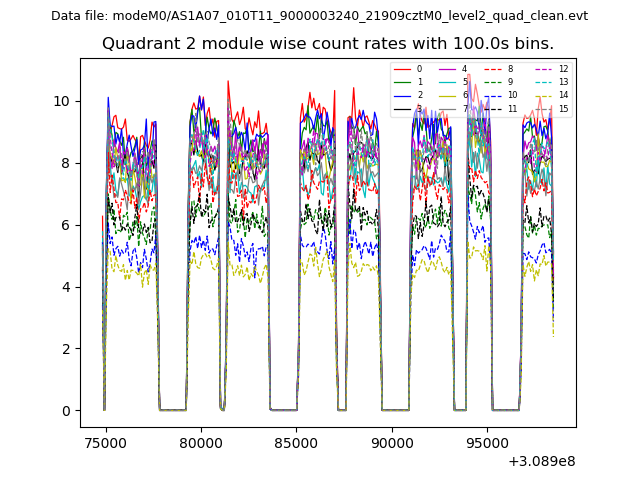
| Module-wise count rates for Quadrant A Data is divided into 100 sec bins |
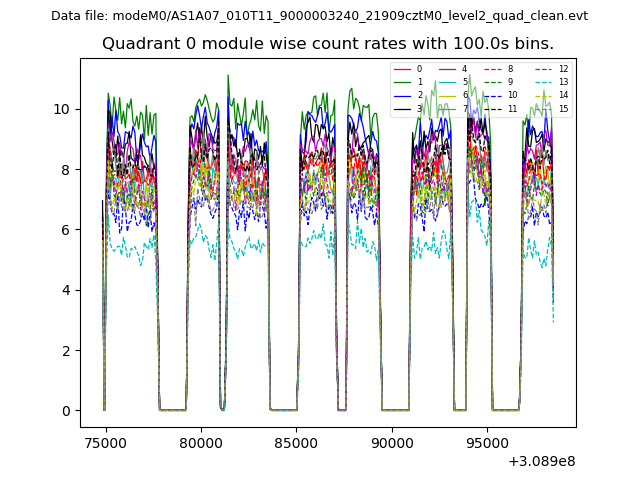 |
 |
| Module-wise count rates for Quadrant B Data is divided into 100 sec bins |
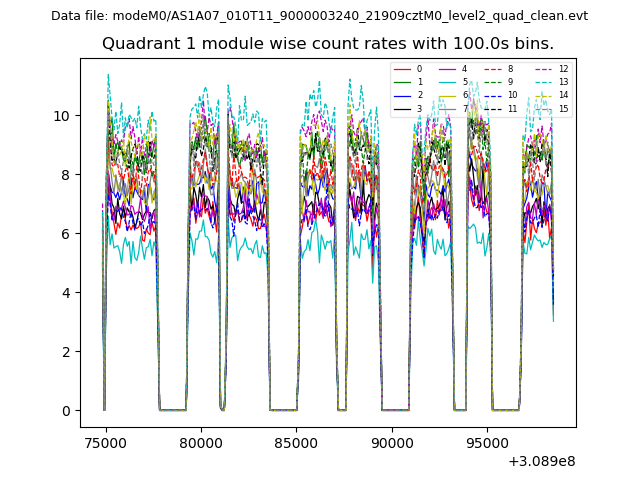 |
 |
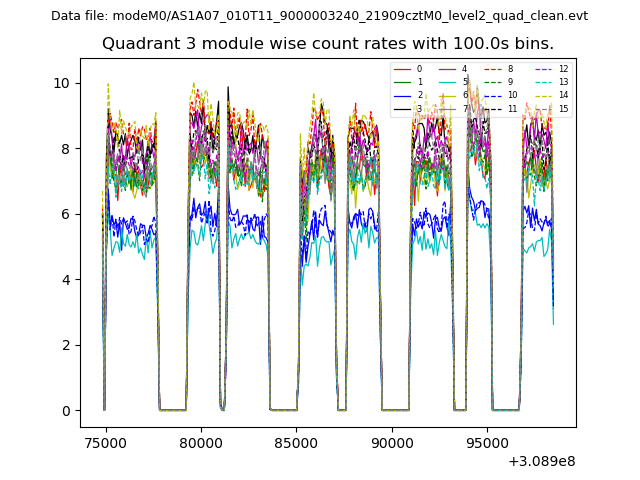
| Module-wise count rates for Quadrant C Data is divided into 100 sec bins |
 |
 |
| Module-wise count rates for Quadrant D Data is divided into 100 sec bins |
 |
 |
| Parameter | Plot |
|---|---|
| CZT HV Monitor | 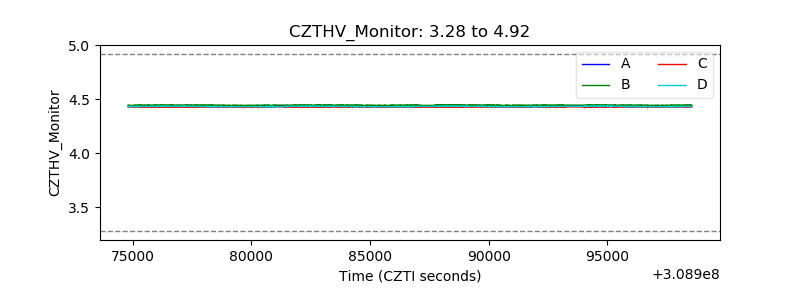 |
| D_VDD | 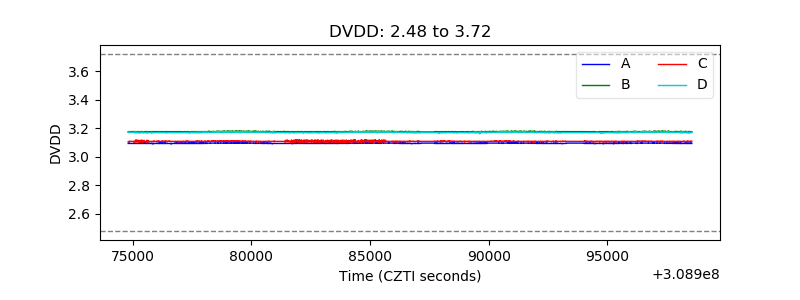 |
| Temperature 1 | 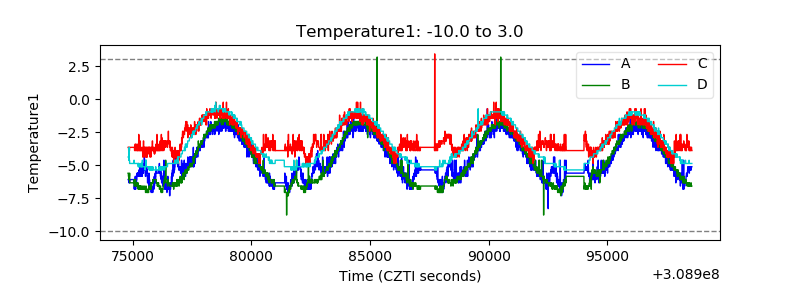 |
| Veto HV Monitor | 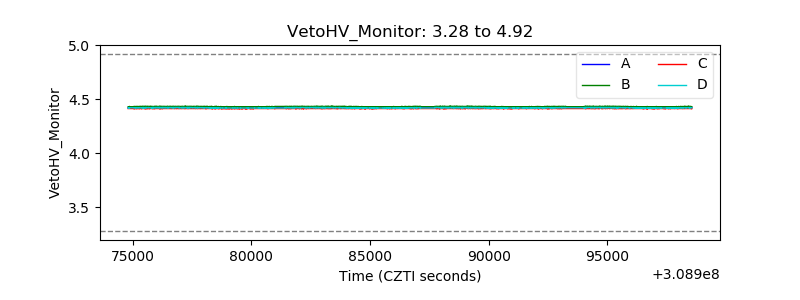 |
| Veto LLD | 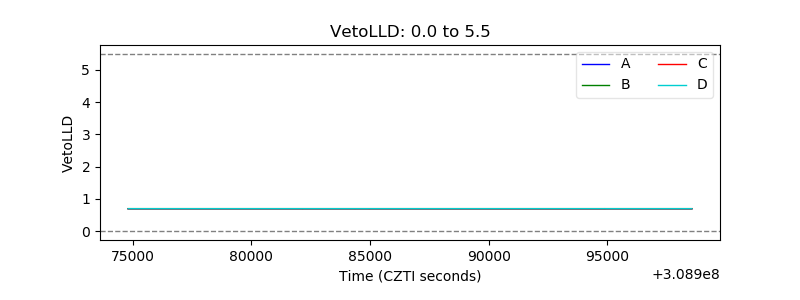 |
| Alpha Counter | 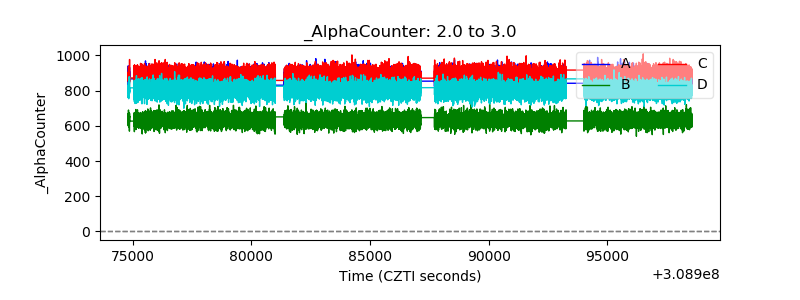 |
| _CPM_Rate | 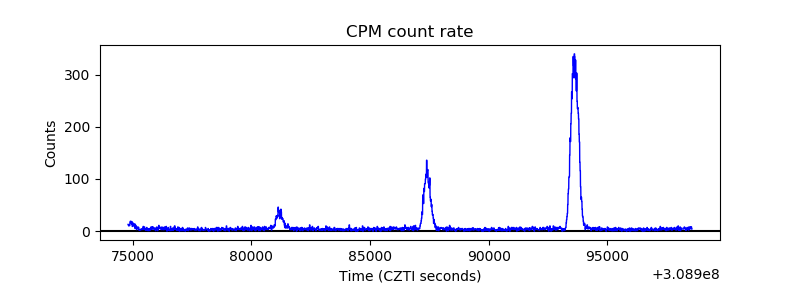 |
| CZT Counter | 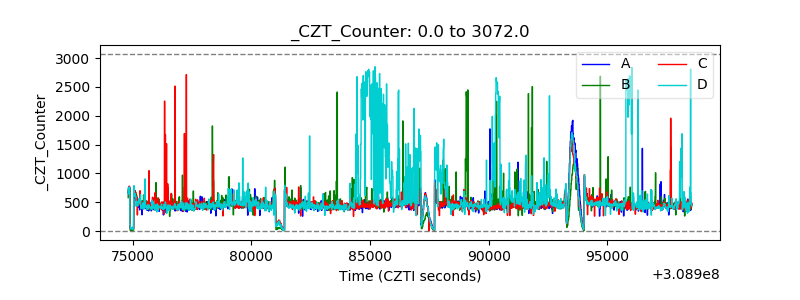 |
| +2.5 Volts monitor |  |
| +5 Volts monitor |  |
| _ROLL_ROT | 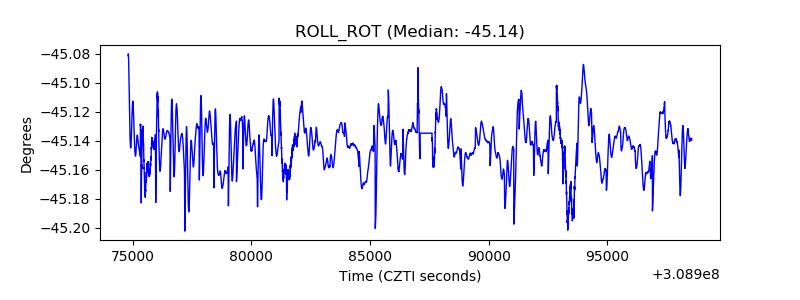 |
| _Roll_DEC | 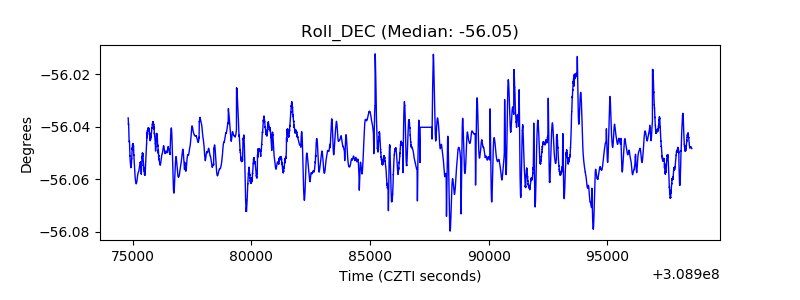 |
| _Roll_RA | 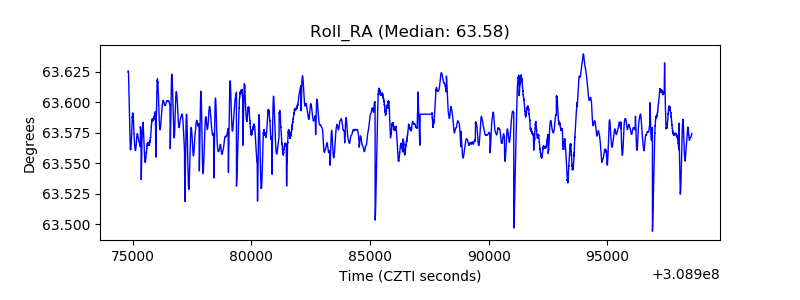 |
| Veto Counter | 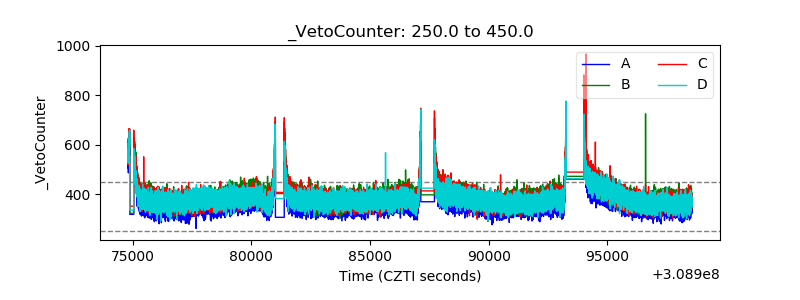 |