| Param | Original file | Final file |
|---|---|---|
| Filename | modeM0/AS1A07_100T03_9000003242cztM0_level2.fits | modeM0/AS1A07_100T03_9000003242cztM0_level2_quad_clean.evt |
| Size (bytes) | 1,461,165,120 | 1,774,287,360 |
| Size | 1.4 GB | 1.7 GB |
| Events in quadrant A | 9,001,174 | 11,389,349 |
| Events in quadrant B | 8,543,686 | 11,199,285 |
| Events in quadrant C | 8,948,658 | 11,148,293 |
| Events in quadrant D | 7,533,026 | 9,784,447 |
| Mode M0 | |||
|---|---|---|---|
| Quadrant | BADHDUFLAG | Total packets | Discarded packets |
| A | 0 | 341626 | 0 |
| B | 0 | 349754 | 0 |
| C | 0 | 313956 | 0 |
| D | 0 | 435807 | 0 |
| Mode SS | |||
|---|---|---|---|
| Quadrant | BADHDUFLAG | Total packets | Discarded packets |
| A | 0 | 3026 | 0 |
| B | 0 | 3026 | 0 |
| C | 0 | 3026 | 0 |
| D | 0 | 3026 | 0 |
| Mode M9 | |||
|---|---|---|---|
| Quadrant | BADHDUFLAG | Total packets | Discarded packets |
| A | 0 | 246 | 0 |
| B | 0 | 246 | 0 |
| C | 0 | 246 | 0 |
| D | 0 | 246 | 0 |
| Quadrant | Total seconds | Saturated seconds | Saturation percentage |
|---|---|---|---|
| A | 149180 | 3627 | 2.431291% |
| B | 149180 | 5775 | 3.871162% |
| C | 149180 | 2303 | 1.543773% |
| D | 149180 | 10996 | 7.370961% |
Noise dominated data is calculated using 1-second bins in cleaned event files. If a bin has >2000 counts, and if more than 50% of those come from <1% of pixels, then it is considered to be noise-dominated and hence unusable.
| Quadrant | # 1 sec bins | Bins with >0 counts | Bins with >2000 counts | High rate bins dominated by noise | Noise dominated (total time) | Noise dominated (detector-on time) | Marked lightcurve |
|---|---|---|---|---|---|---|---|
| A | 172790 | 149154 | 0 | 0 | 0.00% | 0.00% | 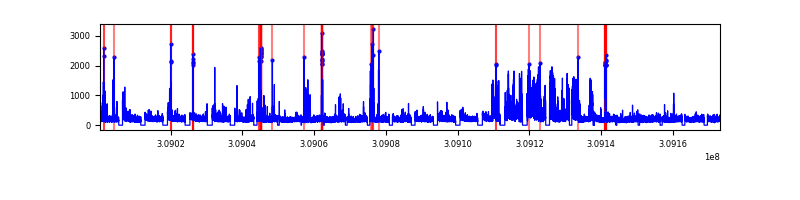 |
| B | 172790 | 149136 | 0 | 0 | 0.00% | 0.00% | 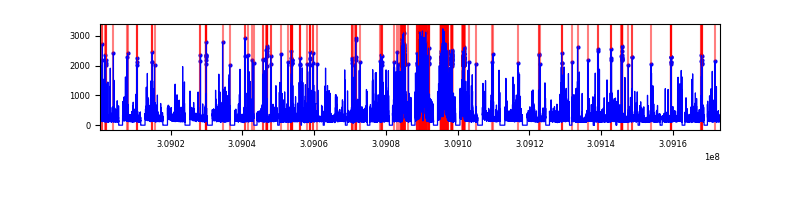 |
| C | 172790 | 149158 | 0 | 0 | 0.00% | 0.00% | 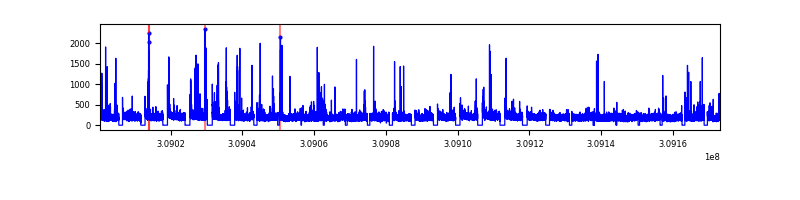 |
| D | 172790 | 149012 | 0 | 0 | 0.00% | 0.00% |  |
Top three noisy pixels from each quadrant. If the there are fewer than three noisy pixels in the level2.evt file, extra rows are filled as -1
| Pixel properties | Quadrant properties | ||||||
|---|---|---|---|---|---|---|---|
| Quadrant | DetID | PixID | Counts | Sigma | Mean | Median | Sigma |
| A | 0 | 29 | 8634 | 11.27 | 2345 | 2211 | 570.0 |
| A | 7 | 110 | 7211 | 8.77 | 2345 | 2211 | 570.0 |
| A | 0 | 30 | 6729 | 7.93 | 2345 | 2211 | 570.0 |
| B | 2 | 9 | 6819 | 10.6 | 2265 | 2168 | 438.6 |
| B | 2 | 8 | 5737 | 8.14 | 2265 | 2168 | 438.6 |
| B | 5 | 128 | 5687 | 8.02 | 2265 | 2168 | 438.6 |
| C | 3 | 234 | 6271 | 6.79 | 2363 | 2227 | 595.2 |
| C | 12 | 241 | 6179 | 6.64 | 2363 | 2227 | 595.2 |
| C | 3 | 126 | 6055 | 6.43 | 2363 | 2227 | 595.2 |
| D | 10 | 189 | 5439 | 6.21 | 2149 | 1967 | 559.0 |
| D | 6 | 67 | 5321 | 6.0 | 2149 | 1967 | 559.0 |
| D | 6 | 231 | 5293 | 5.95 | 2149 | 1967 | 559.0 |
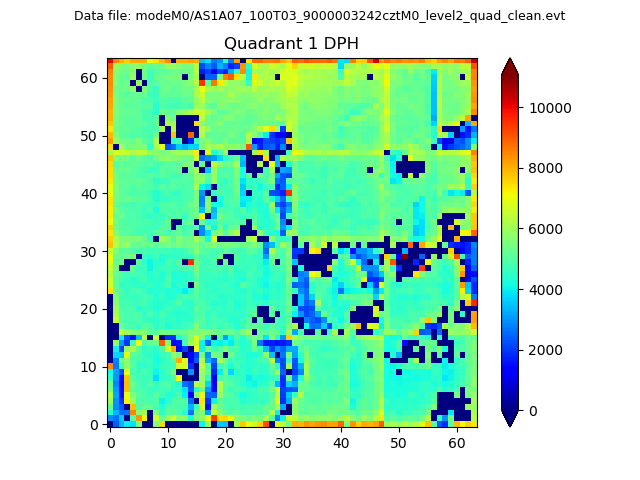
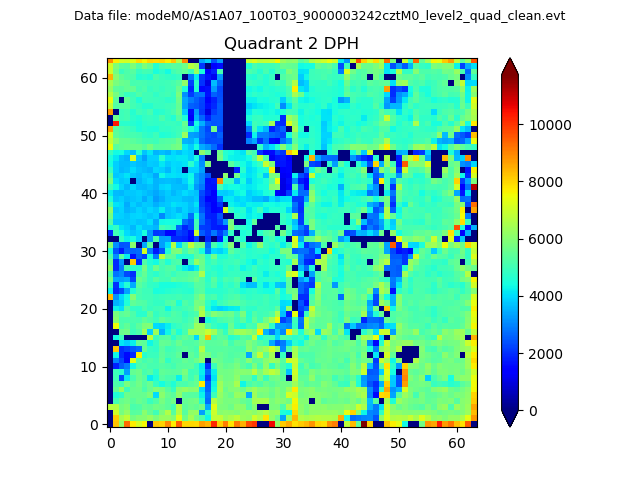
Histogram calculated using DETX and DETY for each event in the final _common_clean file
| Quadrant A |  |
 |
Quadrant B |
|---|---|---|---|
| Quadrant D | 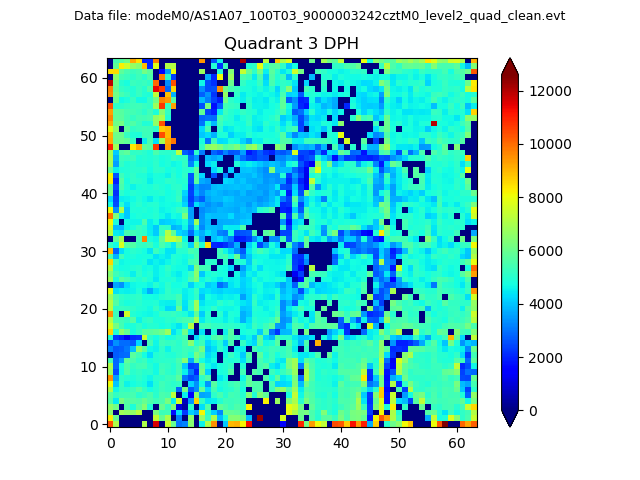 |
 |
Quadrant C |
| Plot type | Count rate plots | Images |
|---|---|---|
| Comparison with Poisson distribution Blue bars denote a histogram of data divided into 1 sec bins. Red curve is a Poisson curve with rate = median count rate of data. |
 |
 |
| Quadrant-wise count rates Data is divided into 100 sec bins |
 |
|
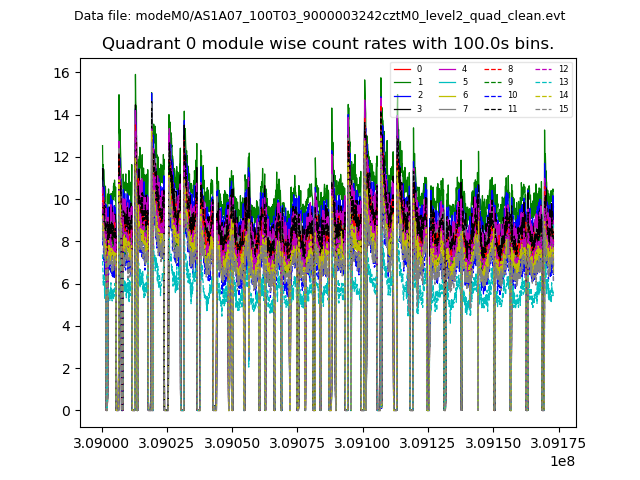
| Module-wise count rates for Quadrant A Data is divided into 100 sec bins |
 |
 |
| Module-wise count rates for Quadrant B Data is divided into 100 sec bins |
 |
 |
| Module-wise count rates for Quadrant C Data is divided into 100 sec bins |
 |
 |
| Module-wise count rates for Quadrant D Data is divided into 100 sec bins |
 |
 |
| Parameter | Plot |
|---|---|
| CZT HV Monitor |  |
| D_VDD |  |
| Temperature 1 |  |
| Veto HV Monitor |  |
| Veto LLD |  |
| Alpha Counter |  |
| _CPM_Rate | 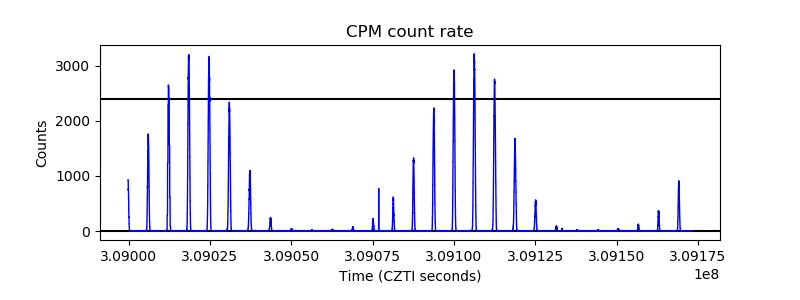 |
| CZT Counter | 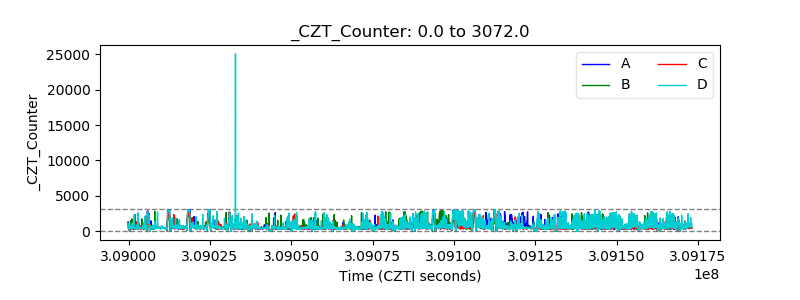 |
| +2.5 Volts monitor |  |
| +5 Volts monitor |  |
| _ROLL_ROT |  |
| _Roll_DEC |  |
| _Roll_RA |  |
| Veto Counter |  |