| Param | Original file | Final file |
|---|---|---|
| Filename | modeM0/AS1A07_100T03_9000003242_21909cztM0_level2.evt | modeM0/AS1A07_100T03_9000003242_21909cztM0_level2_quad_clean.evt |
| Size (bytes) | 108,005,760 | 29,476,800 |
| Size | 103.0 MB | 28.1 MB |
| Events in quadrant A | 827,500 | 198,570 |
| Events in quadrant B | 856,620 | 201,074 |
| Events in quadrant C | 756,138 | 192,303 |
| Events in quadrant D | 726,703 | 189,944 |
| Mode M0 | |||
|---|---|---|---|
| Quadrant | BADHDUFLAG | Total packets | Discarded packets |
| A | 0 | 3295 | 1 |
| B | 0 | 3385 | 1 |
| C | 0 | 3122 | 1 |
| D | 0 | 3071 | 1 |
| Mode SS | |||
|---|---|---|---|
| Quadrant | BADHDUFLAG | Total packets | Discarded packets |
| A | 0 | 30 | 0 |
| B | 0 | 30 | 0 |
| C | 0 | 30 | 0 |
| D | 0 | 30 | 0 |
| Mode M9 | |||
|---|---|---|---|
| Quadrant | BADHDUFLAG | Total packets | Discarded packets |
| A | 0 | 5 | 0 |
| B | 0 | 5 | 0 |
| C | 0 | 5 | 0 |
| D | 0 | 5 | 0 |
| Quadrant | Total seconds | Saturated seconds | Saturation percentage |
|---|---|---|---|
| A | 1487 | 14 | 0.941493% |
| B | 1487 | 27 | 1.815736% |
| C | 1487 | 18 | 1.210491% |
| D | 1487 | 2 | 0.134499% |
Noise dominated data is calculated using 1-second bins in cleaned event files. If a bin has >2000 counts, and if more than 50% of those come from <1% of pixels, then it is considered to be noise-dominated and hence unusable.
| Quadrant | # 1 sec bins | Bins with >0 counts | Bins with >2000 counts | High rate bins dominated by noise | Noise dominated (total time) | Noise dominated (detector-on time) | Marked lightcurve |
|---|---|---|---|---|---|---|---|
| A | 1487 | 1487 | 9 | 9 | 0.61% | 0.61% |  |
| B | 1487 | 1487 | 20 | 20 | 1.34% | 1.34% |  |
| C | 1487 | 1487 | 0 | 0 | 0.00% | 0.00% | 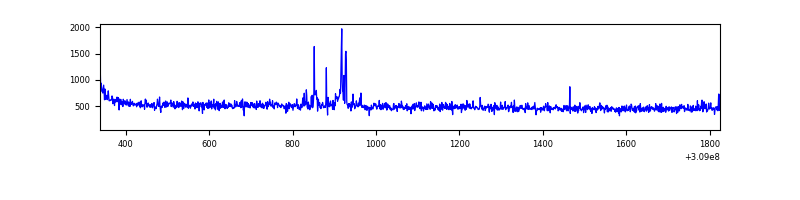 |
| D | 1487 | 1487 | 1 | 1 | 0.07% | 0.07% |  |
Top three noisy pixels from each quadrant. If the there are fewer than three noisy pixels in the level2.evt file, extra rows are filled as -1
| Pixel properties | Quadrant properties | ||||||
|---|---|---|---|---|---|---|---|
| Quadrant | DetID | PixID | Counts | Sigma | Mean | Median | Sigma |
| A | 4 | 2 | 73899 | 1807.97 | 194 | 191 | 40.8 |
| A | 13 | 254 | 2577 | 58.53 | 194 | 191 | 40.8 |
| A | 0 | 226 | 1736 | 37.9 | 194 | 191 | 40.8 |
| B | 3 | 64 | 102564 | 2690.46 | 189 | 185 | 38.1 |
| B | 0 | 197 | 8779 | 225.85 | 189 | 185 | 38.1 |
| B | 12 | 111 | 4441 | 111.85 | 189 | 185 | 38.1 |
| C | 14 | 238 | 29660 | 678.11 | 180 | 180 | 43.5 |
| C | 10 | 22 | 20755 | 473.27 | 180 | 180 | 43.5 |
| C | 0 | 10 | 3103 | 67.24 | 180 | 180 | 43.5 |
| D | 1 | 52 | 8295 | 176.11 | 184 | 178 | 46.1 |
| D | 2 | 136 | 5945 | 125.13 | 184 | 178 | 46.1 |
| D | 2 | 234 | 5593 | 117.49 | 184 | 178 | 46.1 |
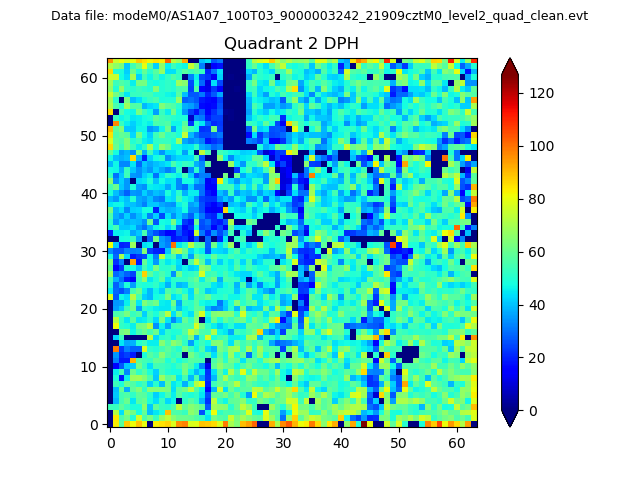
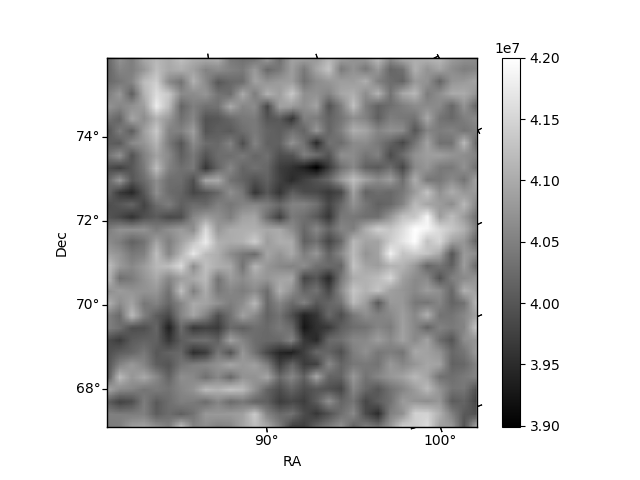
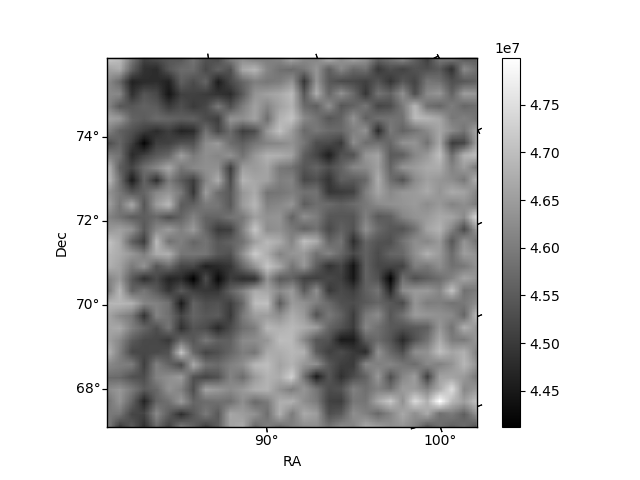
Histogram calculated using DETX and DETY for each event in the final _common_clean file
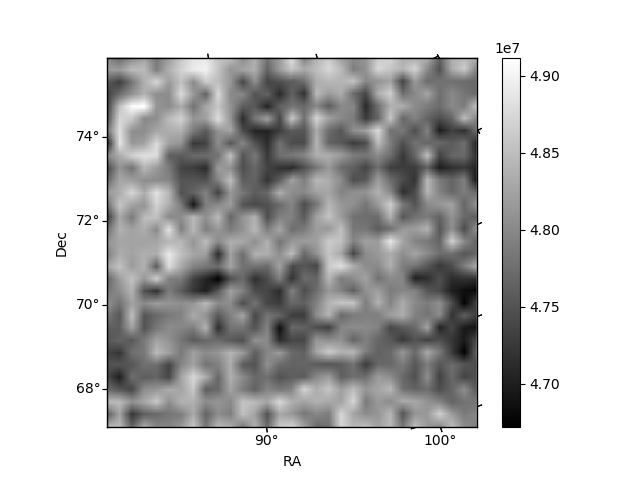
| Quadrant A | 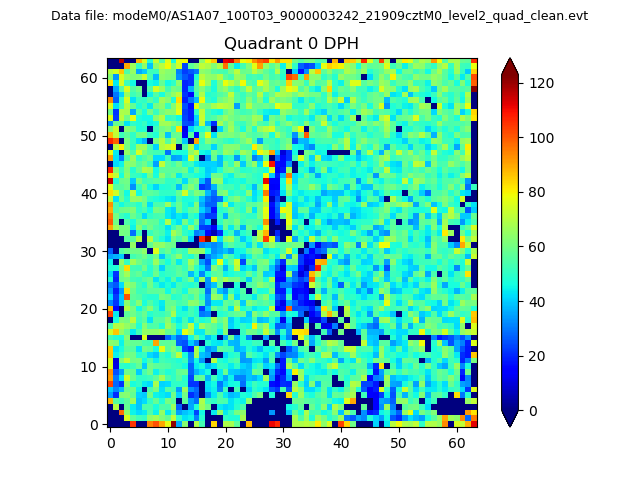 |
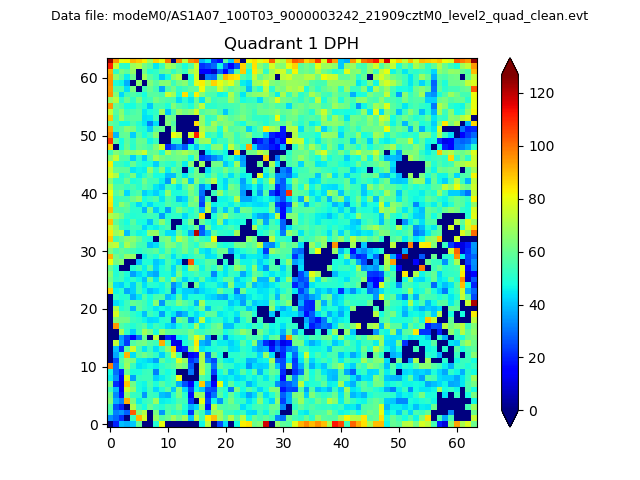 |
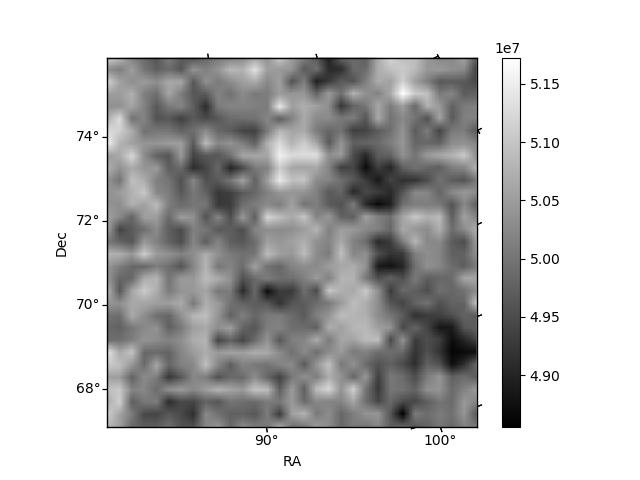
Quadrant B |
|---|---|---|---|
| Quadrant D | 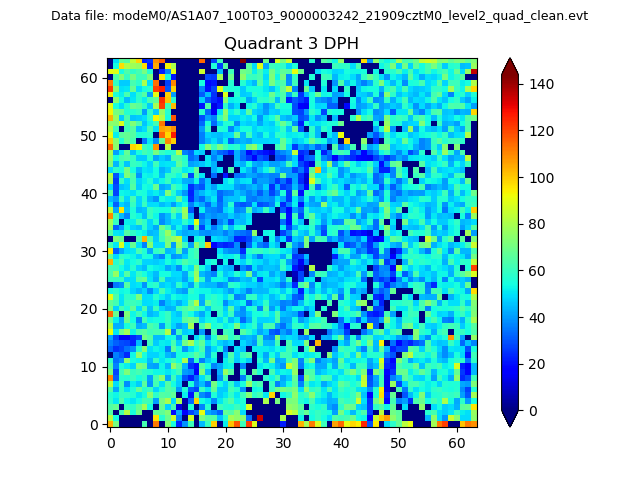 |
 |
Quadrant C |
| Plot type | Count rate plots | Images |
|---|---|---|
| Comparison with Poisson distribution Blue bars denote a histogram of data divided into 1 sec bins. Red curve is a Poisson curve with rate = median count rate of data. |
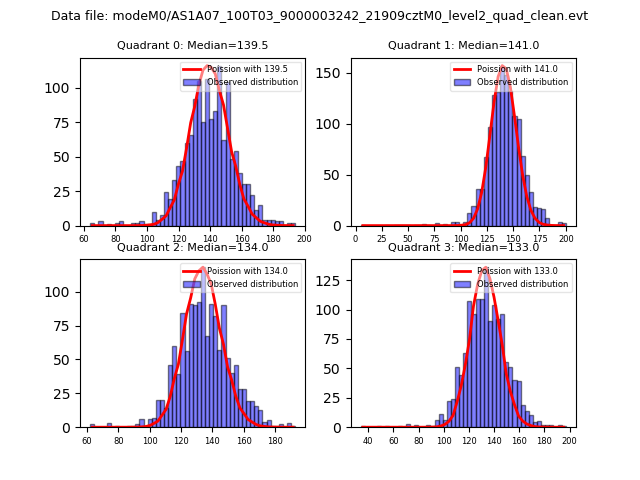 |
 |
| Quadrant-wise count rates Data is divided into 100 sec bins |
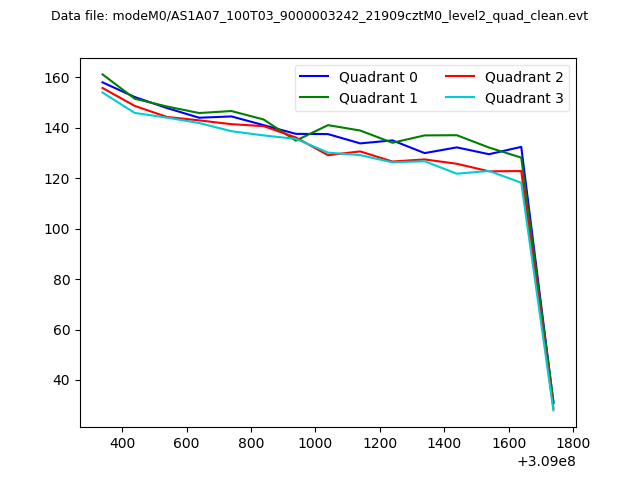 |
|
| Module-wise count rates for Quadrant A Data is divided into 100 sec bins |
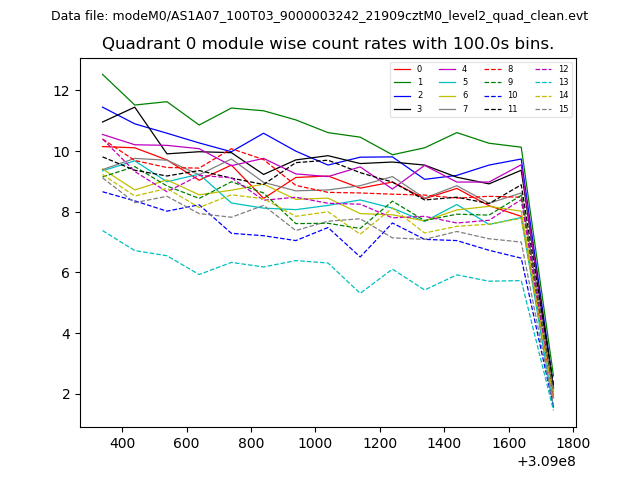 |
 |
| Module-wise count rates for Quadrant B Data is divided into 100 sec bins |
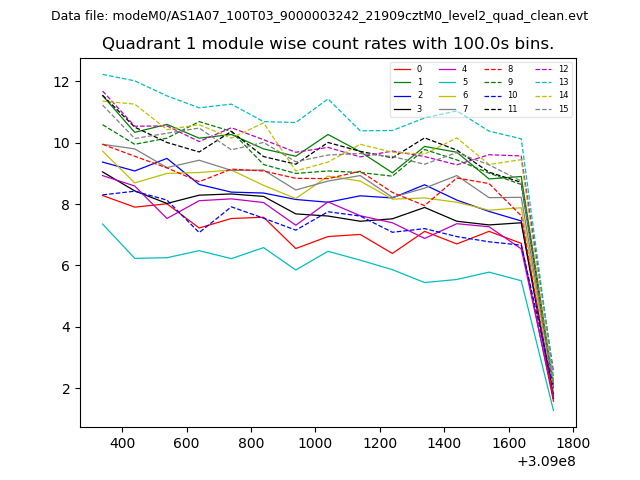 |
 |
| Module-wise count rates for Quadrant C Data is divided into 100 sec bins |
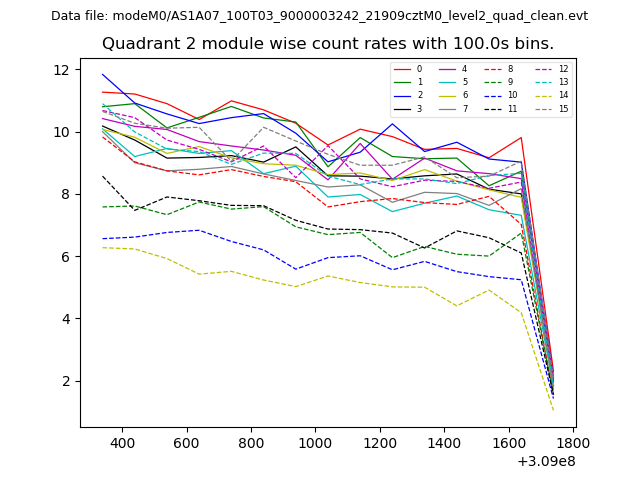 |
 |
| Module-wise count rates for Quadrant D Data is divided into 100 sec bins |
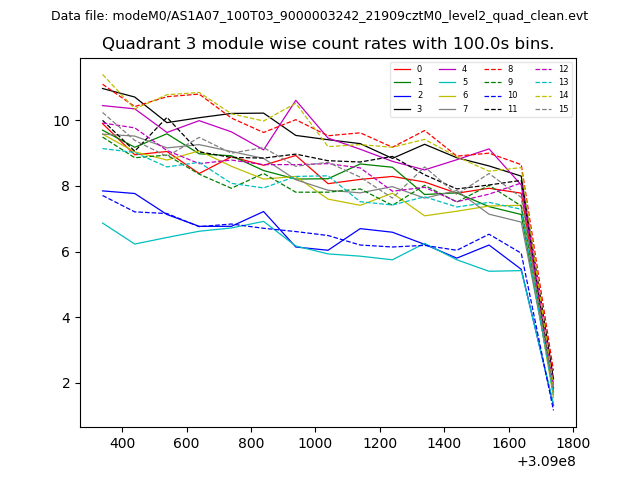 |
 |
| Parameter | Plot |
|---|---|
| CZT HV Monitor | 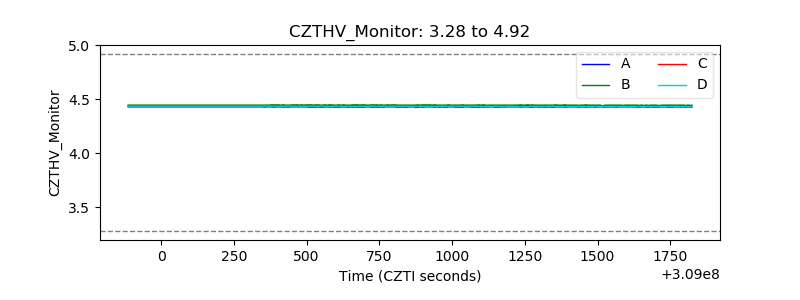 |
| D_VDD | 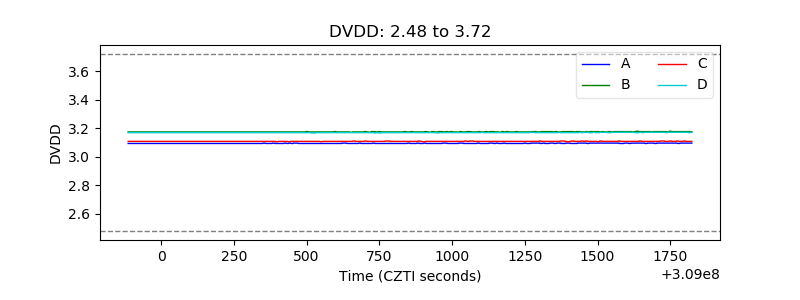 |
| Temperature 1 | 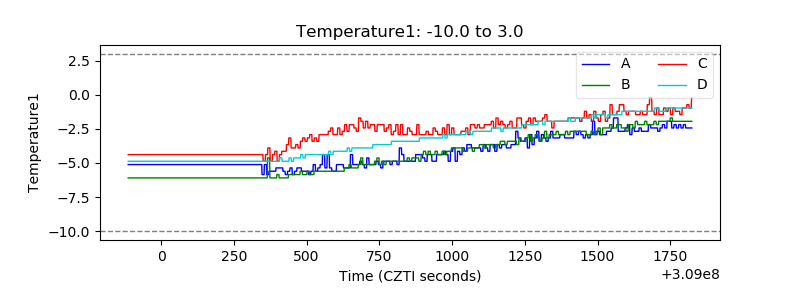 |
| Veto HV Monitor | 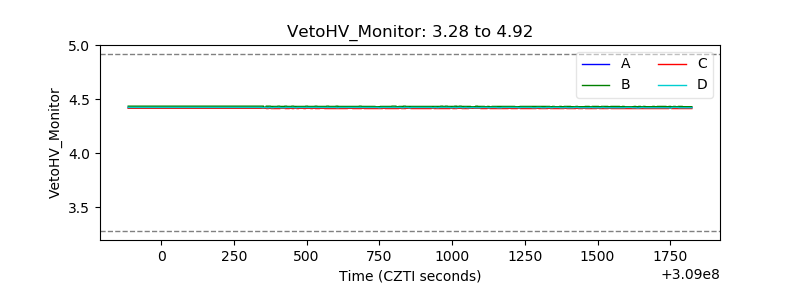 |
| Veto LLD | 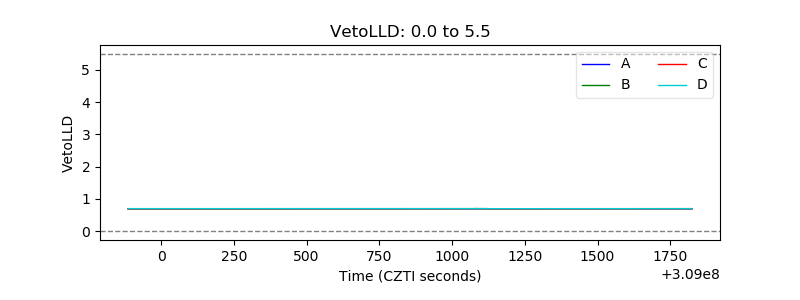 |
| Alpha Counter | 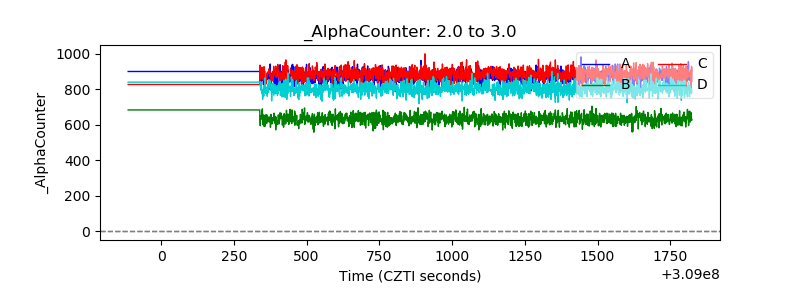 |
| _CPM_Rate | 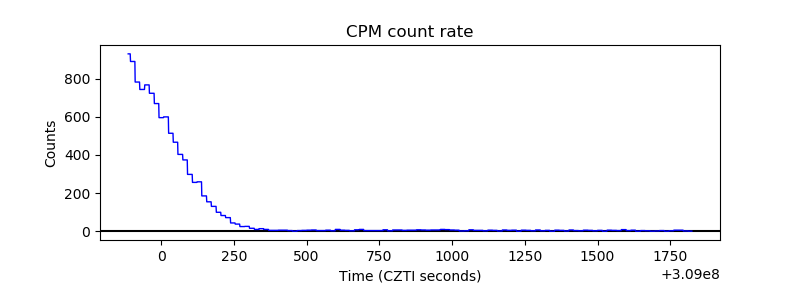 |
| CZT Counter | 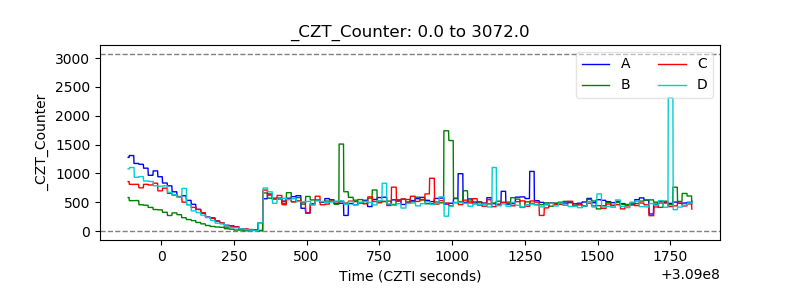 |
| +2.5 Volts monitor |  |
| +5 Volts monitor |  |
| _ROLL_ROT | 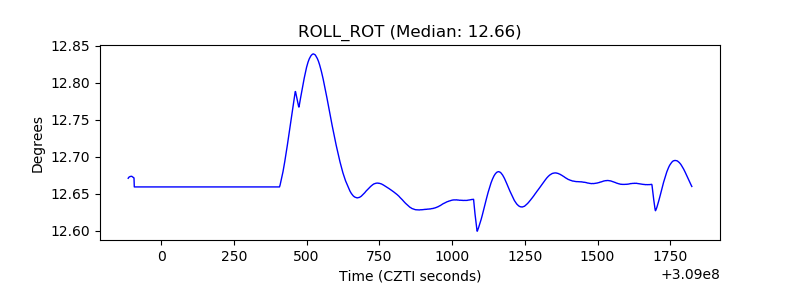 |
| _Roll_DEC | 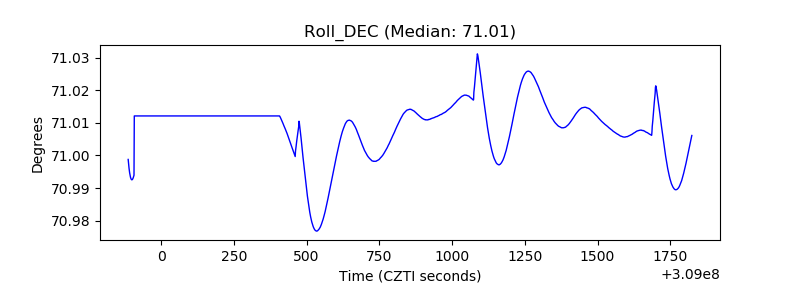 |
| _Roll_RA | 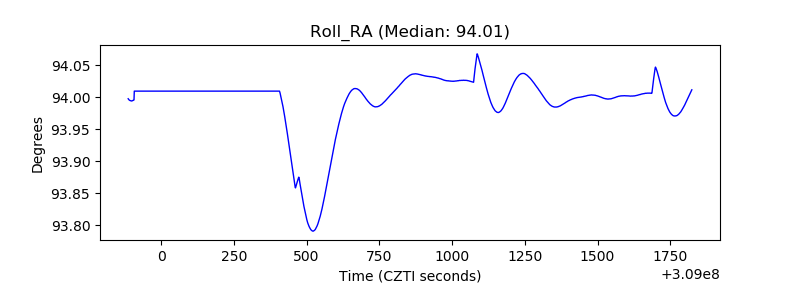 |
| Veto Counter | 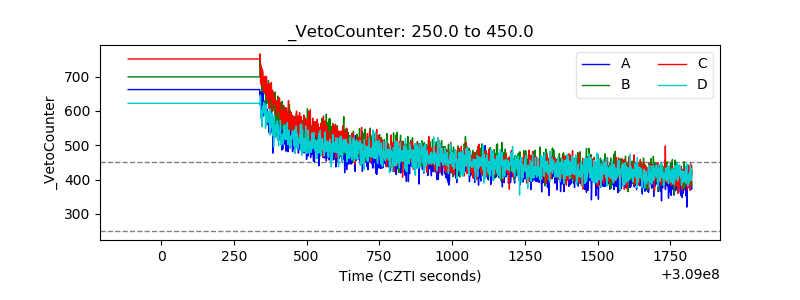 |