| Param | Original file | Final file |
|---|---|---|
| Filename | modeM0/AS1A07_100T03_9000003242_21910cztM0_level2.evt | modeM0/AS1A07_100T03_9000003242_21910cztM0_level2_quad_clean.evt |
| Size (bytes) | 477,665,280 | 115,663,680 |
| Size | 455.5 MB | 110.3 MB |
| Events in quadrant A | 3,564,034 | 770,568 |
| Events in quadrant B | 3,576,423 | 776,759 |
| Events in quadrant C | 3,412,261 | 746,206 |
| Events in quadrant D | 3,453,208 | 737,281 |
| Mode M0 | |||
|---|---|---|---|
| Quadrant | BADHDUFLAG | Total packets | Discarded packets |
| A | 0 | 14947 | 2 |
| B | 0 | 14875 | 2 |
| C | 0 | 14324 | 2 |
| D | 0 | 14654 | 2 |
| Mode SS | |||
|---|---|---|---|
| Quadrant | BADHDUFLAG | Total packets | Discarded packets |
| A | 0 | 138 | 0 |
| B | 0 | 138 | 0 |
| C | 0 | 138 | 0 |
| D | 0 | 138 | 0 |
| Mode M9 | |||
|---|---|---|---|
| Quadrant | BADHDUFLAG | Total packets | Discarded packets |
| A | 0 | 11 | 0 |
| B | 0 | 11 | 0 |
| C | 0 | 11 | 0 |
| D | 0 | 11 | 0 |
| Quadrant | Total seconds | Saturated seconds | Saturation percentage |
|---|---|---|---|
| A | 6775 | 82 | 1.210332% |
| B | 6775 | 119 | 1.756458% |
| C | 6775 | 90 | 1.328413% |
| D | 6775 | 70 | 1.033210% |
Noise dominated data is calculated using 1-second bins in cleaned event files. If a bin has >2000 counts, and if more than 50% of those come from <1% of pixels, then it is considered to be noise-dominated and hence unusable.
| Quadrant | # 1 sec bins | Bins with >0 counts | Bins with >2000 counts | High rate bins dominated by noise | Noise dominated (total time) | Noise dominated (detector-on time) | Marked lightcurve |
|---|---|---|---|---|---|---|---|
| A | 7835 | 6775 | 11 | 11 | 0.14% | 0.16% | 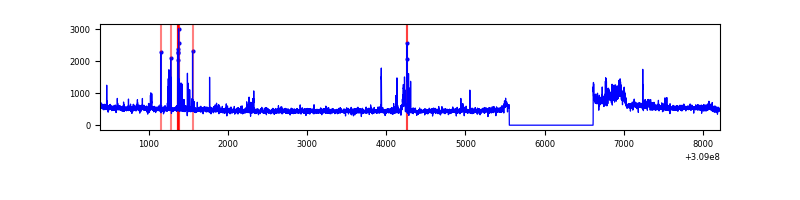 |
| B | 7835 | 6775 | 48 | 48 | 0.61% | 0.71% | 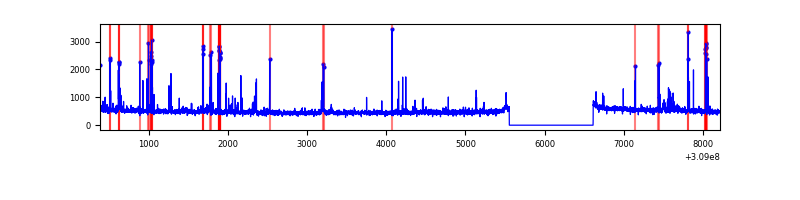 |
| C | 7835 | 6775 | 3 | 3 | 0.04% | 0.04% |  |
| D | 7835 | 6775 | 25 | 25 | 0.32% | 0.37% | 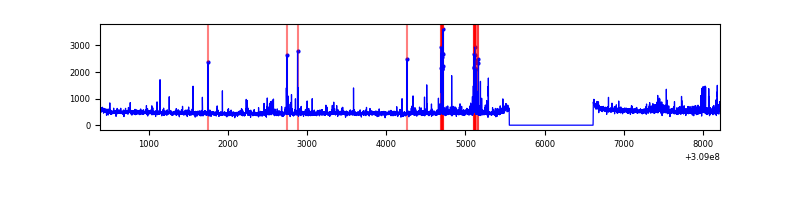 |
Top three noisy pixels from each quadrant. If the there are fewer than three noisy pixels in the level2.evt file, extra rows are filled as -1
| Pixel properties | Quadrant properties | ||||||
|---|---|---|---|---|---|---|---|
| Quadrant | DetID | PixID | Counts | Sigma | Mean | Median | Sigma |
| A | 5 | 16 | 165133 | 978.65 | 843 | 826 | 167.9 |
| A | 4 | 2 | 127673 | 755.53 | 843 | 826 | 167.9 |
| A | 10 | 17 | 20414 | 116.67 | 843 | 826 | 167.9 |
| B | 3 | 64 | 240730 | 1537.84 | 829 | 810 | 156.0 |
| B | 0 | 197 | 43173 | 271.54 | 829 | 810 | 156.0 |
| B | 0 | 190 | 25220 | 156.46 | 829 | 810 | 156.0 |
| C | 10 | 22 | 155857 | 835.55 | 802 | 808 | 185.6 |
| C | 14 | 238 | 128528 | 688.27 | 802 | 808 | 185.6 |
| C | 13 | 61 | 5639 | 26.03 | 802 | 808 | 185.6 |
| D | 1 | 52 | 236913 | 1199.1 | 817 | 794 | 196.9 |
| D | 2 | 136 | 40436 | 201.32 | 817 | 794 | 196.9 |
| D | 0 | 11 | 33360 | 165.38 | 817 | 794 | 196.9 |
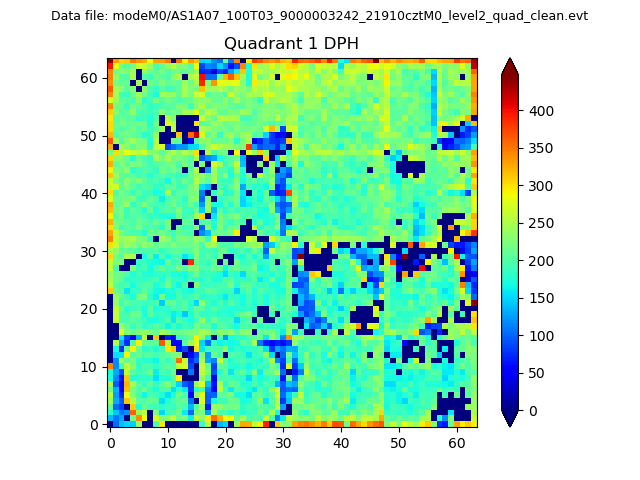
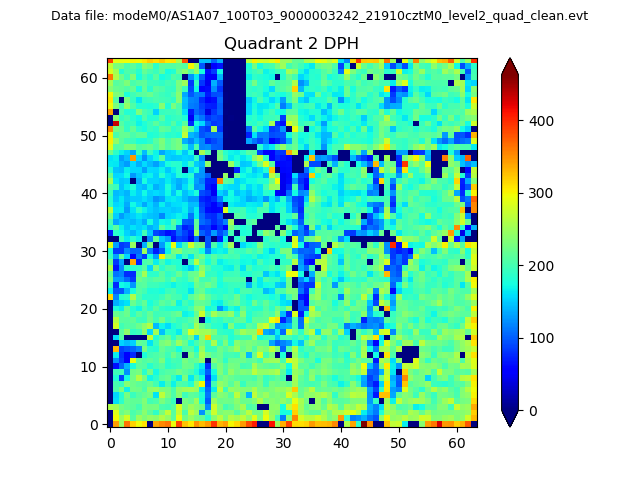
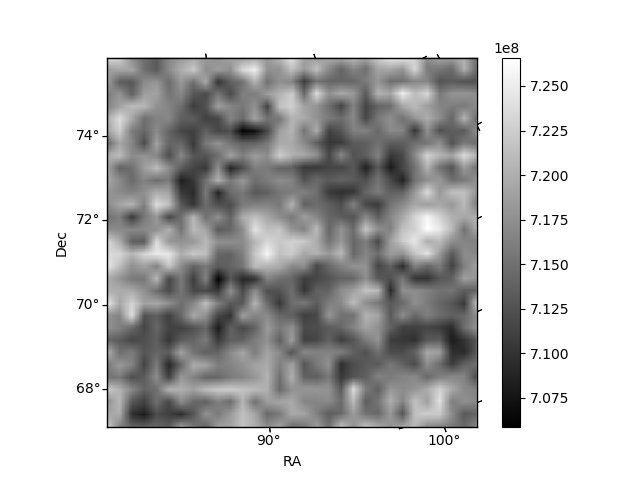
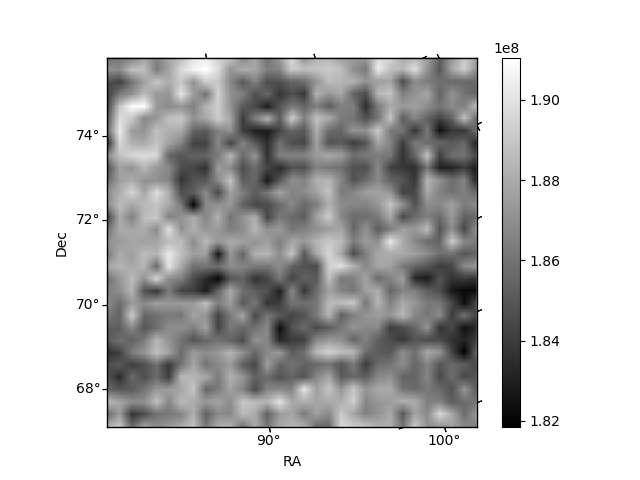
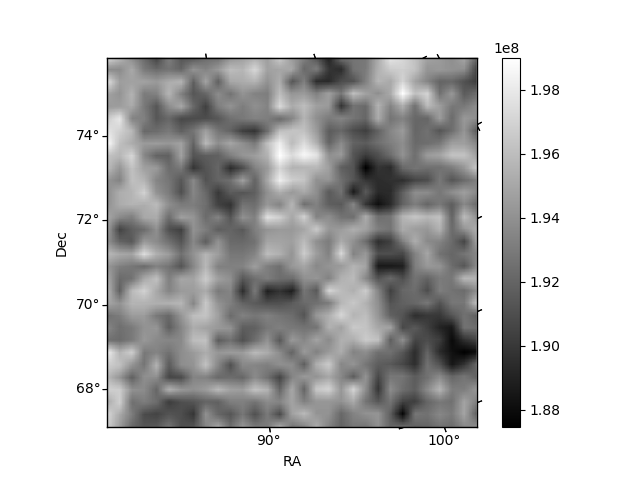
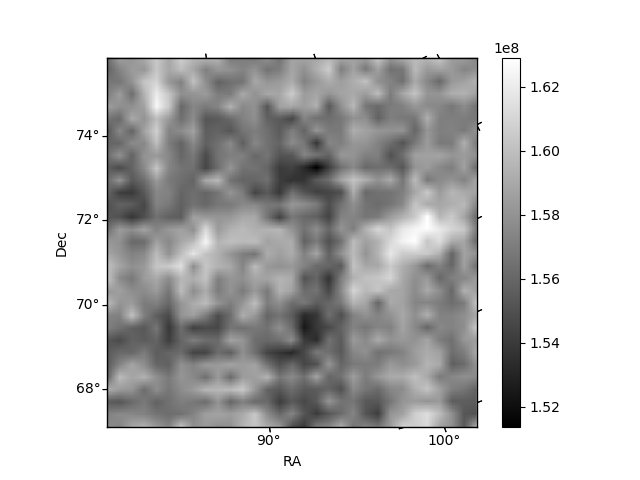
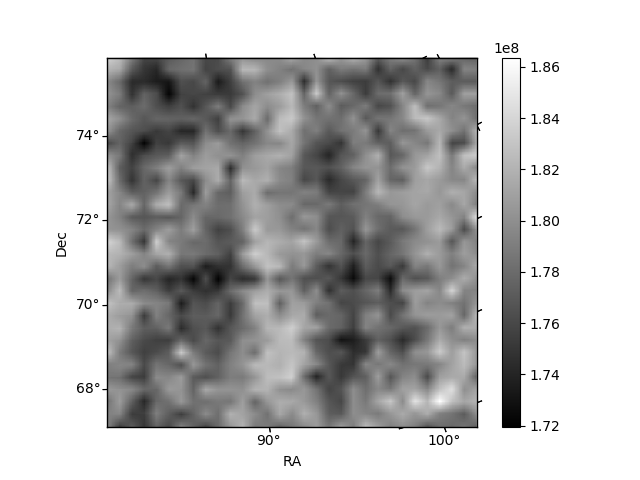
Histogram calculated using DETX and DETY for each event in the final _common_clean file
| Quadrant A | 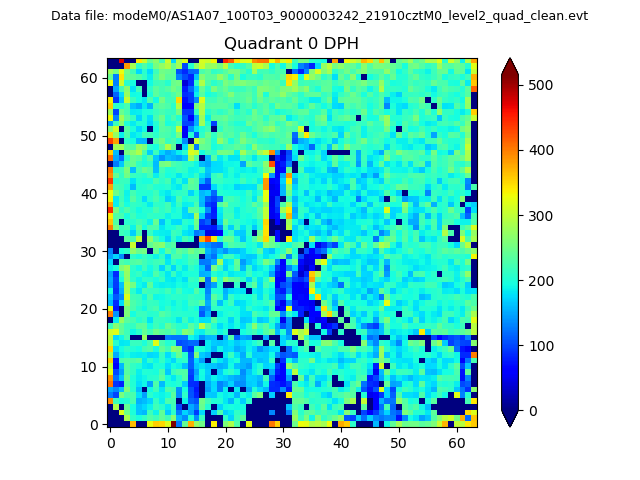 |
 |
Quadrant B |
|---|---|---|---|
| Quadrant D | 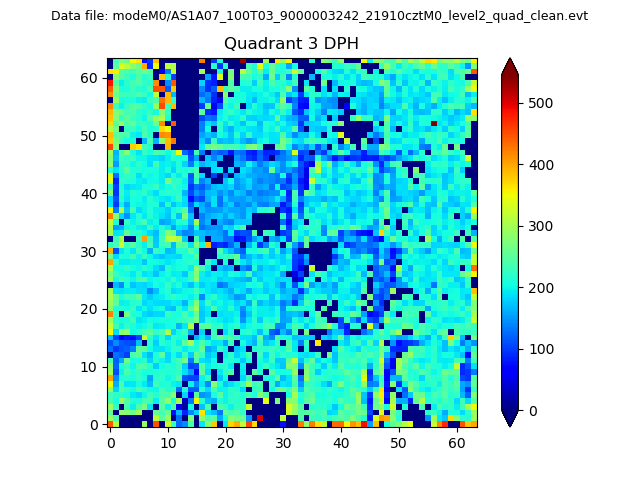 |
 |
Quadrant C |
| Plot type | Count rate plots | Images |
|---|---|---|
| Comparison with Poisson distribution Blue bars denote a histogram of data divided into 1 sec bins. Red curve is a Poisson curve with rate = median count rate of data. |
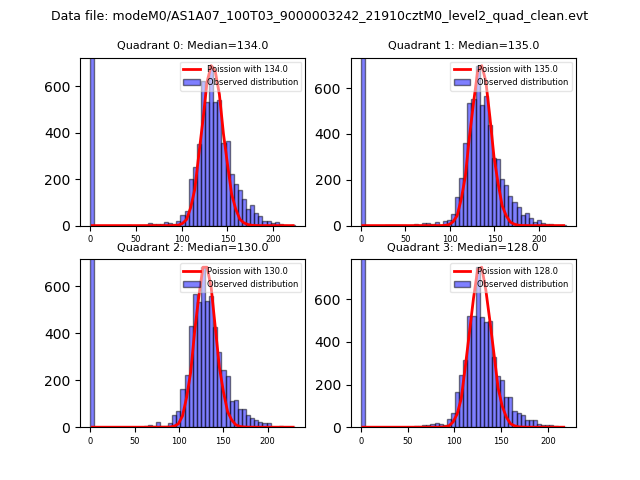 |
 |
| Quadrant-wise count rates Data is divided into 100 sec bins |
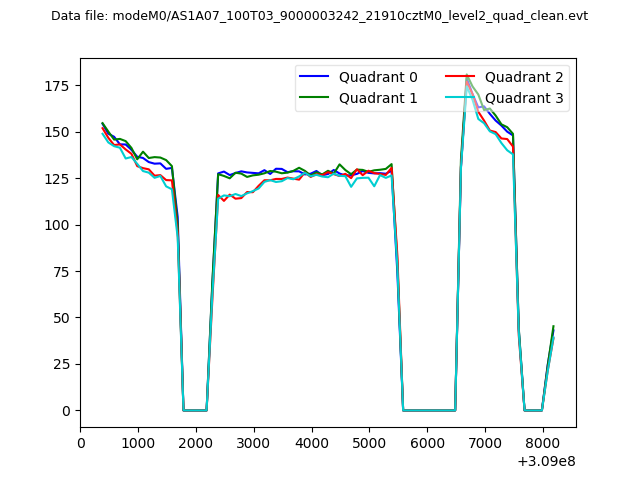 |
|
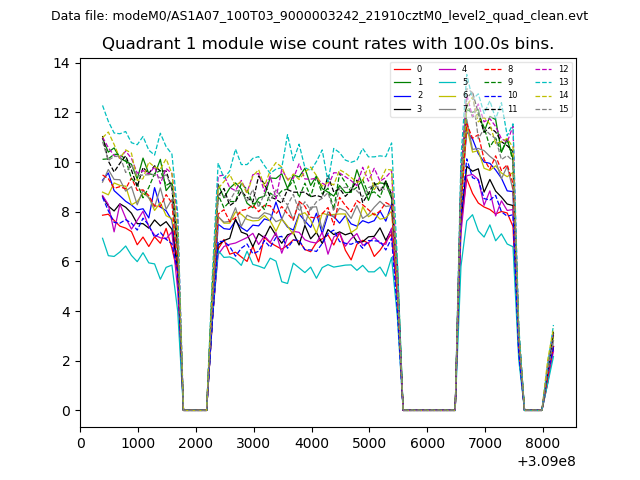
| Module-wise count rates for Quadrant A Data is divided into 100 sec bins |
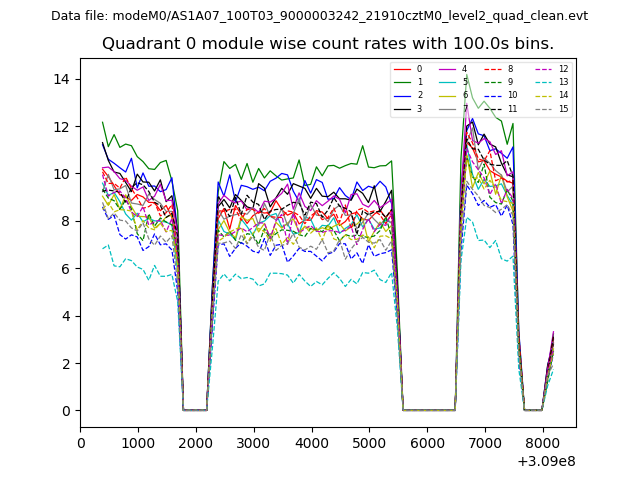 |
 |
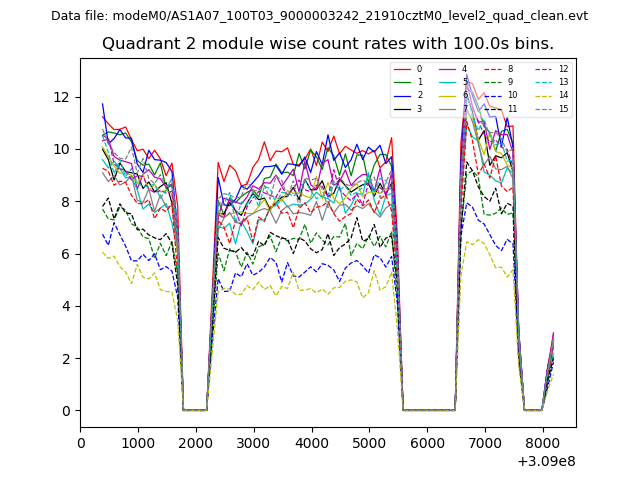
| Module-wise count rates for Quadrant B Data is divided into 100 sec bins |
 |
 |
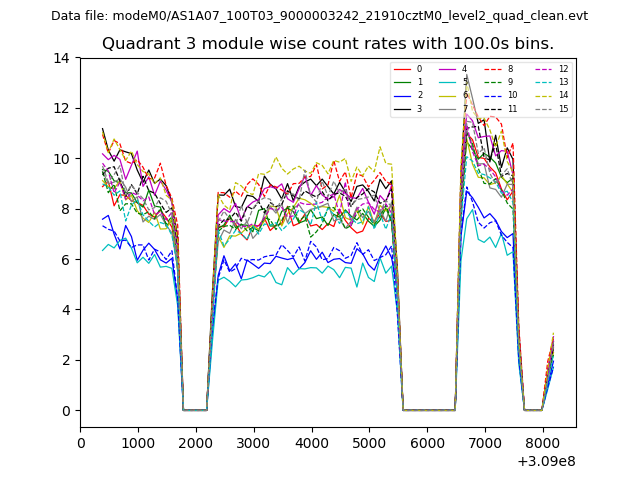
| Module-wise count rates for Quadrant C Data is divided into 100 sec bins |
 |
 |
| Module-wise count rates for Quadrant D Data is divided into 100 sec bins |
 |
 |
| Parameter | Plot |
|---|---|
| CZT HV Monitor | 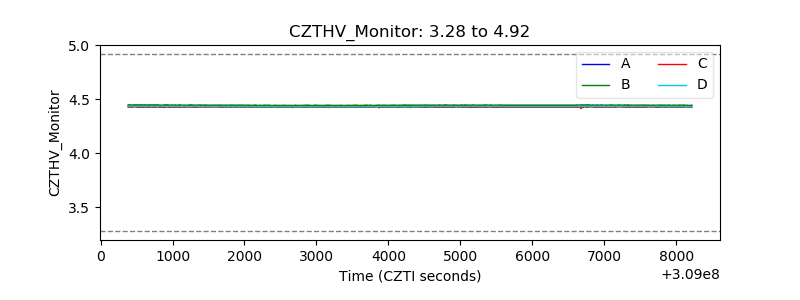 |
| D_VDD | 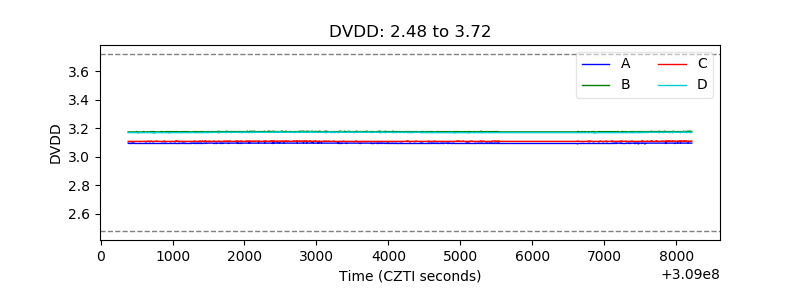 |
| Temperature 1 | 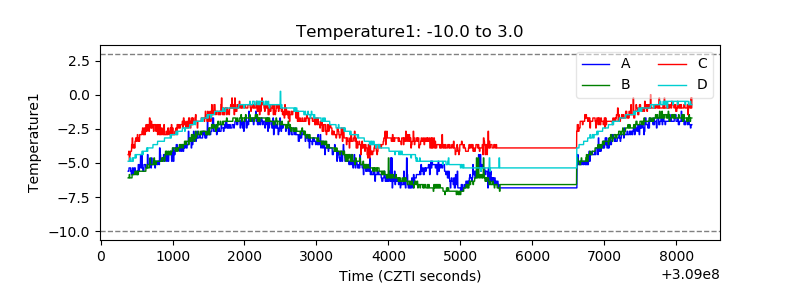 |
| Veto HV Monitor | 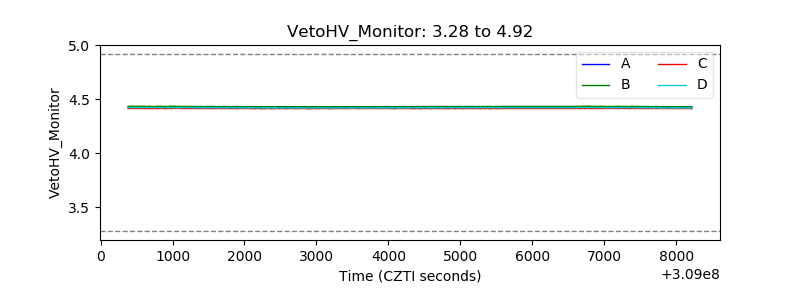 |
| Veto LLD | 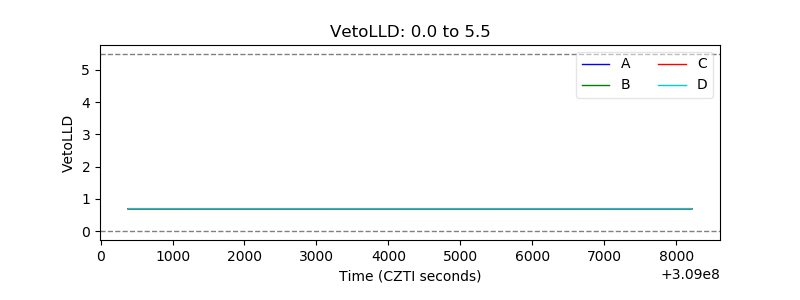 |
| Alpha Counter | 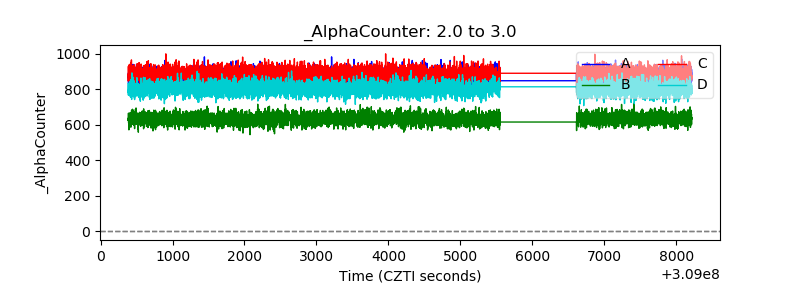 |
| _CPM_Rate | 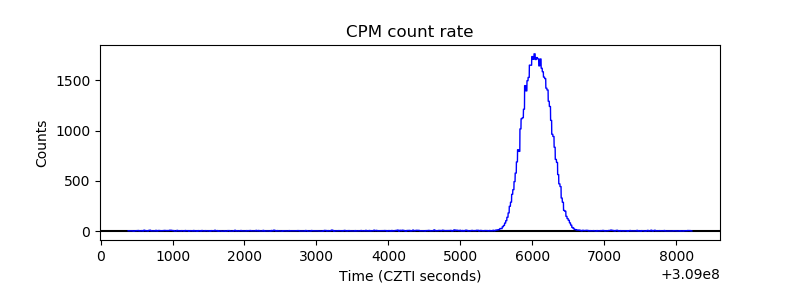 |
| CZT Counter | 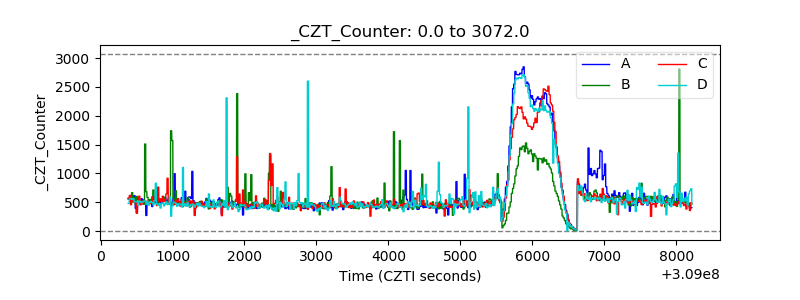 |
| +2.5 Volts monitor |  |
| +5 Volts monitor |  |
| _ROLL_ROT | 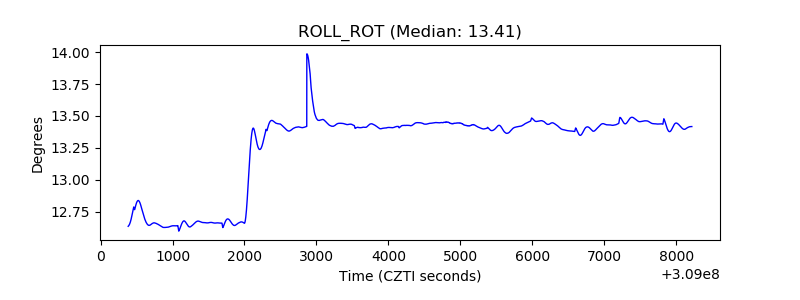 |
| _Roll_DEC | 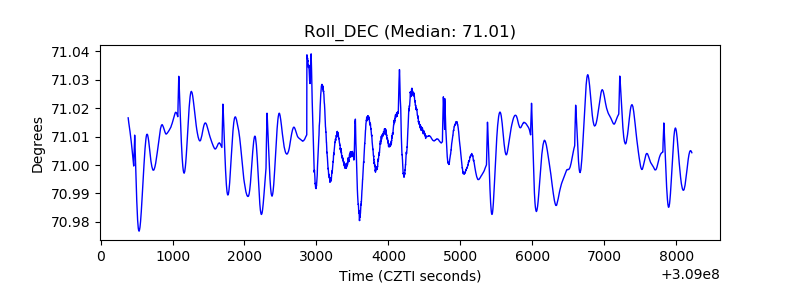 |
| _Roll_RA | 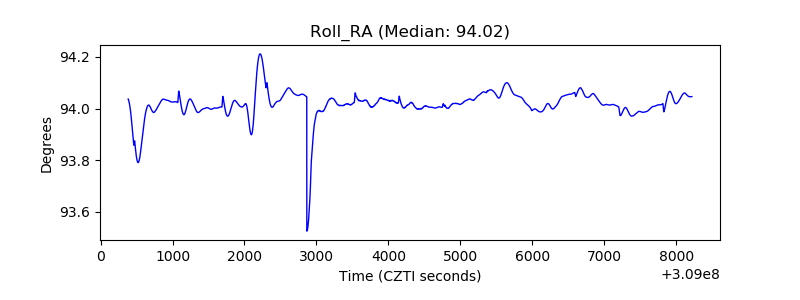 |
| Veto Counter | 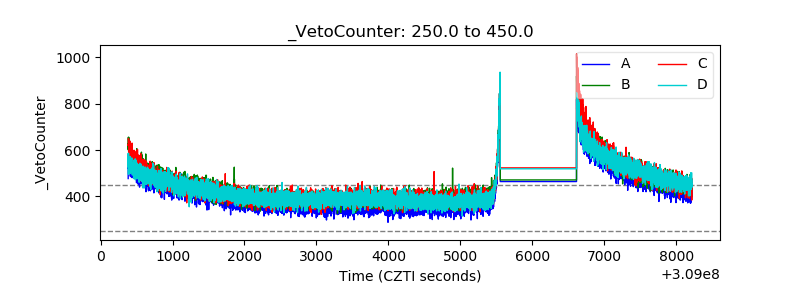 |