| Param | Original file | Final file |
|---|---|---|
| Filename | modeM0/AS1A07_100T03_9000003242_21912cztM0_level2.evt | modeM0/AS1A07_100T03_9000003242_21912cztM0_level2_quad_clean.evt |
| Size (bytes) | 433,491,840 | 100,794,240 |
| Size | 413.4 MB | 96.1 MB |
| Events in quadrant A | 2,899,164 | 675,762 |
| Events in quadrant B | 3,117,956 | 678,214 |
| Events in quadrant C | 3,018,072 | 654,493 |
| Events in quadrant D | 3,696,985 | 636,647 |
| Mode M0 | |||
|---|---|---|---|
| Quadrant | BADHDUFLAG | Total packets | Discarded packets |
| A | 0 | 12414 | 1 |
| B | 0 | 13081 | 1 |
| C | 0 | 12699 | 1 |
| D | 0 | 14838 | 1 |
| Mode SS | |||
|---|---|---|---|
| Quadrant | BADHDUFLAG | Total packets | Discarded packets |
| A | 0 | 120 | 0 |
| B | 0 | 120 | 0 |
| C | 0 | 120 | 0 |
| D | 0 | 120 | 0 |
| Mode M9 | |||
|---|---|---|---|
| Quadrant | BADHDUFLAG | Total packets | Discarded packets |
| A | 0 | 12 | 0 |
| B | 0 | 12 | 0 |
| C | 0 | 12 | 0 |
| D | 0 | 12 | 0 |
| Quadrant | Total seconds | Saturated seconds | Saturation percentage |
|---|---|---|---|
| A | 5824 | 50 | 0.858516% |
| B | 5825 | 87 | 1.493562% |
| C | 5825 | 111 | 1.905579% |
| D | 5825 | 164 | 2.815451% |
Noise dominated data is calculated using 1-second bins in cleaned event files. If a bin has >2000 counts, and if more than 50% of those come from <1% of pixels, then it is considered to be noise-dominated and hence unusable.
| Quadrant | # 1 sec bins | Bins with >0 counts | Bins with >2000 counts | High rate bins dominated by noise | Noise dominated (total time) | Noise dominated (detector-on time) | Marked lightcurve |
|---|---|---|---|---|---|---|---|
| A | 7025 | 5824 | 0 | 0 | 0.00% | 0.00% | 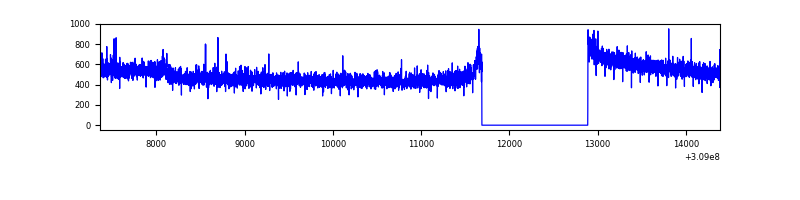 |
| B | 7026 | 5825 | 21 | 21 | 0.30% | 0.36% | 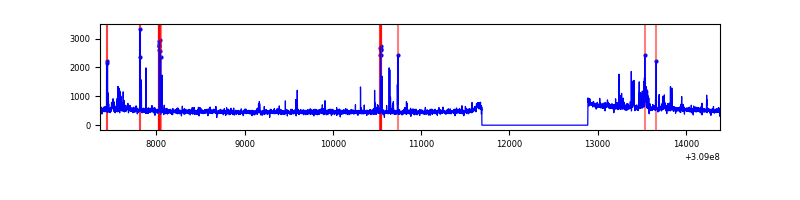 |
| C | 7026 | 5825 | 21 | 21 | 0.30% | 0.36% | 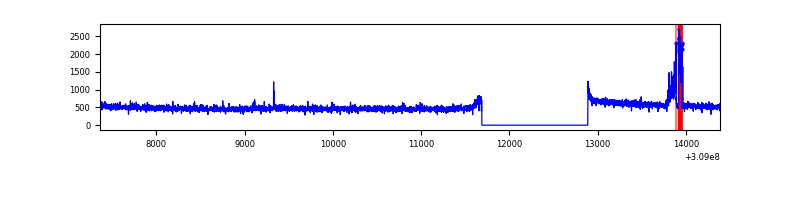 |
| D | 7026 | 5825 | 95 | 95 | 1.35% | 1.63% | 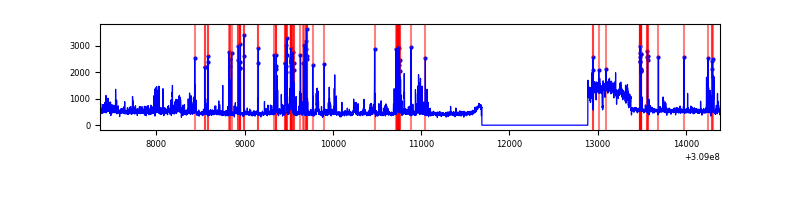 |
Top three noisy pixels from each quadrant. If the there are fewer than three noisy pixels in the level2.evt file, extra rows are filled as -1
| Pixel properties | Quadrant properties | ||||||
|---|---|---|---|---|---|---|---|
| Quadrant | DetID | PixID | Counts | Sigma | Mean | Median | Sigma |
| A | 10 | 17 | 19920 | 129.72 | 744 | 729 | 147.9 |
| A | 13 | 254 | 10915 | 68.85 | 744 | 729 | 147.9 |
| A | 5 | 16 | 10287 | 64.61 | 744 | 729 | 147.9 |
| B | 3 | 64 | 108836 | 793.68 | 735 | 718 | 136.2 |
| B | 0 | 197 | 83030 | 604.24 | 735 | 718 | 136.2 |
| B | 0 | 190 | 26083 | 186.2 | 735 | 718 | 136.2 |
| C | 10 | 22 | 118702 | 720.62 | 713 | 718 | 163.7 |
| C | 14 | 238 | 114354 | 694.06 | 713 | 718 | 163.7 |
| C | 13 | 61 | 4972 | 25.98 | 713 | 718 | 163.7 |
| D | 1 | 52 | 877457 | 5079.72 | 721 | 700 | 172.6 |
| D | 2 | 136 | 36717 | 208.67 | 721 | 700 | 172.6 |
| D | 2 | 234 | 25311 | 142.59 | 721 | 700 | 172.6 |
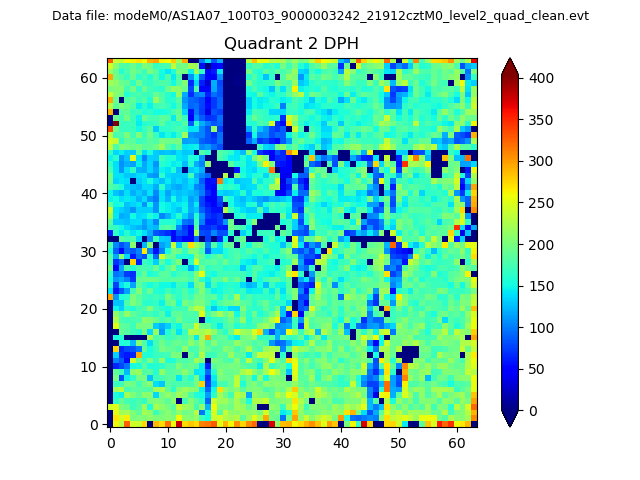
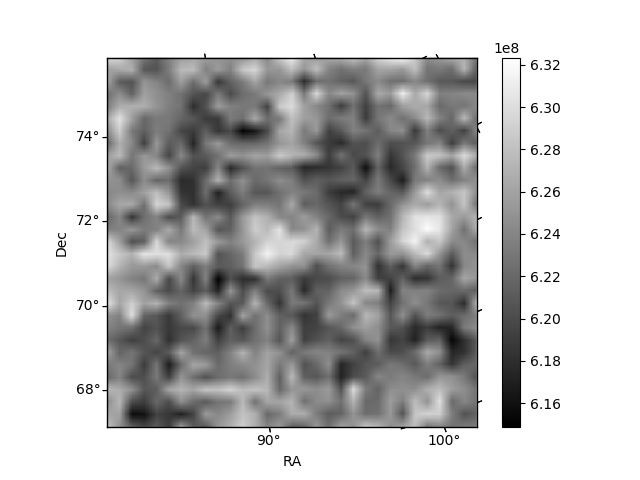
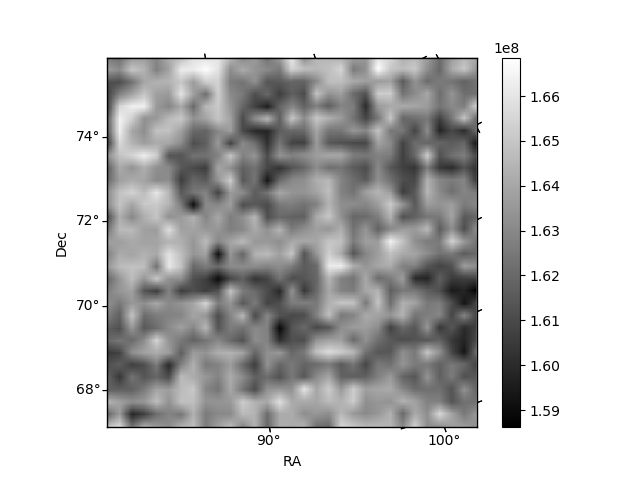
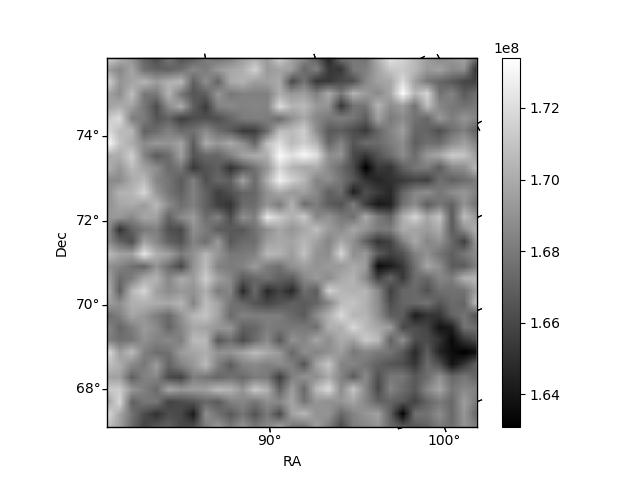
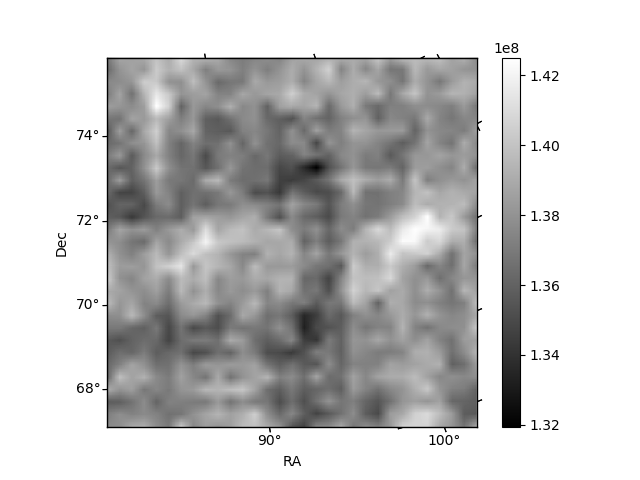
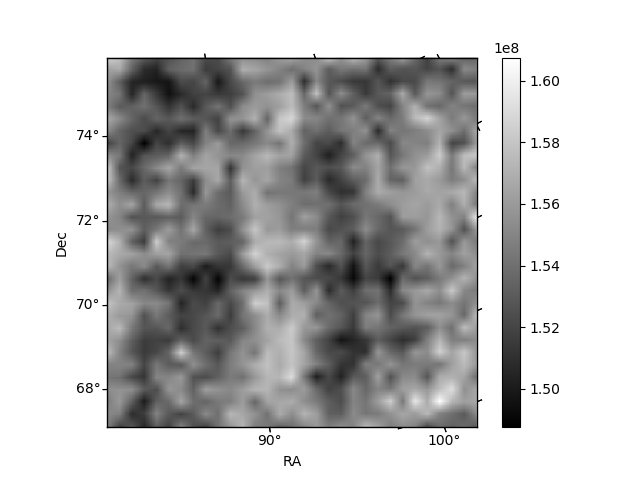
Histogram calculated using DETX and DETY for each event in the final _common_clean file
| Quadrant A | 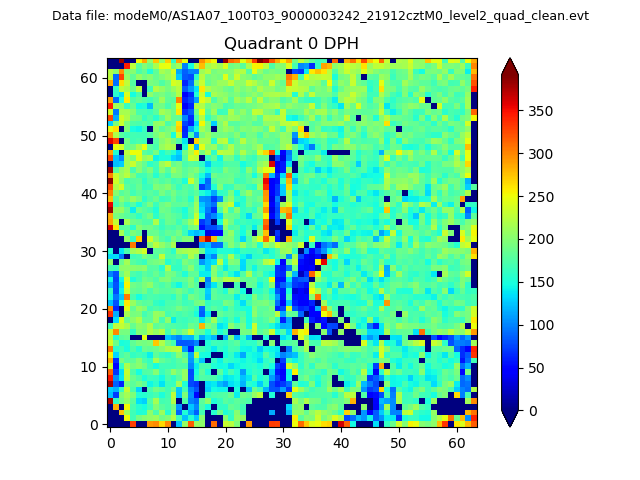 |
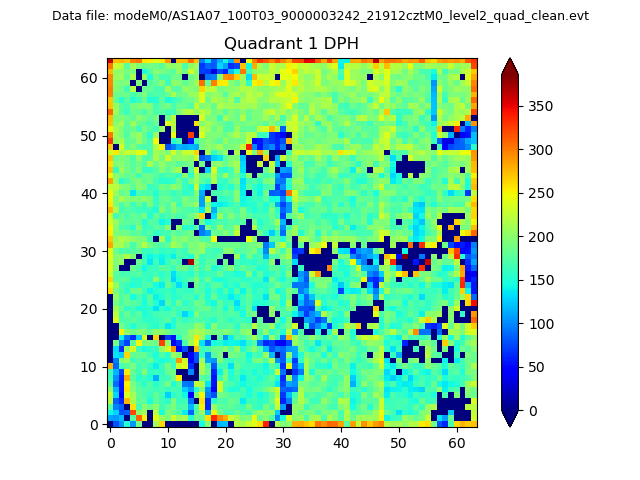 |
Quadrant B |
|---|---|---|---|
| Quadrant D | 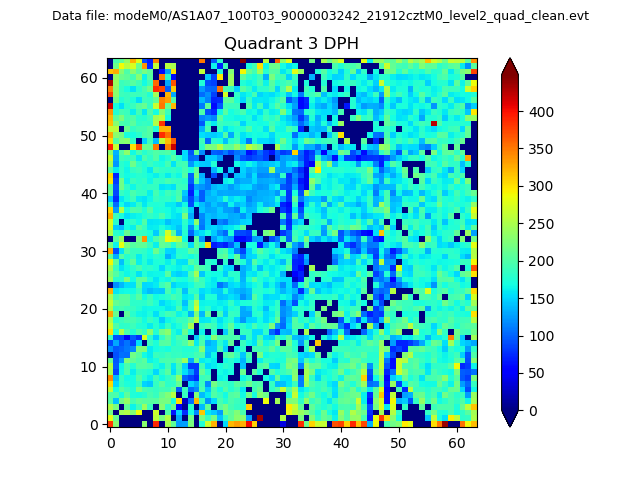 |
 |
Quadrant C |
| Plot type | Count rate plots | Images |
|---|---|---|
| Comparison with Poisson distribution Blue bars denote a histogram of data divided into 1 sec bins. Red curve is a Poisson curve with rate = median count rate of data. |
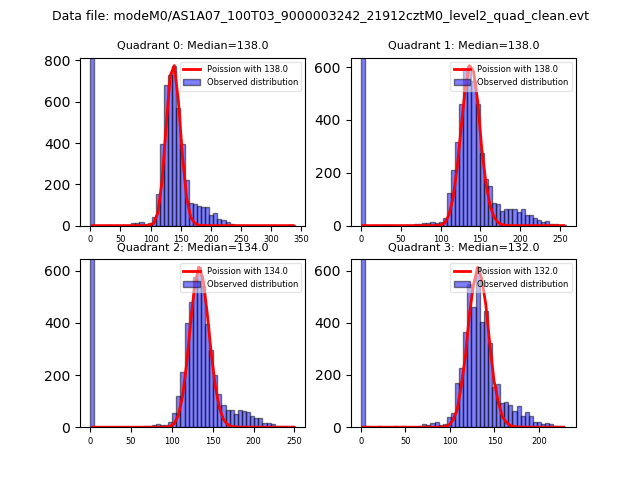 |
 |
| Quadrant-wise count rates Data is divided into 100 sec bins |
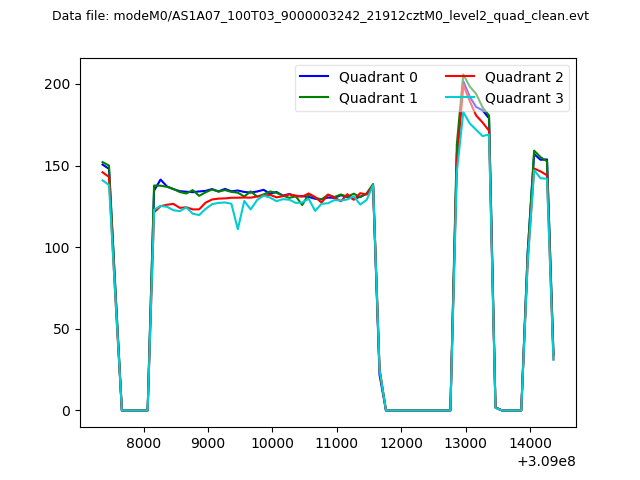 |
|
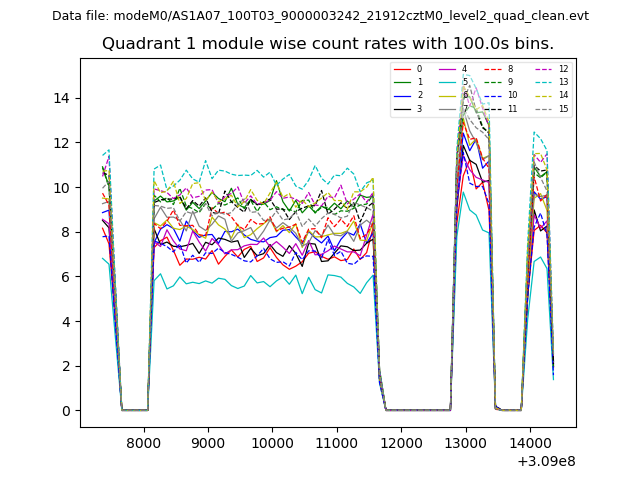
| Module-wise count rates for Quadrant A Data is divided into 100 sec bins |
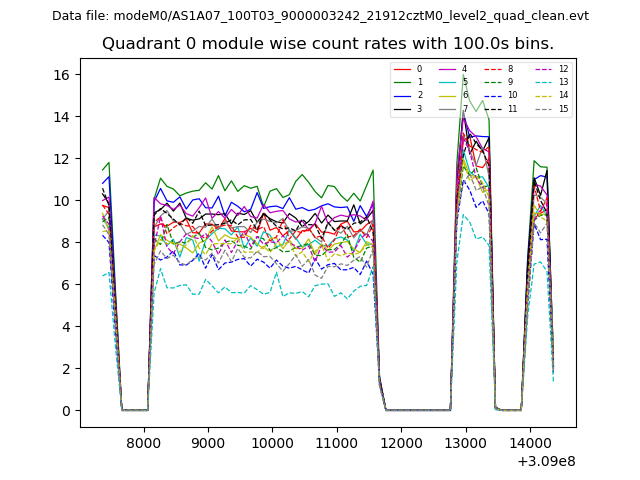 |
 |
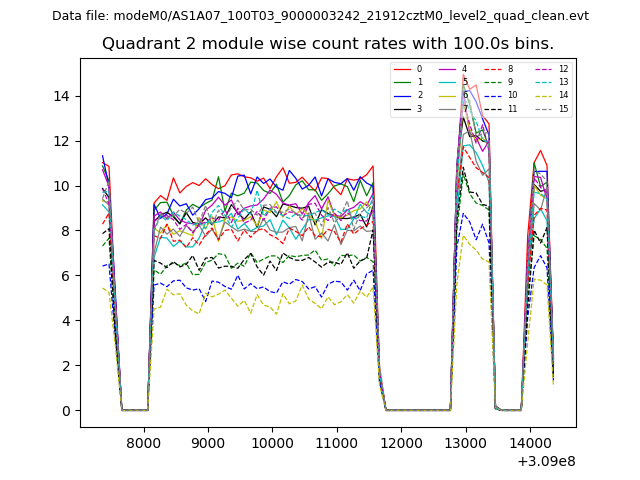
| Module-wise count rates for Quadrant B Data is divided into 100 sec bins |
 |
 |
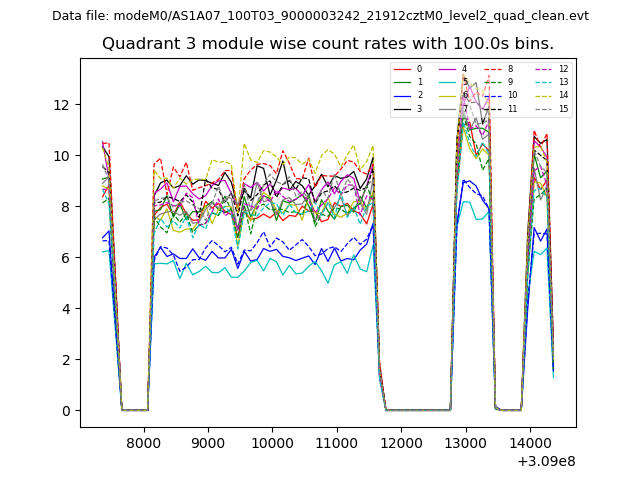
| Module-wise count rates for Quadrant C Data is divided into 100 sec bins |
 |
 |
| Module-wise count rates for Quadrant D Data is divided into 100 sec bins |
 |
 |
| Parameter | Plot |
|---|---|
| CZT HV Monitor | 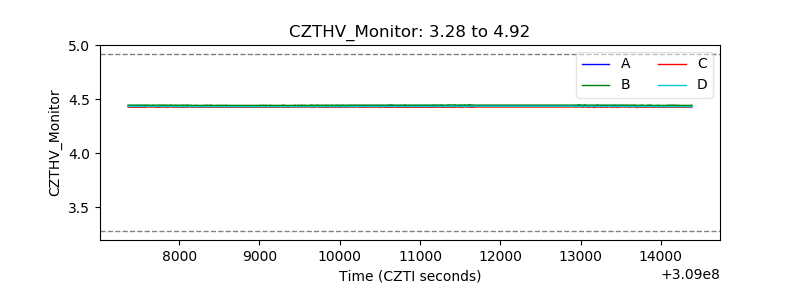 |
| D_VDD | 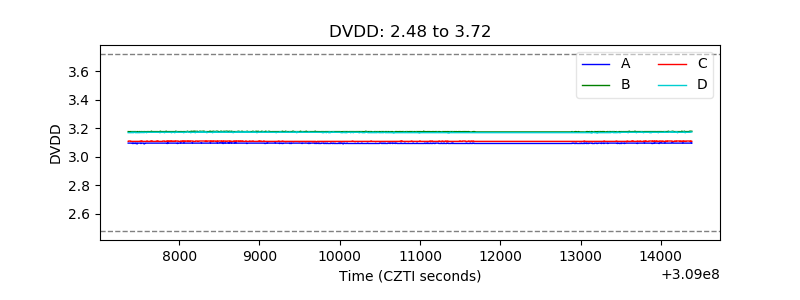 |
| Temperature 1 | 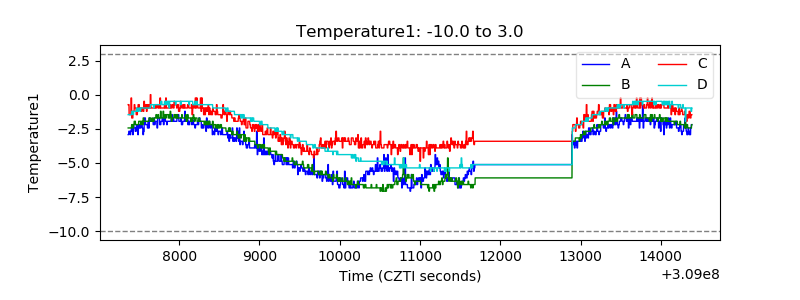 |
| Veto HV Monitor | 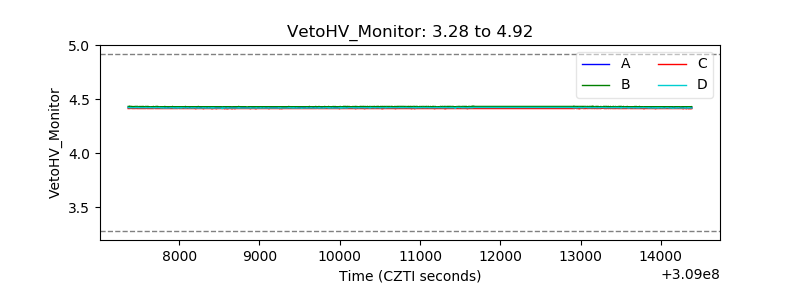 |
| Veto LLD | 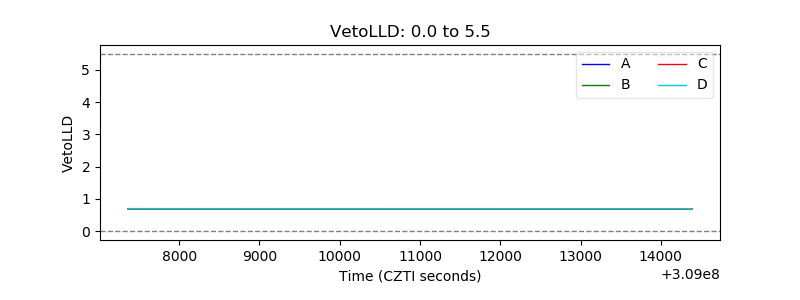 |
| Alpha Counter | 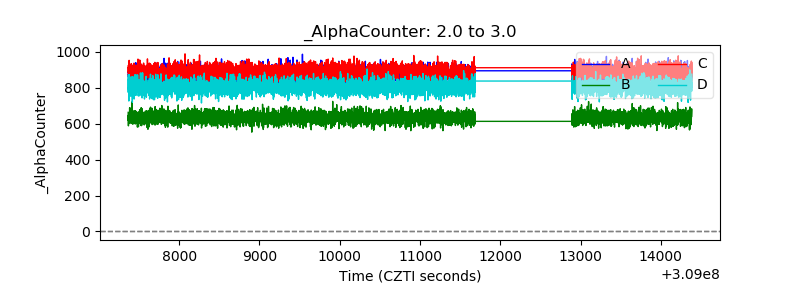 |
| _CPM_Rate | 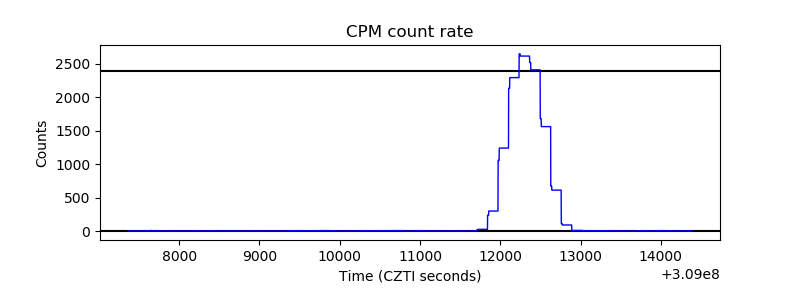 |
| CZT Counter | 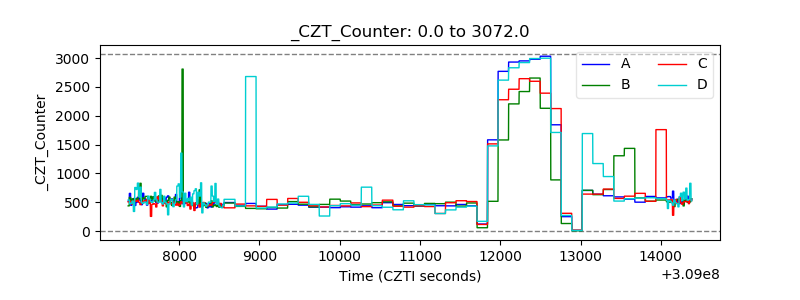 |
| +2.5 Volts monitor |  |
| +5 Volts monitor |  |
| _ROLL_ROT | 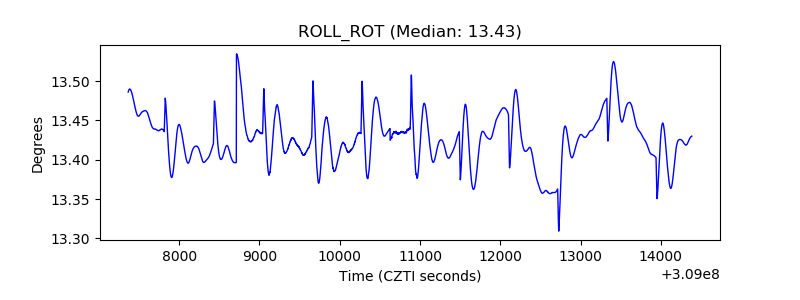 |
| _Roll_DEC | 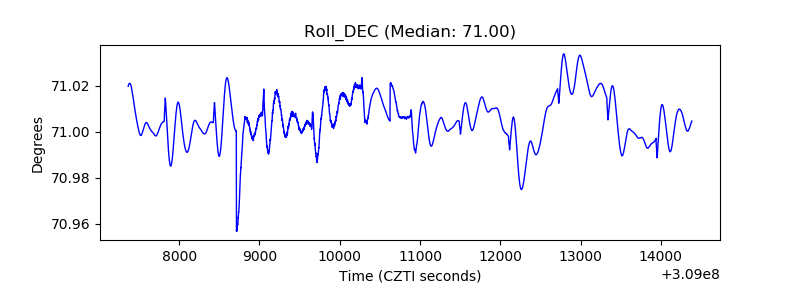 |
| _Roll_RA | 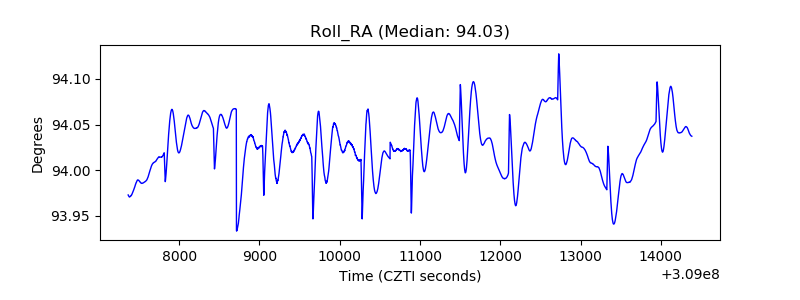 |
| Veto Counter | 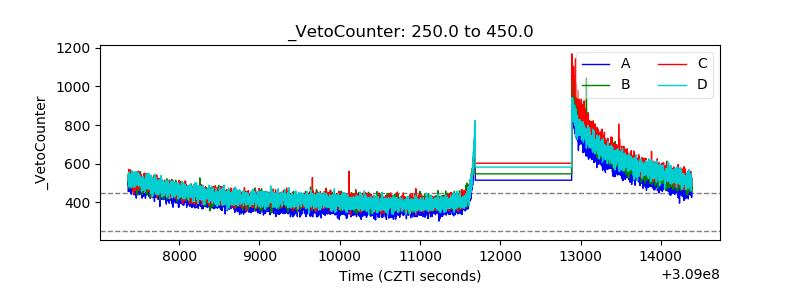 |