| Param | Original file | Final file |
|---|---|---|
| Filename | modeM0/AS1A07_100T03_9000003242_21914cztM0_level2.evt | modeM0/AS1A07_100T03_9000003242_21914cztM0_level2_quad_clean.evt |
| Size (bytes) | 465,747,840 | 122,673,600 |
| Size | 444.2 MB | 117.0 MB |
| Events in quadrant A | 3,380,689 | 826,657 |
| Events in quadrant B | 3,400,746 | 841,134 |
| Events in quadrant C | 3,410,009 | 821,086 |
| Events in quadrant D | 3,498,603 | 799,917 |
| Mode M0 | |||
|---|---|---|---|
| Quadrant | BADHDUFLAG | Total packets | Discarded packets |
| A | 0 | 14193 | 2 |
| B | 0 | 14134 | 2 |
| C | 0 | 14122 | 2 |
| D | 0 | 14542 | 2 |
| Mode SS | |||
|---|---|---|---|
| Quadrant | BADHDUFLAG | Total packets | Discarded packets |
| A | 0 | 124 | 0 |
| B | 0 | 124 | 0 |
| C | 0 | 124 | 0 |
| D | 0 | 124 | 0 |
| Mode M9 | |||
|---|---|---|---|
| Quadrant | BADHDUFLAG | Total packets | Discarded packets |
| A | 0 | 14 | 0 |
| B | 0 | 15 | 0 |
| C | 0 | 15 | 0 |
| D | 0 | 15 | 0 |
| Quadrant | Total seconds | Saturated seconds | Saturation percentage |
|---|---|---|---|
| A | 6115 | 123 | 2.011447% |
| B | 6115 | 107 | 1.749796% |
| C | 6114 | 143 | 2.338894% |
| D | 6114 | 111 | 1.815505% |
Noise dominated data is calculated using 1-second bins in cleaned event files. If a bin has >2000 counts, and if more than 50% of those come from <1% of pixels, then it is considered to be noise-dominated and hence unusable.
| Quadrant | # 1 sec bins | Bins with >0 counts | Bins with >2000 counts | High rate bins dominated by noise | Noise dominated (total time) | Noise dominated (detector-on time) | Marked lightcurve |
|---|---|---|---|---|---|---|---|
| A | 7475 | 6115 | 25 | 25 | 0.33% | 0.41% |  |
| B | 7475 | 6115 | 2 | 2 | 0.03% | 0.03% |  |
| C | 7474 | 6114 | 6 | 6 | 0.08% | 0.10% | 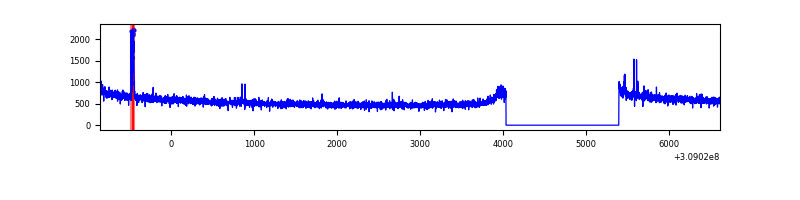 |
| D | 7474 | 6114 | 28 | 28 | 0.37% | 0.46% | 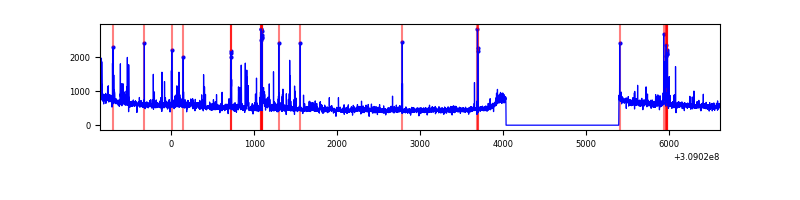 |
Top three noisy pixels from each quadrant. If the there are fewer than three noisy pixels in the level2.evt file, extra rows are filled as -1
| Pixel properties | Quadrant properties | ||||||
|---|---|---|---|---|---|---|---|
| Quadrant | DetID | PixID | Counts | Sigma | Mean | Median | Sigma |
| A | 4 | 2 | 124562 | 743.15 | 843 | 827 | 166.5 |
| A | 13 | 254 | 11342 | 63.15 | 843 | 827 | 166.5 |
| A | 0 | 226 | 7385 | 39.39 | 843 | 827 | 166.5 |
| B | 3 | 64 | 48382 | 309.97 | 841 | 822 | 153.4 |
| B | 0 | 190 | 23388 | 147.07 | 841 | 822 | 153.4 |
| B | 0 | 230 | 19453 | 121.42 | 841 | 822 | 153.4 |
| C | 14 | 238 | 133434 | 706.31 | 825 | 833 | 187.7 |
| C | 10 | 22 | 52139 | 273.29 | 825 | 833 | 187.7 |
| C | 0 | 10 | 5997 | 27.51 | 825 | 833 | 187.7 |
| D | 1 | 52 | 197930 | 992.36 | 835 | 814 | 198.6 |
| D | 2 | 234 | 37331 | 183.84 | 835 | 814 | 198.6 |
| D | 5 | 32 | 35152 | 172.87 | 835 | 814 | 198.6 |
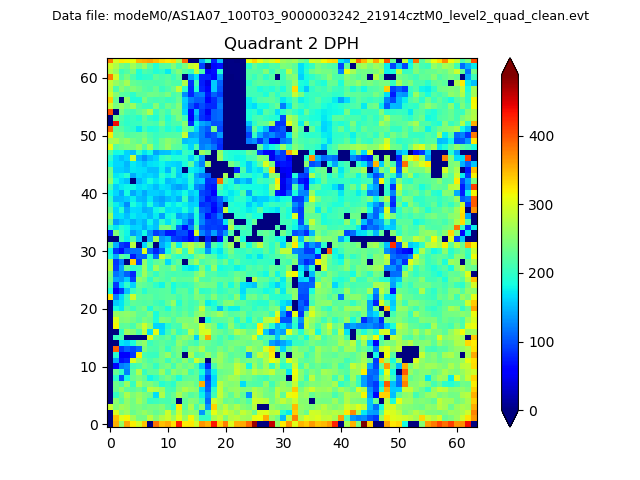
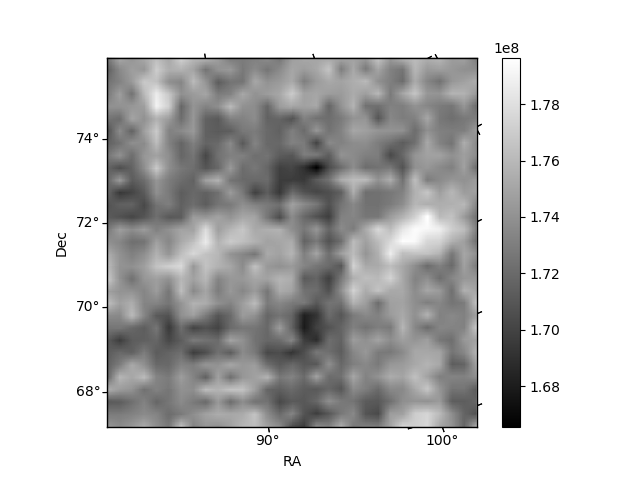
Histogram calculated using DETX and DETY for each event in the final _common_clean file
| Quadrant A | 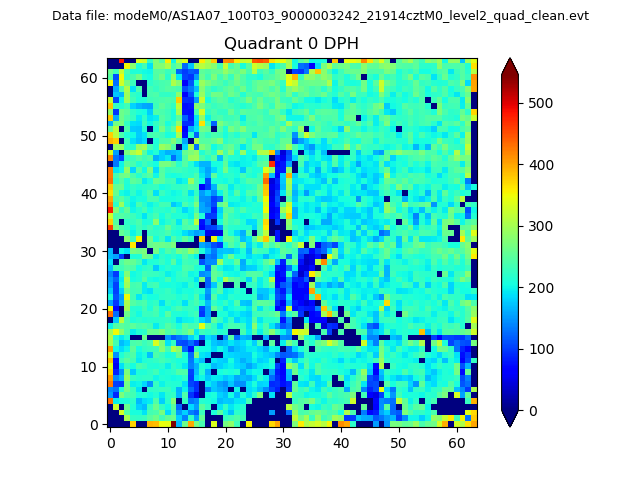 |
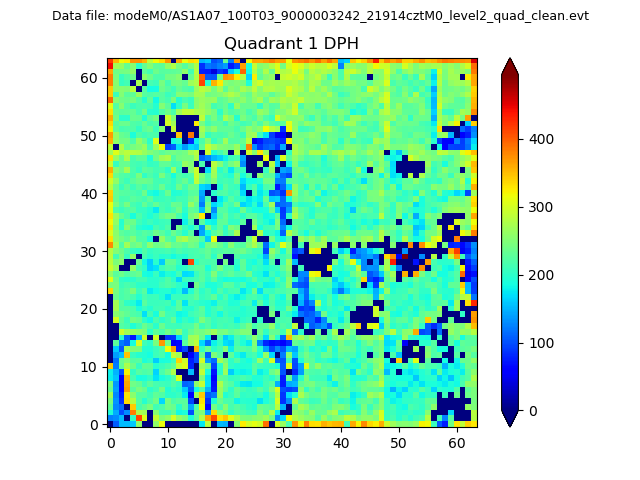 |
Quadrant B |
|---|---|---|---|
| Quadrant D | 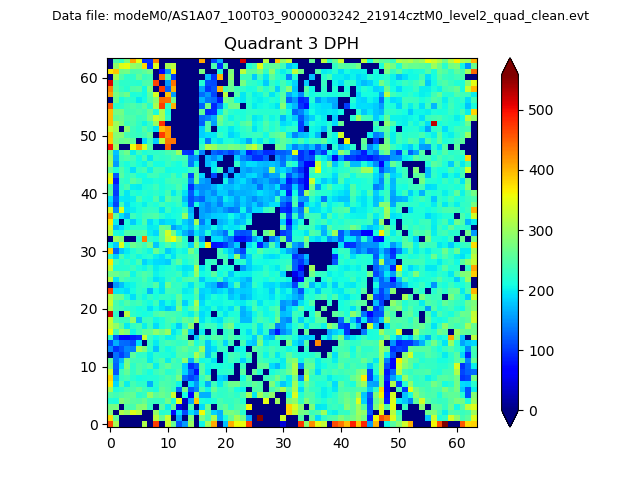 |
 |
Quadrant C |
| Plot type | Count rate plots | Images |
|---|---|---|
| Comparison with Poisson distribution Blue bars denote a histogram of data divided into 1 sec bins. Red curve is a Poisson curve with rate = median count rate of data. |
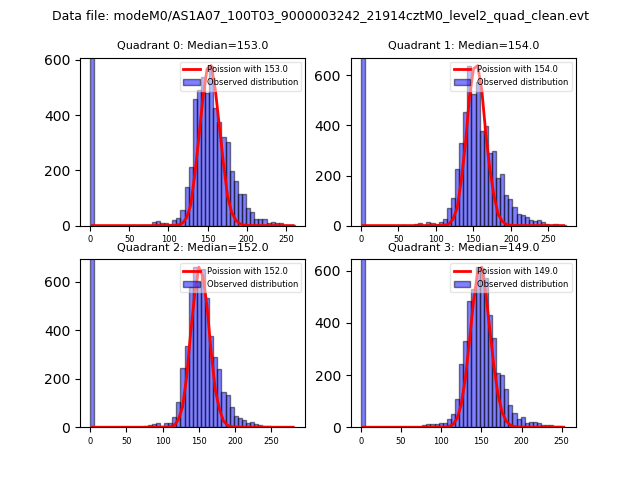 |
 |
| Quadrant-wise count rates Data is divided into 100 sec bins |
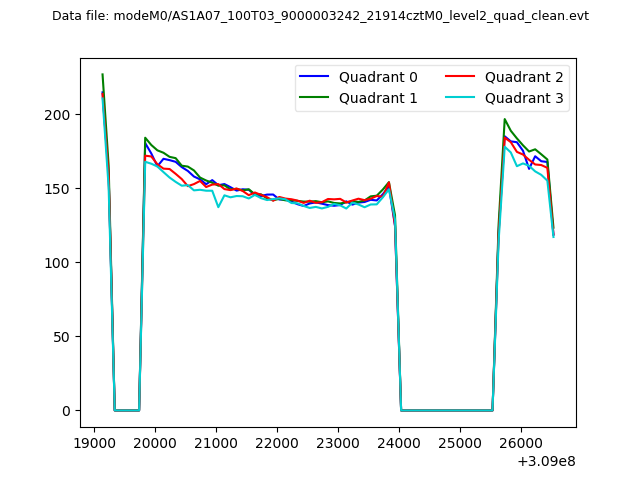 |
|
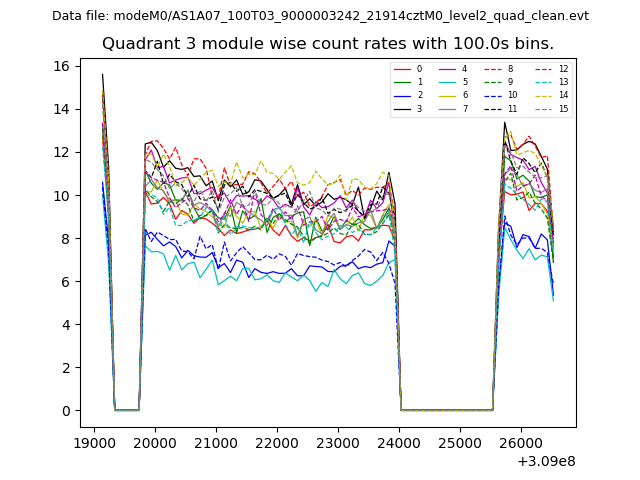
| Module-wise count rates for Quadrant A Data is divided into 100 sec bins |
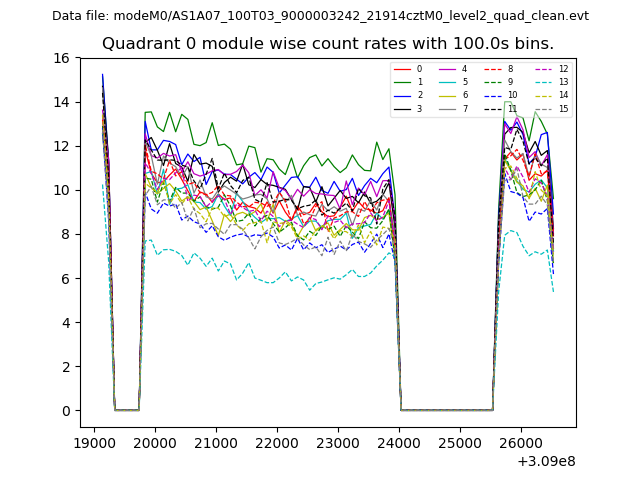 |
 |
| Module-wise count rates for Quadrant B Data is divided into 100 sec bins |
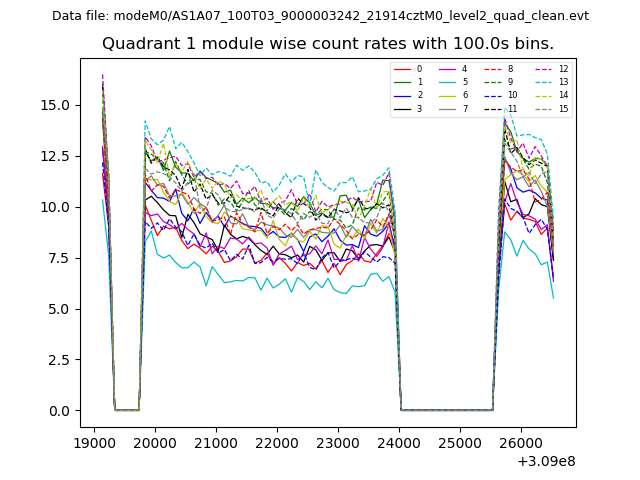 |
 |
| Module-wise count rates for Quadrant C Data is divided into 100 sec bins |
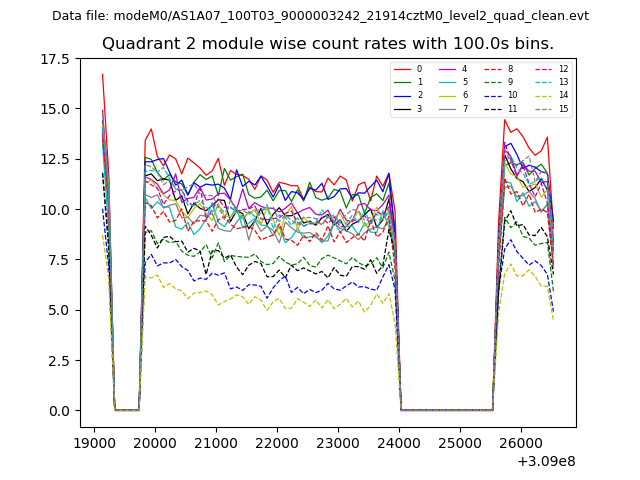 |
 |
| Module-wise count rates for Quadrant D Data is divided into 100 sec bins |
 |
 |
| Parameter | Plot |
|---|---|
| CZT HV Monitor | 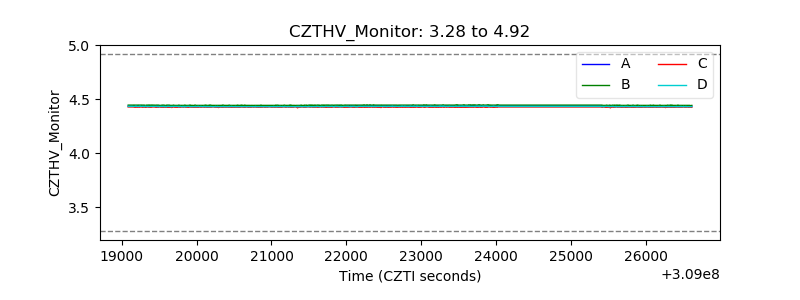 |
| D_VDD | 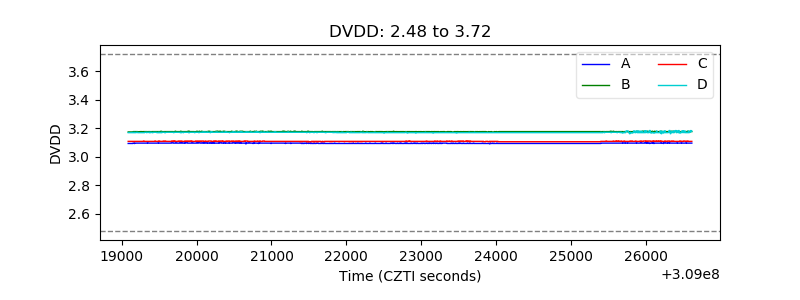 |
| Temperature 1 | 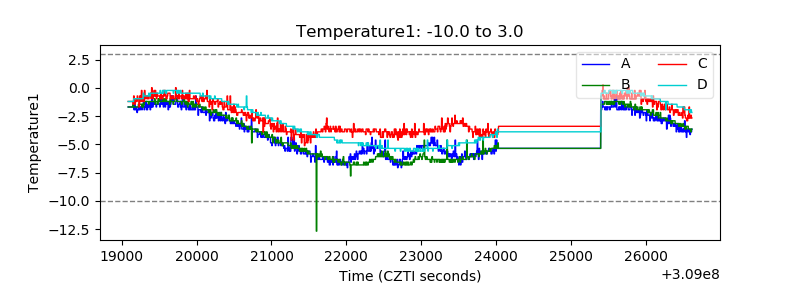 |
| Veto HV Monitor | 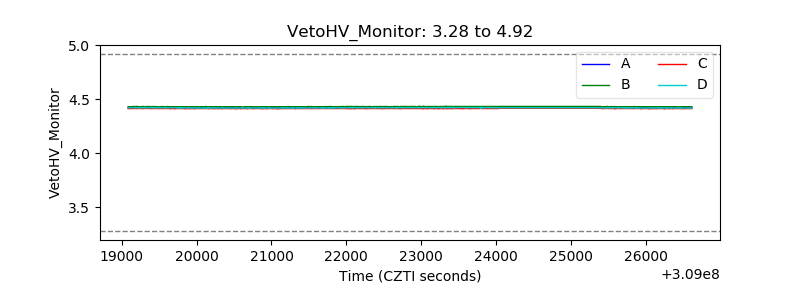 |
| Veto LLD | 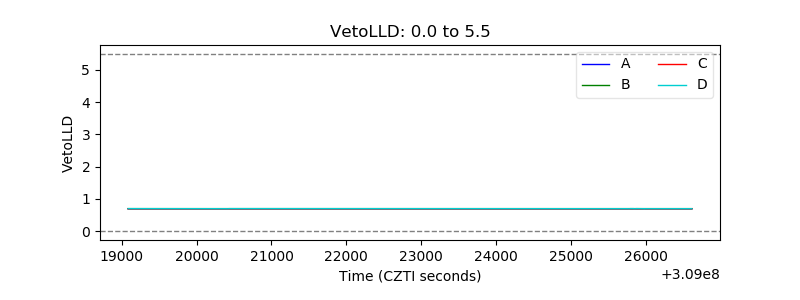 |
| Alpha Counter | 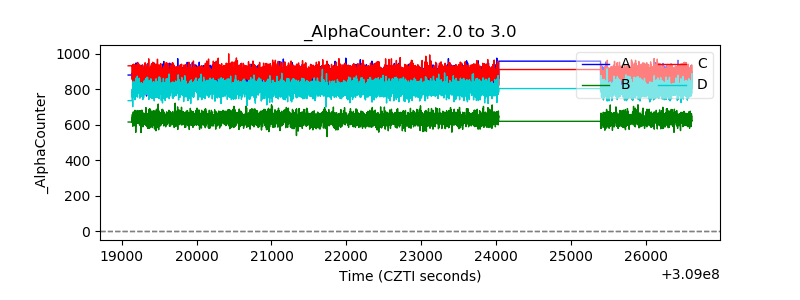 |
| _CPM_Rate | 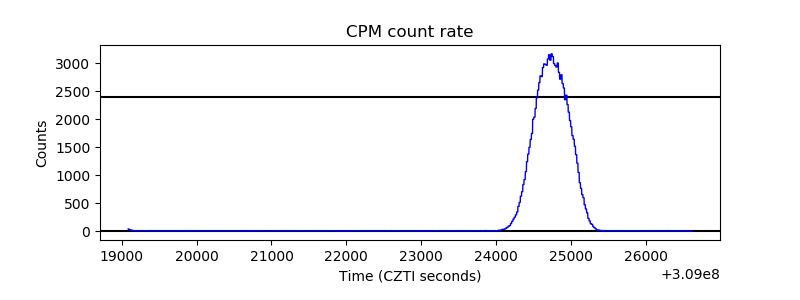 |
| CZT Counter | 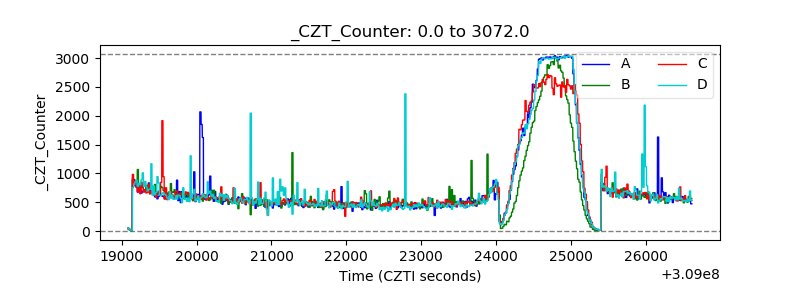 |
| +2.5 Volts monitor |  |
| +5 Volts monitor | 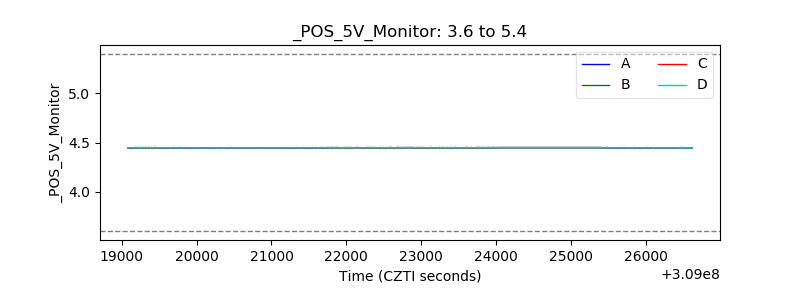 |
| _ROLL_ROT | 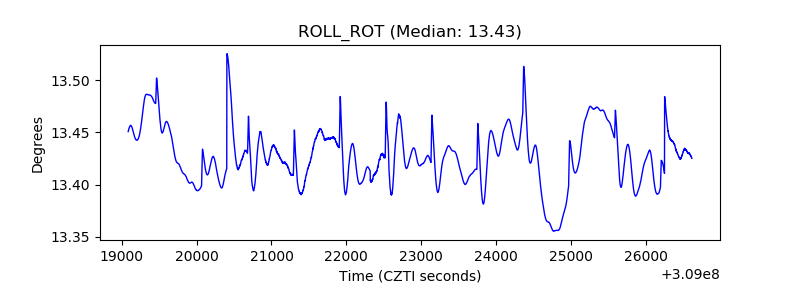 |
| _Roll_DEC | 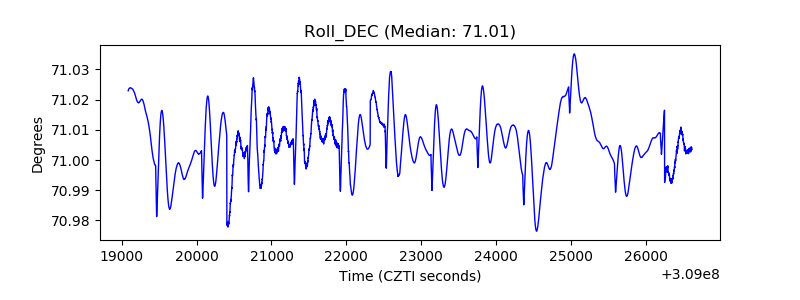 |
| _Roll_RA | 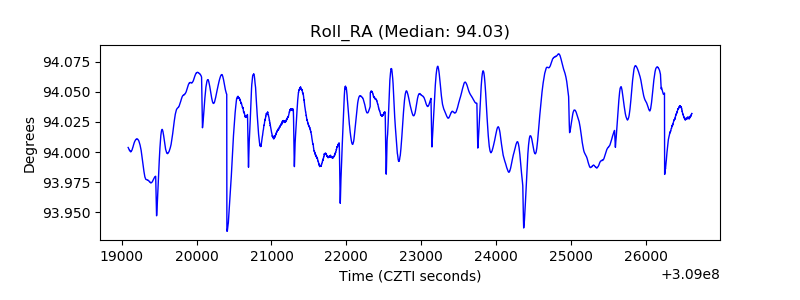 |
| Veto Counter | 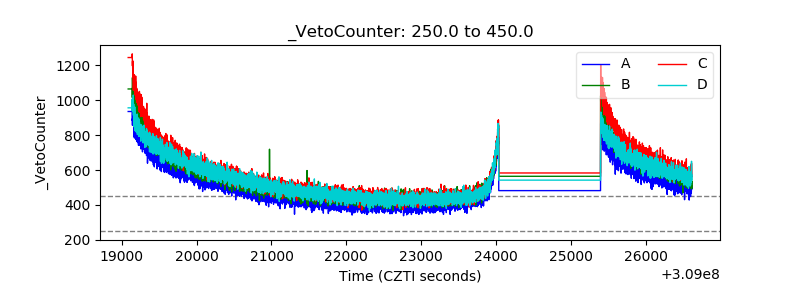 |