| Param | Original file | Final file |
|---|---|---|
| Filename | modeM0/AS1A07_100T03_9000003242_21915cztM0_level2.evt | modeM0/AS1A07_100T03_9000003242_21915cztM0_level2_quad_clean.evt |
| Size (bytes) | 467,861,760 | 133,266,240 |
| Size | 446.2 MB | 127.1 MB |
| Events in quadrant A | 3,260,330 | 904,251 |
| Events in quadrant B | 3,367,890 | 924,358 |
| Events in quadrant C | 3,487,902 | 903,788 |
| Events in quadrant D | 3,635,166 | 874,337 |
| Mode M0 | |||
|---|---|---|---|
| Quadrant | BADHDUFLAG | Total packets | Discarded packets |
| A | 0 | 13745 | 2 |
| B | 0 | 14052 | 2 |
| C | 0 | 14361 | 2 |
| D | 0 | 14983 | 2 |
| Mode SS | |||
|---|---|---|---|
| Quadrant | BADHDUFLAG | Total packets | Discarded packets |
| A | 0 | 124 | 0 |
| B | 0 | 124 | 0 |
| C | 0 | 124 | 0 |
| D | 0 | 124 | 0 |
| Mode M9 | |||
|---|---|---|---|
| Quadrant | BADHDUFLAG | Total packets | Discarded packets |
| A | 0 | 15 | 0 |
| B | 0 | 16 | 0 |
| C | 0 | 16 | 0 |
| D | 0 | 16 | 0 |
| Quadrant | Total seconds | Saturated seconds | Saturation percentage |
|---|---|---|---|
| A | 6161 | 90 | 1.460802% |
| B | 6161 | 99 | 1.606882% |
| C | 6161 | 141 | 2.288590% |
| D | 6161 | 125 | 2.028891% |
Noise dominated data is calculated using 1-second bins in cleaned event files. If a bin has >2000 counts, and if more than 50% of those come from <1% of pixels, then it is considered to be noise-dominated and hence unusable.
| Quadrant | # 1 sec bins | Bins with >0 counts | Bins with >2000 counts | High rate bins dominated by noise | Noise dominated (total time) | Noise dominated (detector-on time) | Marked lightcurve |
|---|---|---|---|---|---|---|---|
| A | 7536 | 6161 | 12 | 12 | 0.16% | 0.19% | 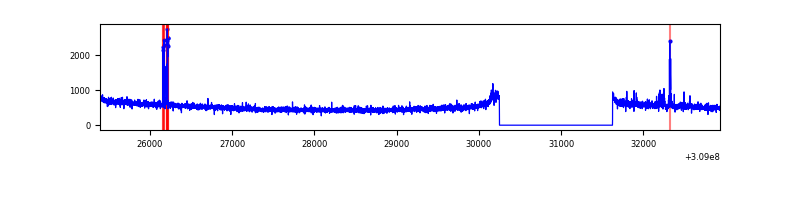 |
| B | 7536 | 6161 | 20 | 20 | 0.27% | 0.32% | 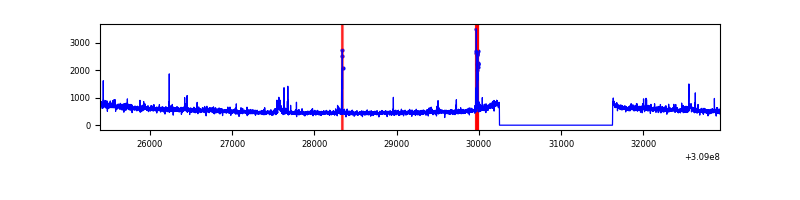 |
| C | 7536 | 6161 | 16 | 16 | 0.21% | 0.26% | 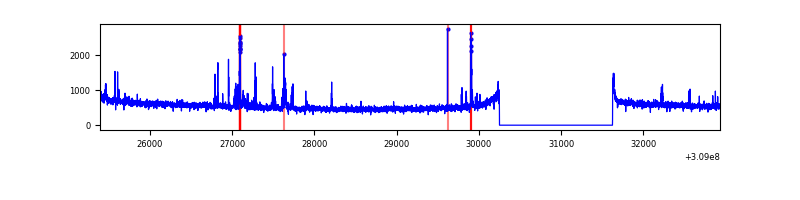 |
| D | 7536 | 6161 | 50 | 50 | 0.66% | 0.81% | 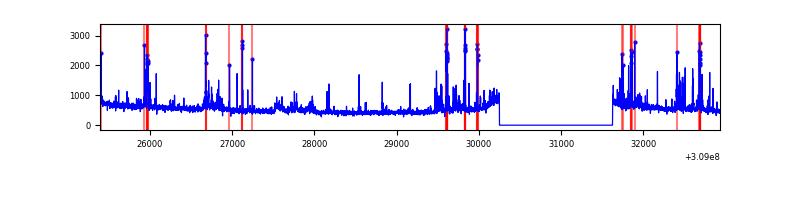 |
Top three noisy pixels from each quadrant. If the there are fewer than three noisy pixels in the level2.evt file, extra rows are filled as -1
| Pixel properties | Quadrant properties | ||||||
|---|---|---|---|---|---|---|---|
| Quadrant | DetID | PixID | Counts | Sigma | Mean | Median | Sigma |
| A | 4 | 2 | 79826 | 485.5 | 824 | 809 | 162.8 |
| A | 13 | 254 | 11079 | 63.1 | 824 | 809 | 162.8 |
| A | 0 | 226 | 7074 | 38.49 | 824 | 809 | 162.8 |
| B | 3 | 64 | 101877 | 675.01 | 825 | 806 | 149.7 |
| B | 12 | 111 | 16715 | 106.25 | 825 | 806 | 149.7 |
| B | 0 | 190 | 15152 | 95.81 | 825 | 806 | 149.7 |
| C | 10 | 22 | 176806 | 950.48 | 813 | 820 | 185.2 |
| C | 14 | 238 | 130040 | 697.9 | 813 | 820 | 185.2 |
| C | 0 | 10 | 13657 | 69.33 | 813 | 820 | 185.2 |
| D | 1 | 52 | 389614 | 2001.43 | 817 | 797 | 194.3 |
| D | 7 | 38 | 46391 | 234.69 | 817 | 797 | 194.3 |
| D | 5 | 32 | 37002 | 186.36 | 817 | 797 | 194.3 |
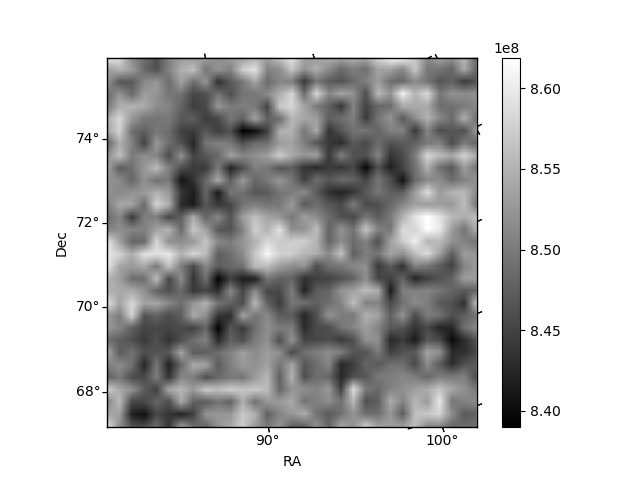
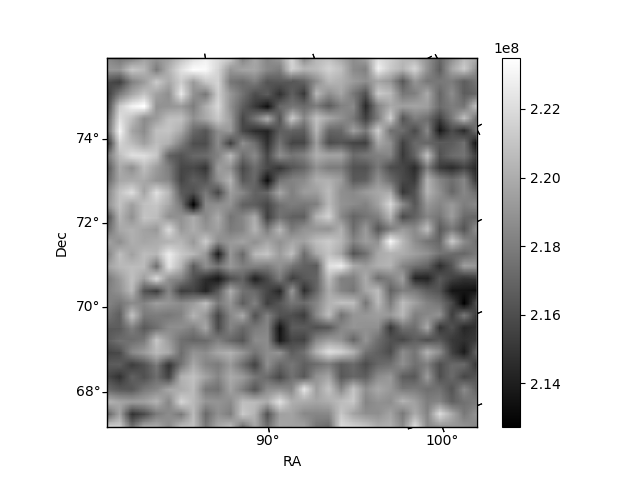
Histogram calculated using DETX and DETY for each event in the final _common_clean file
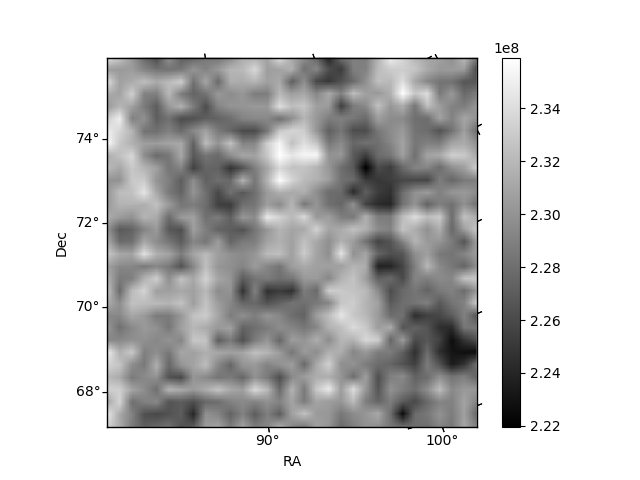
| Quadrant A | 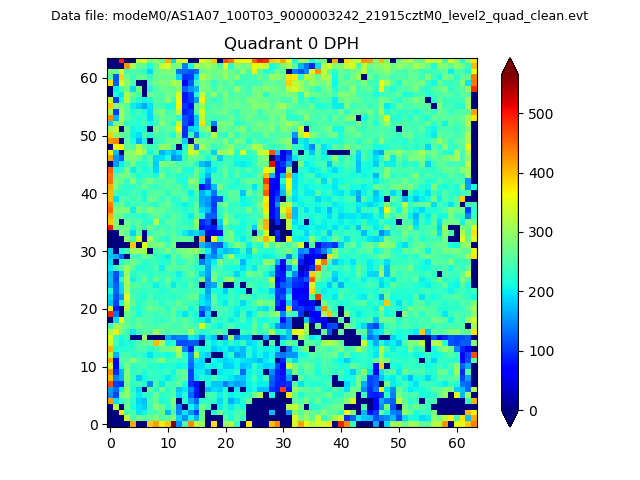 |
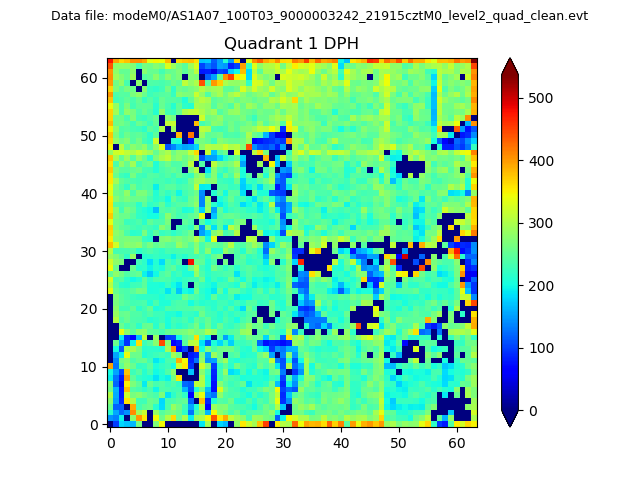 |
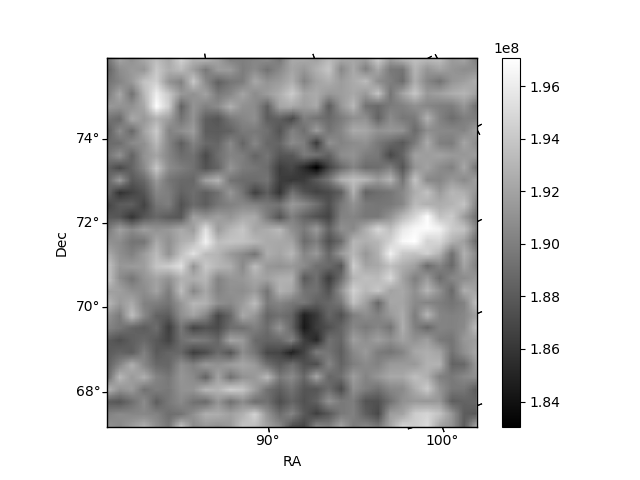
Quadrant B |
|---|---|---|---|
| Quadrant D | 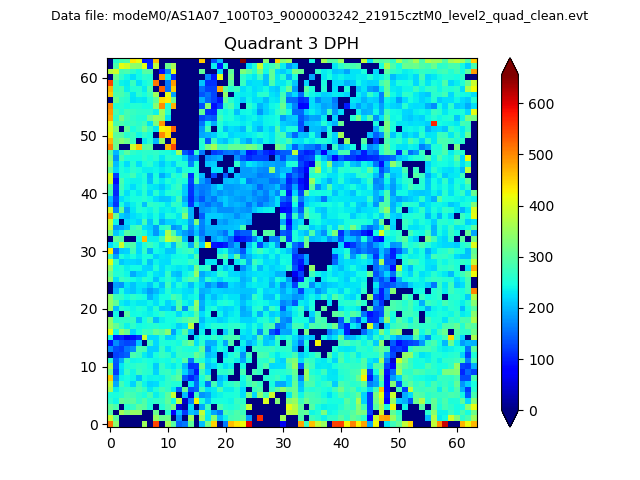 |
 |
Quadrant C |
| Plot type | Count rate plots | Images |
|---|---|---|
| Comparison with Poisson distribution Blue bars denote a histogram of data divided into 1 sec bins. Red curve is a Poisson curve with rate = median count rate of data. |
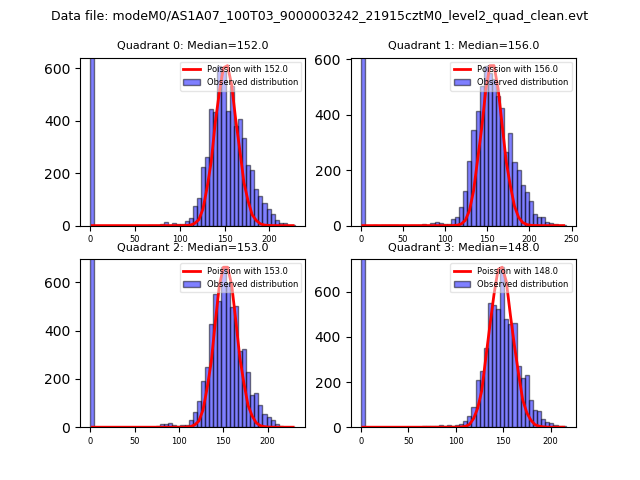 |
 |
| Quadrant-wise count rates Data is divided into 100 sec bins |
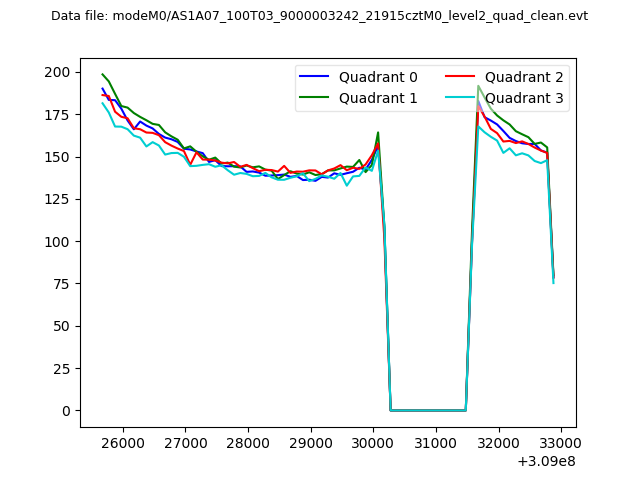 |
|
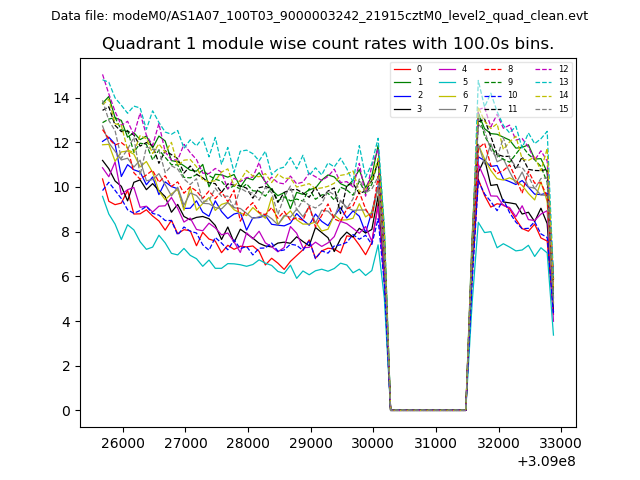
| Module-wise count rates for Quadrant A Data is divided into 100 sec bins |
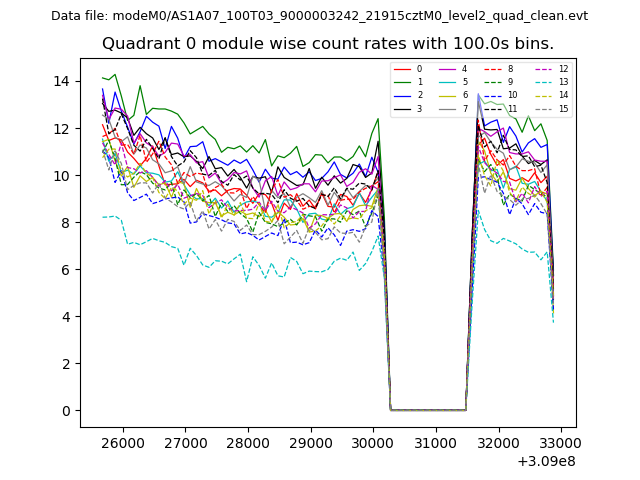 |
 |
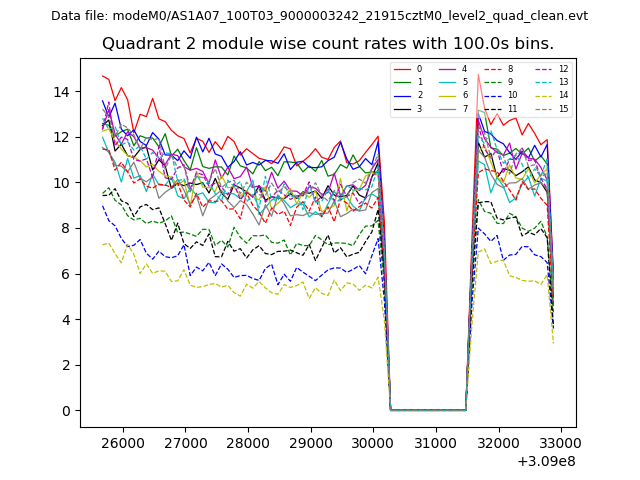
| Module-wise count rates for Quadrant B Data is divided into 100 sec bins |
 |
 |
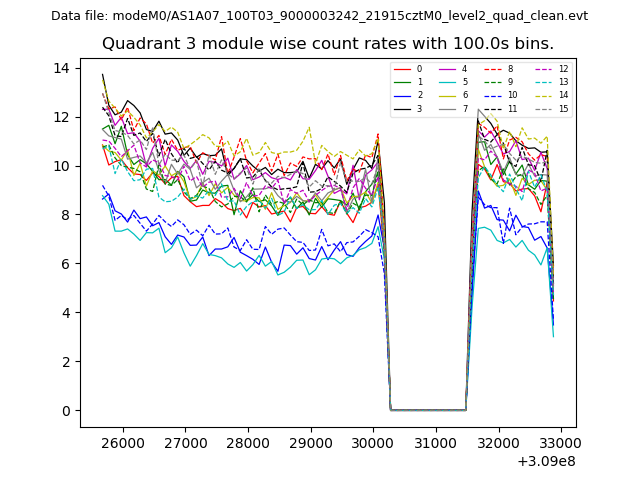
| Module-wise count rates for Quadrant C Data is divided into 100 sec bins |
 |
 |
| Module-wise count rates for Quadrant D Data is divided into 100 sec bins |
 |
 |
| Parameter | Plot |
|---|---|
| CZT HV Monitor | 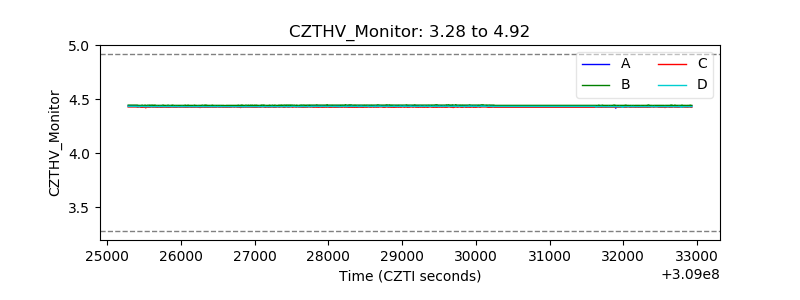 |
| D_VDD | 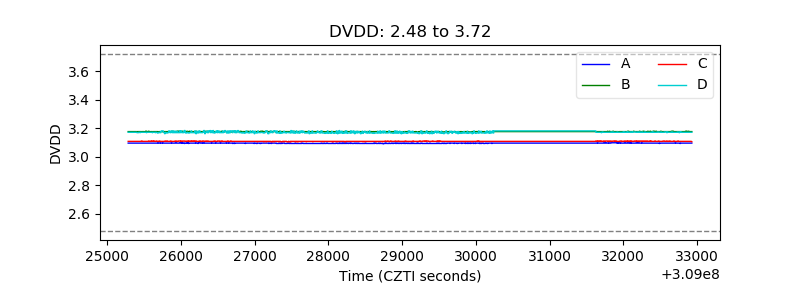 |
| Temperature 1 | 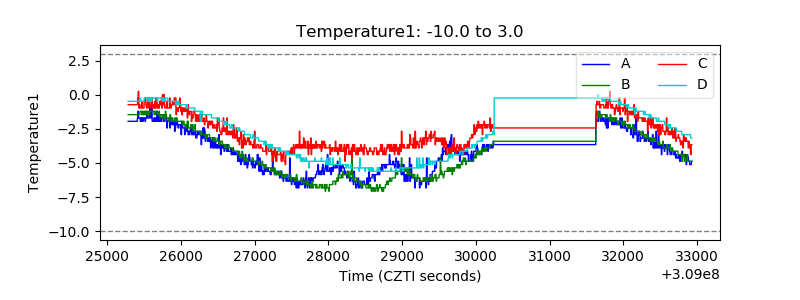 |
| Veto HV Monitor | 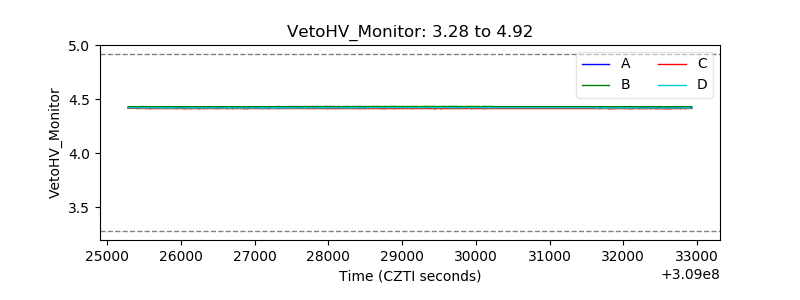 |
| Veto LLD | 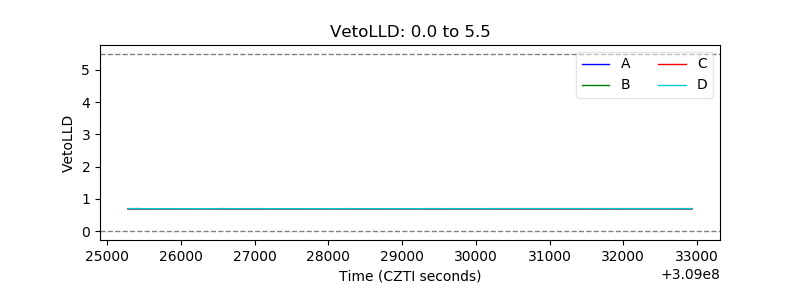 |
| Alpha Counter | 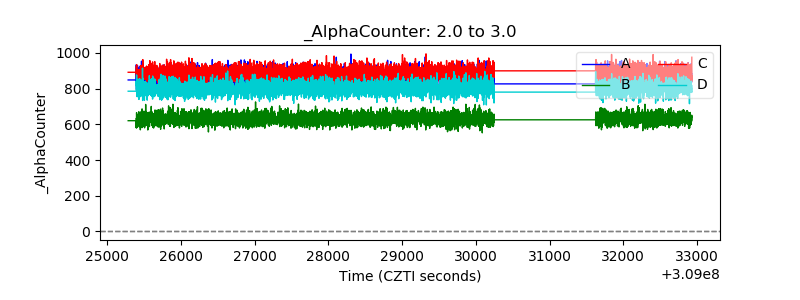 |
| _CPM_Rate | 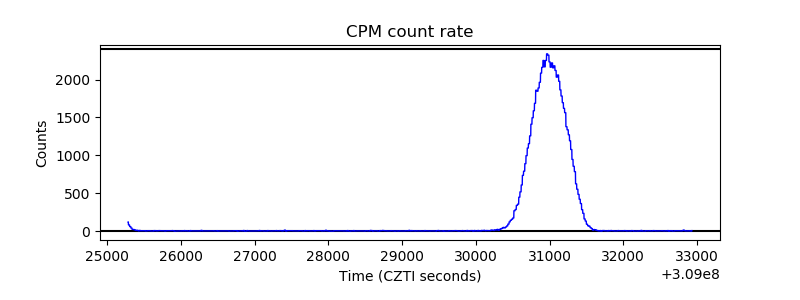 |
| CZT Counter |  |
| +2.5 Volts monitor |  |
| +5 Volts monitor |  |
| _ROLL_ROT | 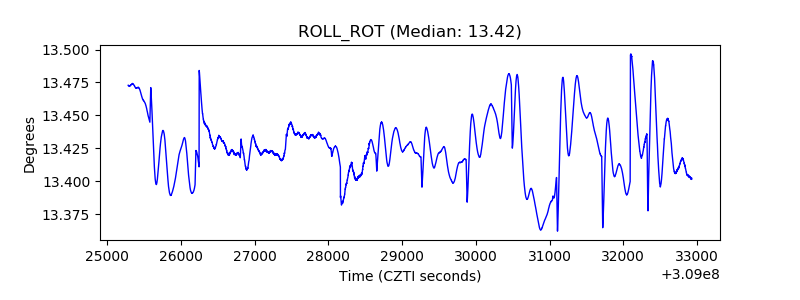 |
| _Roll_DEC | 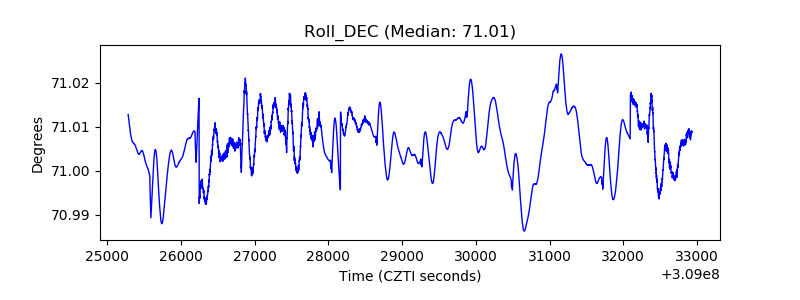 |
| _Roll_RA | 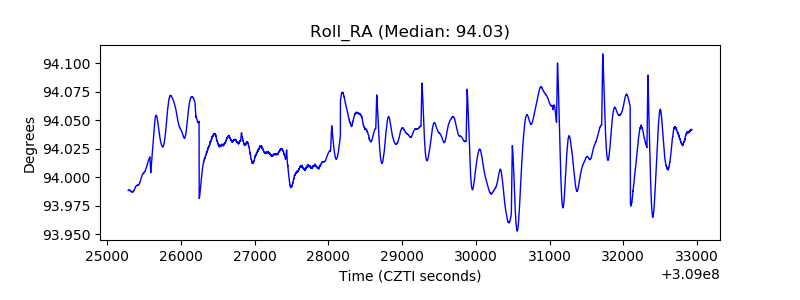 |
| Veto Counter | 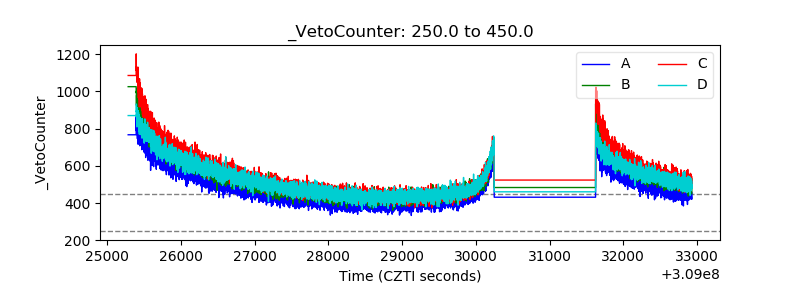 |