| Param | Original file | Final file |
|---|---|---|
| Filename | modeM0/AS1A07_100T03_9000003242_21917cztM0_level2.evt | modeM0/AS1A07_100T03_9000003242_21917cztM0_level2_quad_clean.evt |
| Size (bytes) | 452,975,040 | 123,592,320 |
| Size | 432.0 MB | 117.9 MB |
| Events in quadrant A | 3,217,651 | 820,310 |
| Events in quadrant B | 3,294,474 | 839,103 |
| Events in quadrant C | 3,228,742 | 824,168 |
| Events in quadrant D | 3,527,983 | 798,637 |
| Mode M0 | |||
|---|---|---|---|
| Quadrant | BADHDUFLAG | Total packets | Discarded packets |
| A | 0 | 13969 | 2 |
| B | 0 | 14067 | 3 |
| C | 0 | 13806 | 2 |
| D | 0 | 14963 | 2 |
| Mode SS | |||
|---|---|---|---|
| Quadrant | BADHDUFLAG | Total packets | Discarded packets |
| A | 0 | 136 | 0 |
| B | 0 | 136 | 0 |
| C | 0 | 136 | 0 |
| D | 0 | 136 | 0 |
| Mode M9 | |||
|---|---|---|---|
| Quadrant | BADHDUFLAG | Total packets | Discarded packets |
| A | 0 | 9 | 0 |
| B | 0 | 10 | 0 |
| C | 0 | 10 | 0 |
| D | 0 | 10 | 0 |
| Quadrant | Total seconds | Saturated seconds | Saturation percentage |
|---|---|---|---|
| A | 6610 | 37 | 0.559758% |
| B | 6609 | 47 | 0.711151% |
| C | 6609 | 76 | 1.149947% |
| D | 6609 | 62 | 0.938115% |
Noise dominated data is calculated using 1-second bins in cleaned event files. If a bin has >2000 counts, and if more than 50% of those come from <1% of pixels, then it is considered to be noise-dominated and hence unusable.
| Quadrant | # 1 sec bins | Bins with >0 counts | Bins with >2000 counts | High rate bins dominated by noise | Noise dominated (total time) | Noise dominated (detector-on time) | Marked lightcurve |
|---|---|---|---|---|---|---|---|
| A | 7520 | 6611 | 19 | 19 | 0.25% | 0.29% | 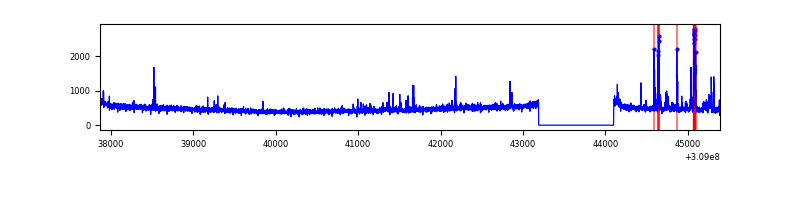 |
| B | 7519 | 6610 | 16 | 16 | 0.21% | 0.24% | 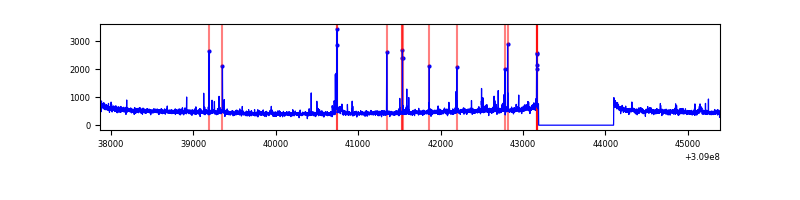 |
| C | 7519 | 6610 | 6 | 6 | 0.08% | 0.09% | 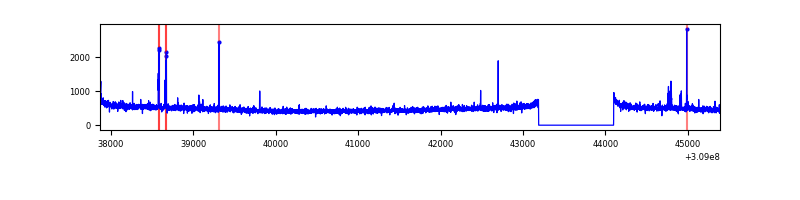 |
| D | 7519 | 6610 | 35 | 35 | 0.47% | 0.53% | 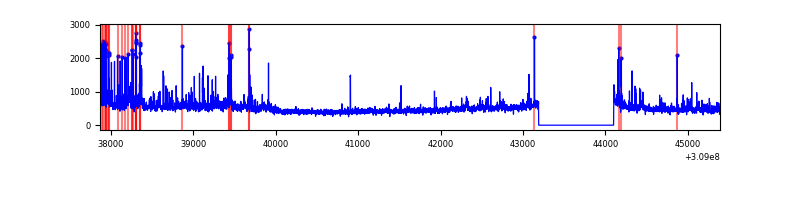 |
Top three noisy pixels from each quadrant. If the there are fewer than three noisy pixels in the level2.evt file, extra rows are filled as -1
| Pixel properties | Quadrant properties | ||||||
|---|---|---|---|---|---|---|---|
| Quadrant | DetID | PixID | Counts | Sigma | Mean | Median | Sigma |
| A | 4 | 2 | 160433 | 1014.23 | 790 | 774 | 157.4 |
| A | 13 | 254 | 11038 | 65.2 | 790 | 774 | 157.4 |
| A | 5 | 16 | 8866 | 51.4 | 790 | 774 | 157.4 |
| B | 3 | 64 | 93697 | 625.75 | 795 | 777 | 148.5 |
| B | 0 | 190 | 26032 | 170.07 | 795 | 777 | 148.5 |
| B | 0 | 230 | 22560 | 146.69 | 795 | 777 | 148.5 |
| C | 14 | 238 | 124396 | 690.09 | 777 | 784 | 179.1 |
| C | 10 | 22 | 68028 | 375.41 | 777 | 784 | 179.1 |
| C | 0 | 10 | 8048 | 40.55 | 777 | 784 | 179.1 |
| D | 1 | 52 | 253478 | 1358.11 | 778 | 756 | 186.1 |
| D | 12 | 227 | 153467 | 820.66 | 778 | 756 | 186.1 |
| D | 7 | 238 | 51620 | 273.34 | 778 | 756 | 186.1 |
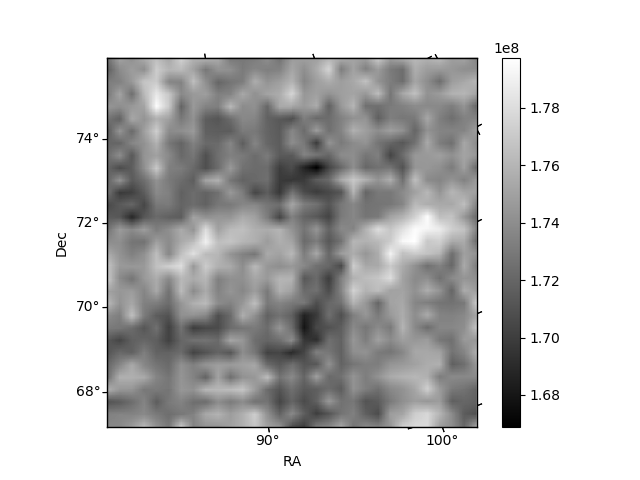
Histogram calculated using DETX and DETY for each event in the final _common_clean file
| Quadrant A | 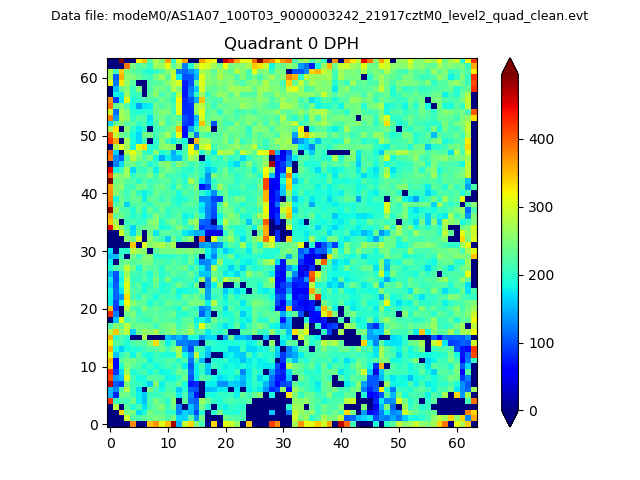 |
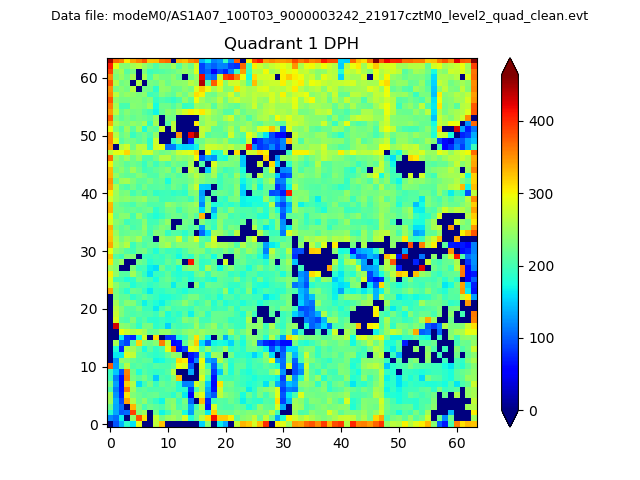 |
Quadrant B |
|---|---|---|---|
| Quadrant D |  |
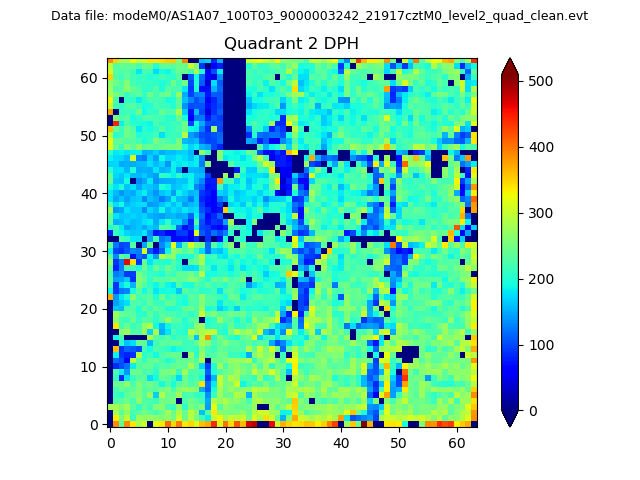 |
Quadrant C |
| Plot type | Count rate plots | Images |
|---|---|---|
| Comparison with Poisson distribution Blue bars denote a histogram of data divided into 1 sec bins. Red curve is a Poisson curve with rate = median count rate of data. |
 |
 |
| Quadrant-wise count rates Data is divided into 100 sec bins |
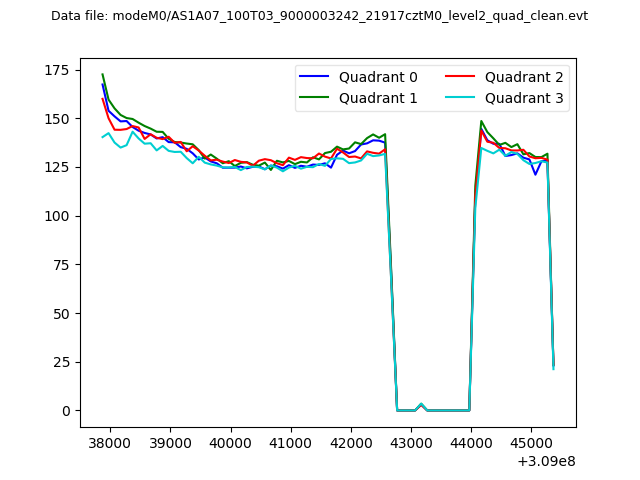 |
|
| Module-wise count rates for Quadrant A Data is divided into 100 sec bins |
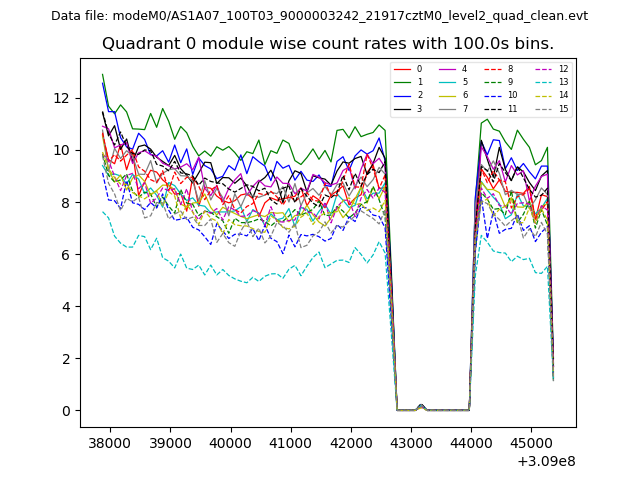 |
 |
| Module-wise count rates for Quadrant B Data is divided into 100 sec bins |
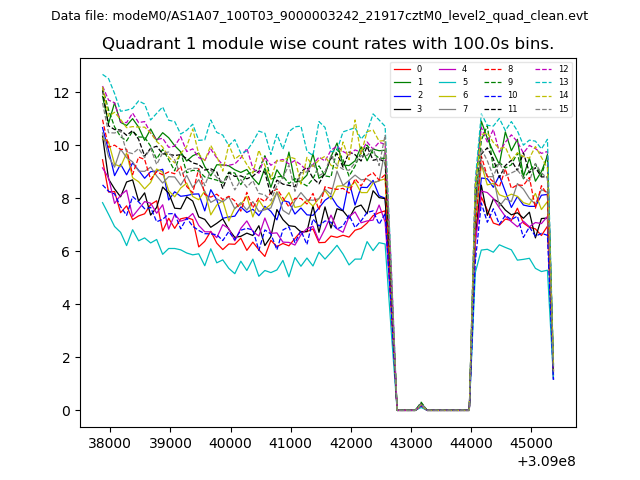 |
 |
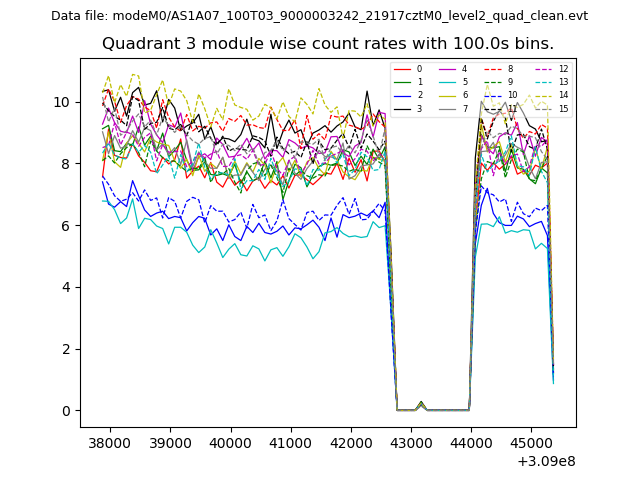
| Module-wise count rates for Quadrant C Data is divided into 100 sec bins |
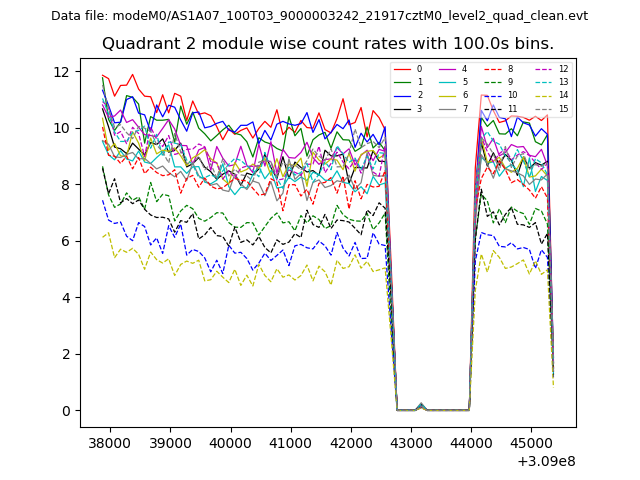 |
 |
| Module-wise count rates for Quadrant D Data is divided into 100 sec bins |
 |
 |
| Parameter | Plot |
|---|---|
| CZT HV Monitor | 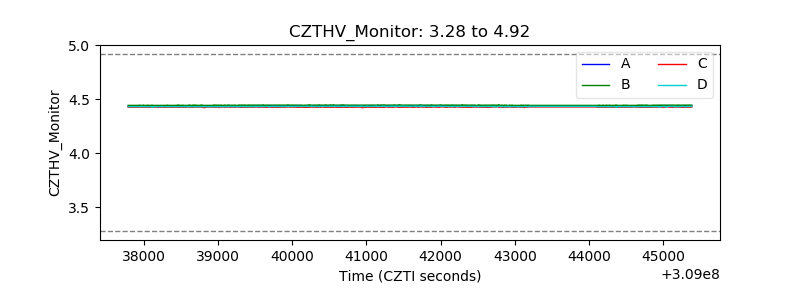 |
| D_VDD |  |
| Temperature 1 | 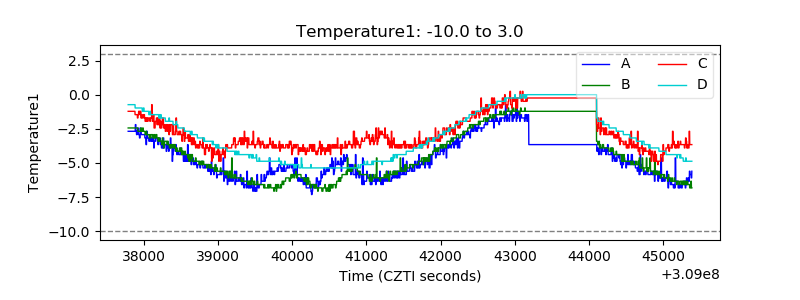 |
| Veto HV Monitor | 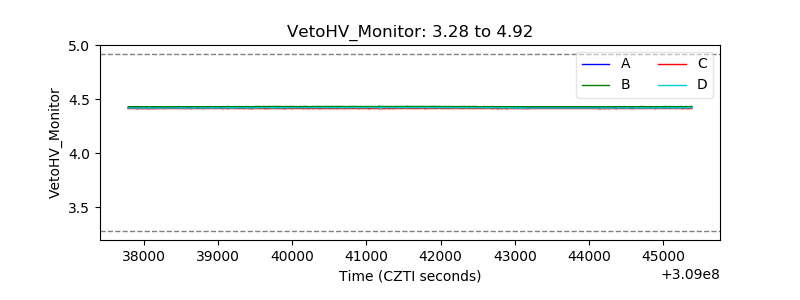 |
| Veto LLD | 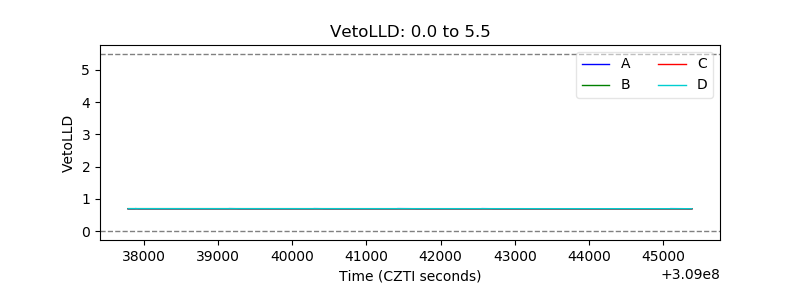 |
| Alpha Counter | 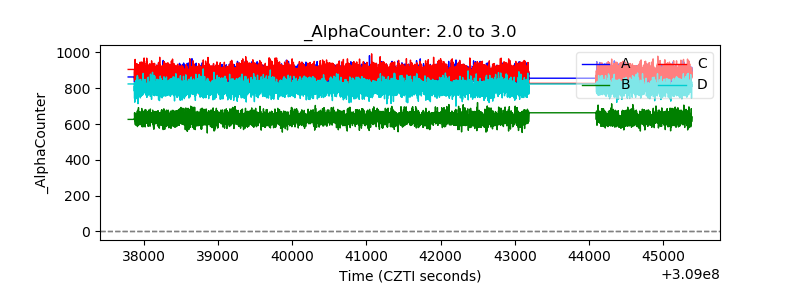 |
| _CPM_Rate | 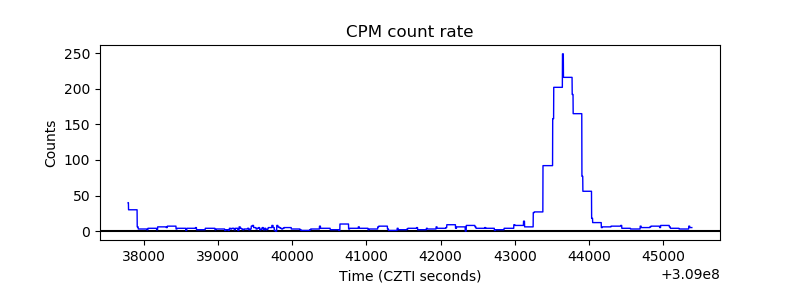 |
| CZT Counter | 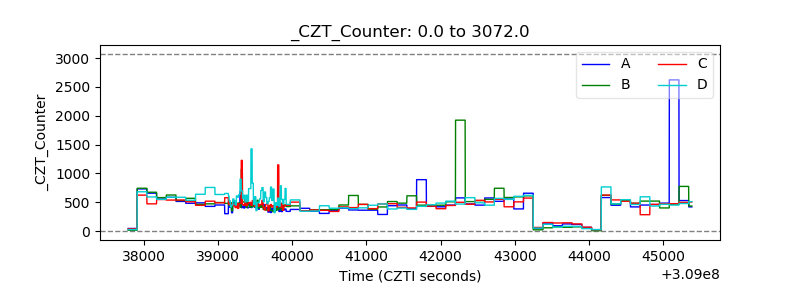 |
| +2.5 Volts monitor |  |
| +5 Volts monitor |  |
| _ROLL_ROT | 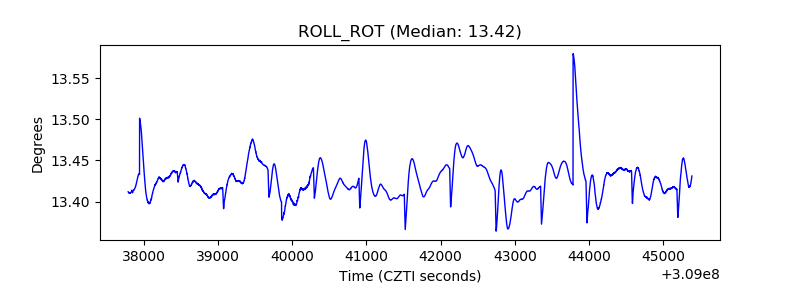 |
| _Roll_DEC | 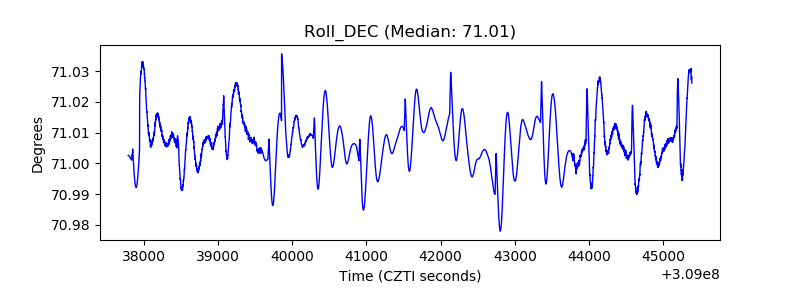 |
| _Roll_RA | 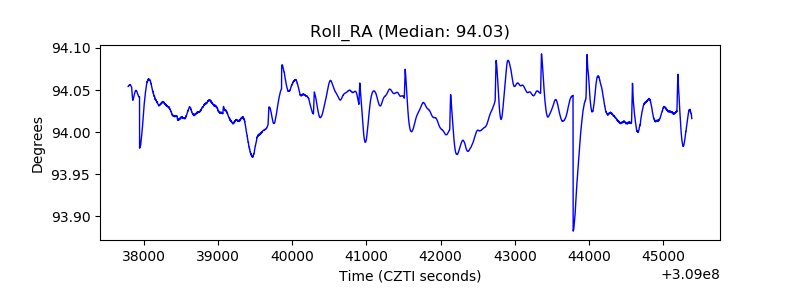 |
| Veto Counter | 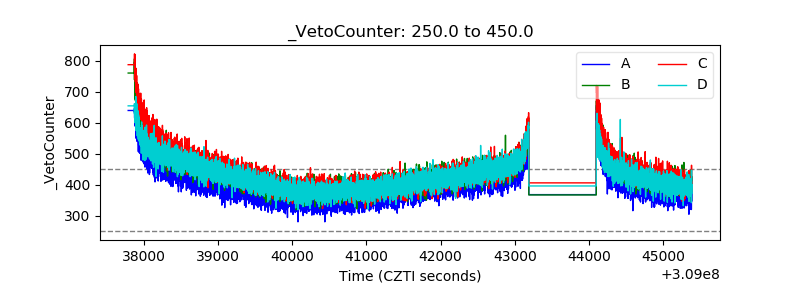 |