| Param | Original file | Final file |
|---|---|---|
| Filename | modeM0/AS1A07_100T03_9000003242_21920cztM0_level2.evt | modeM0/AS1A07_100T03_9000003242_21920cztM0_level2_quad_clean.evt |
| Size (bytes) | 522,648,000 | 135,852,480 |
| Size | 498.4 MB | 129.6 MB |
| Events in quadrant A | 3,659,625 | 899,278 |
| Events in quadrant B | 3,848,879 | 913,973 |
| Events in quadrant C | 3,620,051 | 896,031 |
| Events in quadrant D | 4,178,363 | 871,299 |
| Mode M0 | |||
|---|---|---|---|
| Quadrant | BADHDUFLAG | Total packets | Discarded packets |
| A | 0 | 16200 | 2 |
| B | 0 | 16596 | 2 |
| C | 0 | 16045 | 2 |
| D | 0 | 17895 | 2 |
| Mode SS | |||
|---|---|---|---|
| Quadrant | BADHDUFLAG | Total packets | Discarded packets |
| A | 0 | 156 | 0 |
| B | 0 | 156 | 0 |
| C | 0 | 156 | 0 |
| D | 0 | 156 | 0 |
| Mode M9 | |||
|---|---|---|---|
| Quadrant | BADHDUFLAG | Total packets | Discarded packets |
| A | 0 | 3 | 0 |
| B | 0 | 3 | 0 |
| C | 0 | 3 | 0 |
| D | 0 | 3 | 0 |
| Quadrant | Total seconds | Saturated seconds | Saturation percentage |
|---|---|---|---|
| A | 7679 | 52 | 0.677172% |
| B | 7679 | 103 | 1.341320% |
| C | 7679 | 93 | 1.211095% |
| D | 7679 | 139 | 1.810132% |
Noise dominated data is calculated using 1-second bins in cleaned event files. If a bin has >2000 counts, and if more than 50% of those come from <1% of pixels, then it is considered to be noise-dominated and hence unusable.
| Quadrant | # 1 sec bins | Bins with >0 counts | Bins with >2000 counts | High rate bins dominated by noise | Noise dominated (total time) | Noise dominated (detector-on time) | Marked lightcurve |
|---|---|---|---|---|---|---|---|
| A | 7974 | 7679 | 22 | 22 | 0.28% | 0.29% | 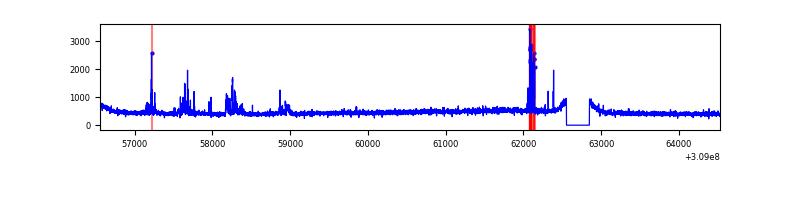 |
| B | 7974 | 7679 | 37 | 37 | 0.46% | 0.48% | 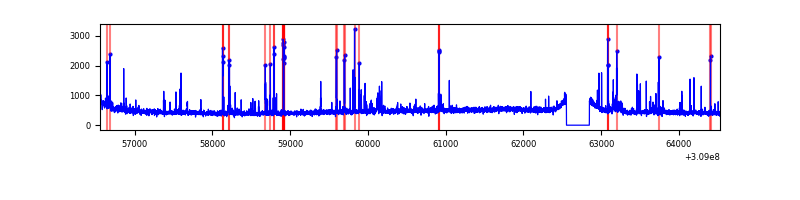 |
| C | 7974 | 7680 | 2 | 2 | 0.03% | 0.03% | 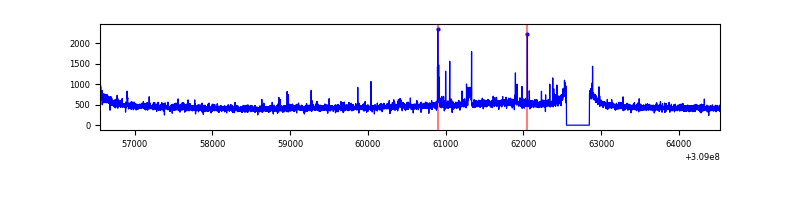 |
| D | 7974 | 7680 | 96 | 96 | 1.20% | 1.25% | 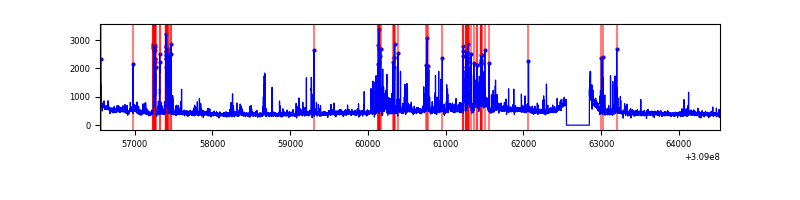 |
Top three noisy pixels from each quadrant. If the there are fewer than three noisy pixels in the level2.evt file, extra rows are filled as -1
| Pixel properties | Quadrant properties | ||||||
|---|---|---|---|---|---|---|---|
| Quadrant | DetID | PixID | Counts | Sigma | Mean | Median | Sigma |
| A | 4 | 2 | 213294 | 1180.05 | 891 | 870 | 180.0 |
| A | 13 | 254 | 13643 | 70.96 | 891 | 870 | 180.0 |
| A | 3 | 137 | 7721 | 38.06 | 891 | 870 | 180.0 |
| B | 3 | 64 | 222200 | 1299.75 | 895 | 871 | 170.3 |
| B | 0 | 230 | 53322 | 308.02 | 895 | 871 | 170.3 |
| B | 0 | 197 | 43385 | 249.66 | 895 | 871 | 170.3 |
| C | 14 | 238 | 135859 | 669.95 | 868 | 875 | 201.5 |
| C | 10 | 22 | 79656 | 391.01 | 868 | 875 | 201.5 |
| C | 8 | 128 | 12584 | 58.11 | 868 | 875 | 201.5 |
| D | 1 | 52 | 640836 | 3074.01 | 867 | 841 | 208.2 |
| D | 7 | 38 | 65740 | 311.72 | 867 | 841 | 208.2 |
| D | 2 | 136 | 38291 | 179.88 | 867 | 841 | 208.2 |
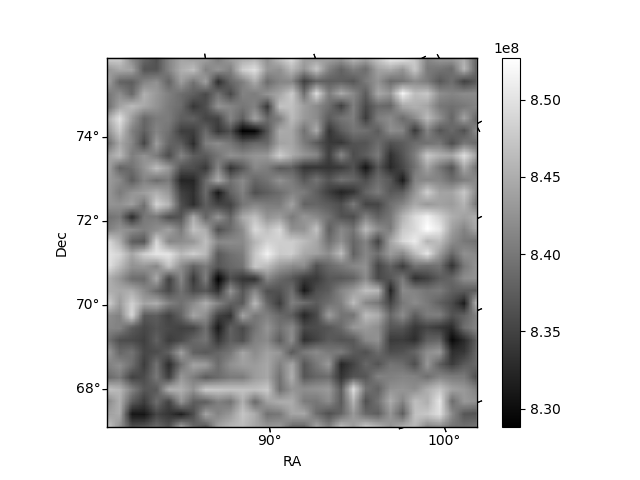
Histogram calculated using DETX and DETY for each event in the final _common_clean file
| Quadrant A | 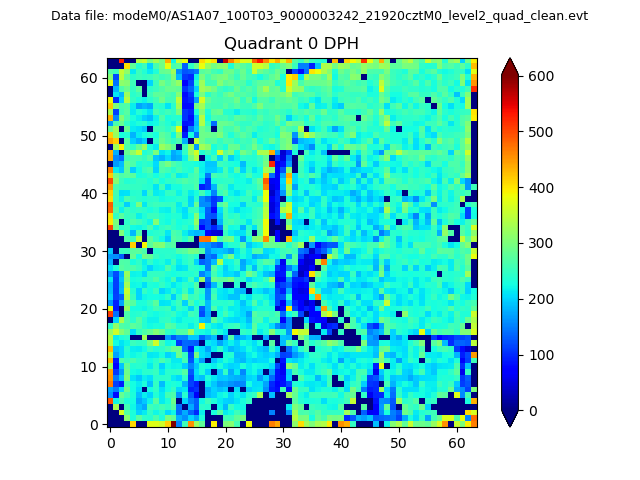 |
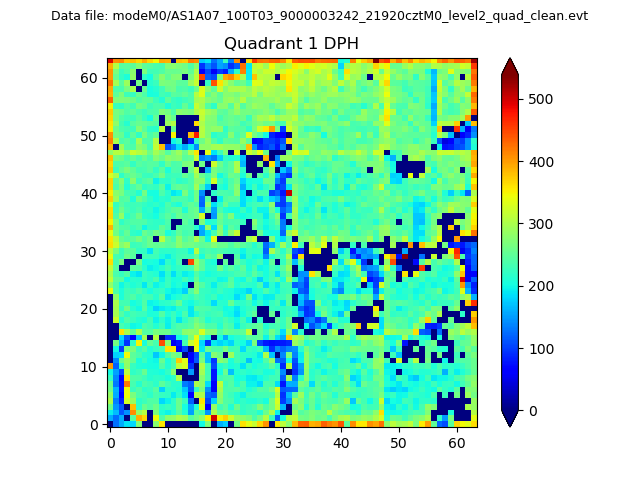 |
Quadrant B |
|---|---|---|---|
| Quadrant D |  |
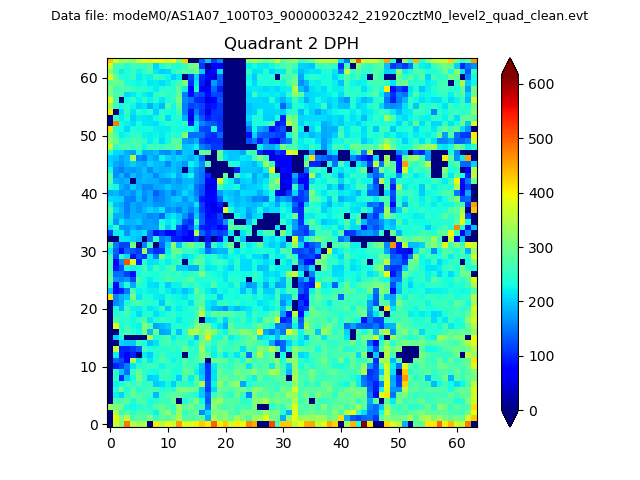 |
Quadrant C |
| Plot type | Count rate plots | Images |
|---|---|---|
| Comparison with Poisson distribution Blue bars denote a histogram of data divided into 1 sec bins. Red curve is a Poisson curve with rate = median count rate of data. |
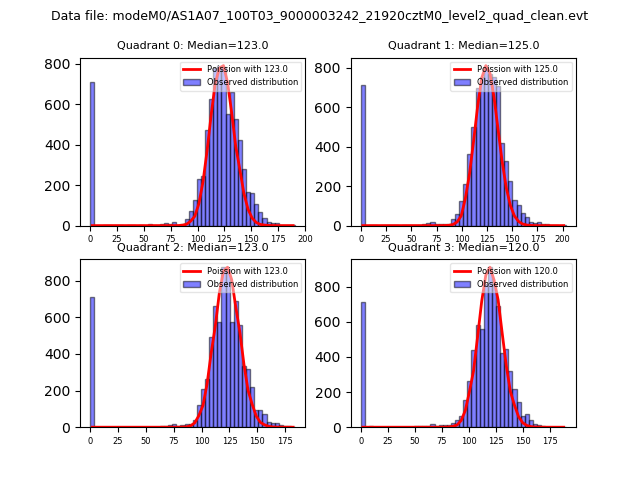 |
 |
| Quadrant-wise count rates Data is divided into 100 sec bins |
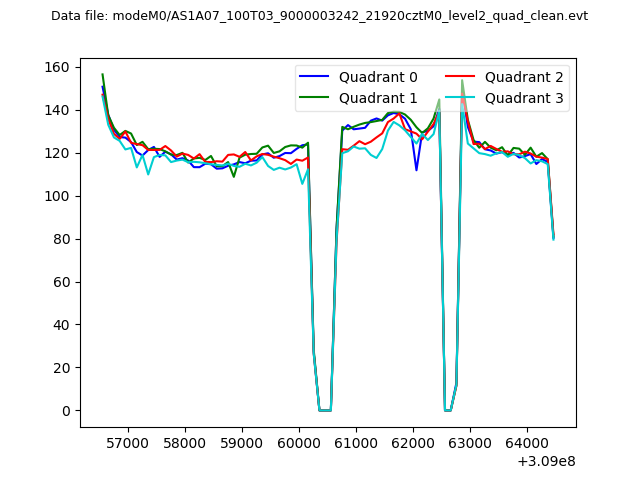 |
|
| Module-wise count rates for Quadrant A Data is divided into 100 sec bins |
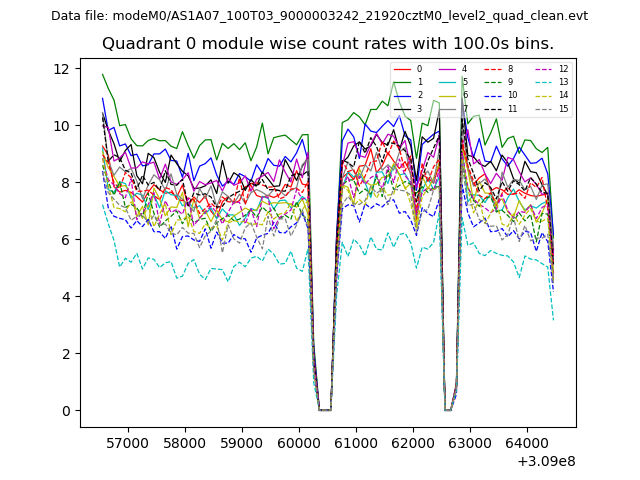 |
 |
| Module-wise count rates for Quadrant B Data is divided into 100 sec bins |
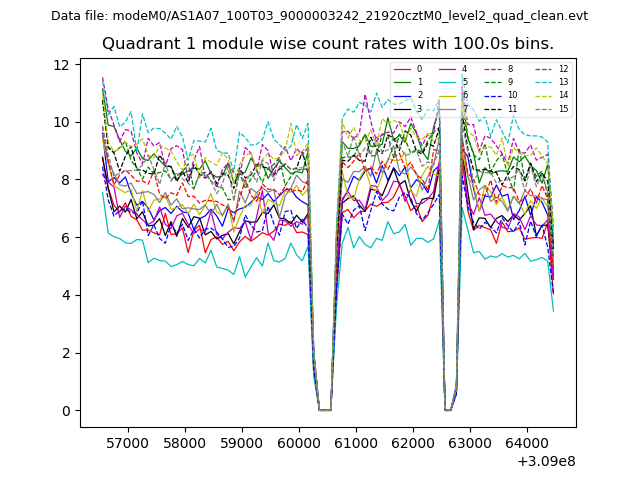 |
 |
| Module-wise count rates for Quadrant C Data is divided into 100 sec bins |
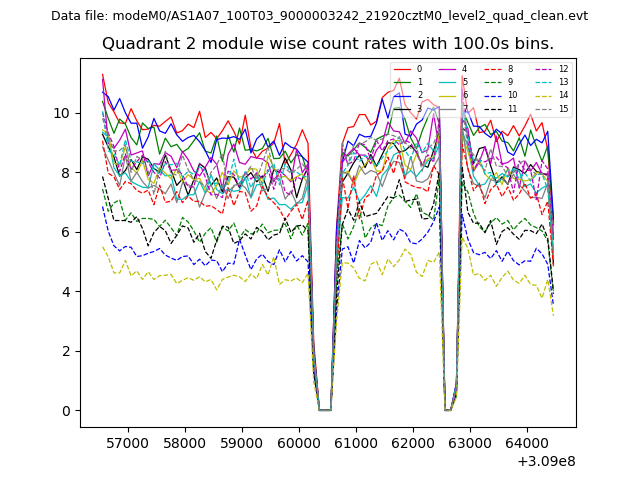 |
 |
| Module-wise count rates for Quadrant D Data is divided into 100 sec bins |
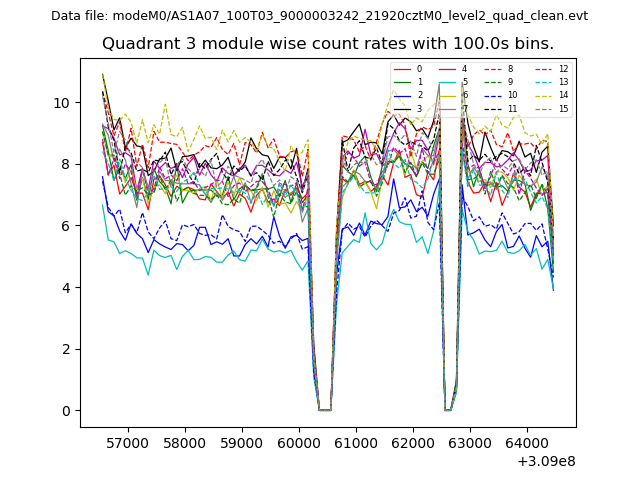 |
 |
| Parameter | Plot |
|---|---|
| CZT HV Monitor | 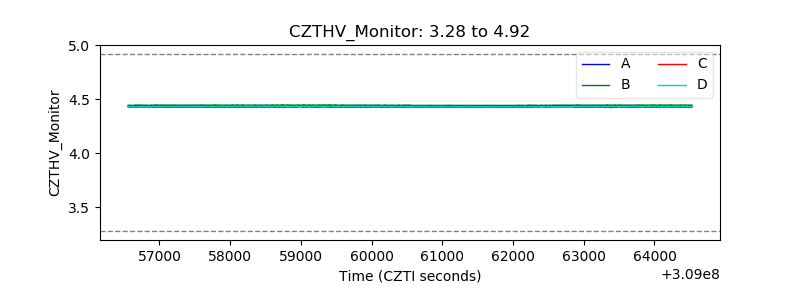 |
| D_VDD | 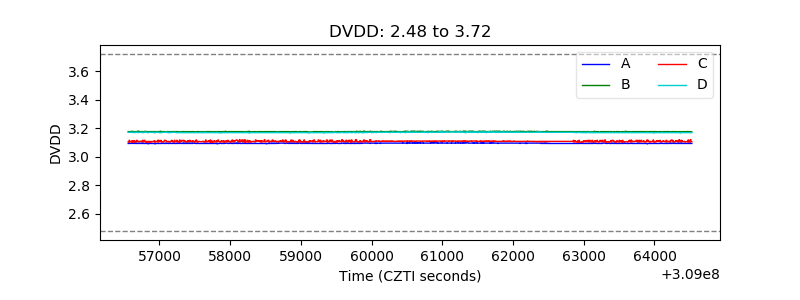 |
| Temperature 1 | 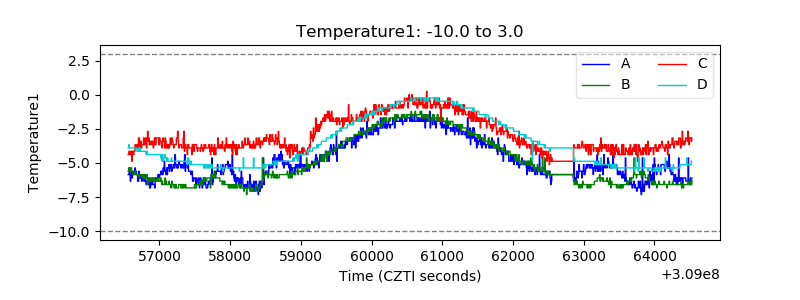 |
| Veto HV Monitor | 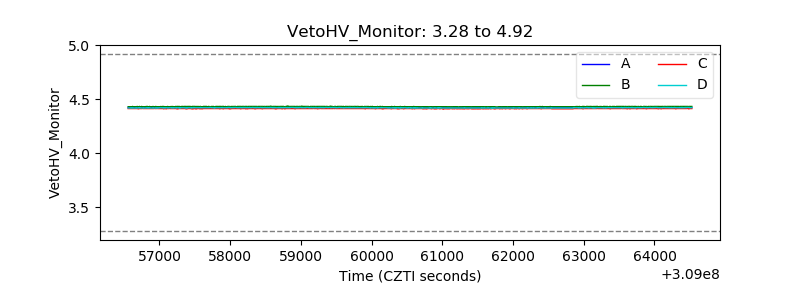 |
| Veto LLD | 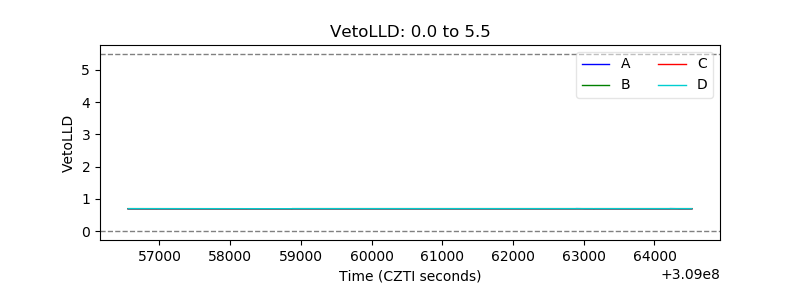 |
| Alpha Counter | 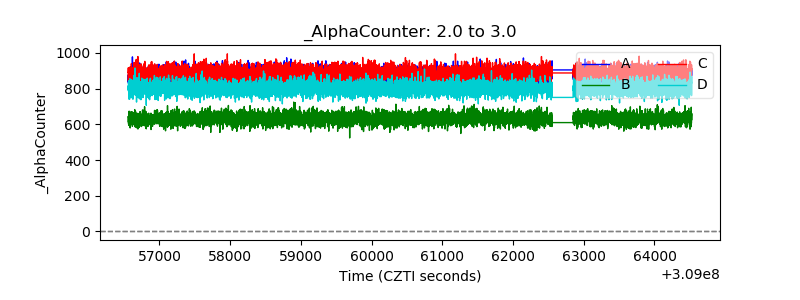 |
| _CPM_Rate | 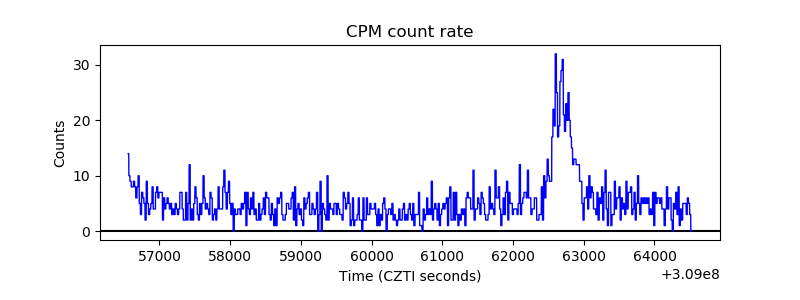 |
| CZT Counter | 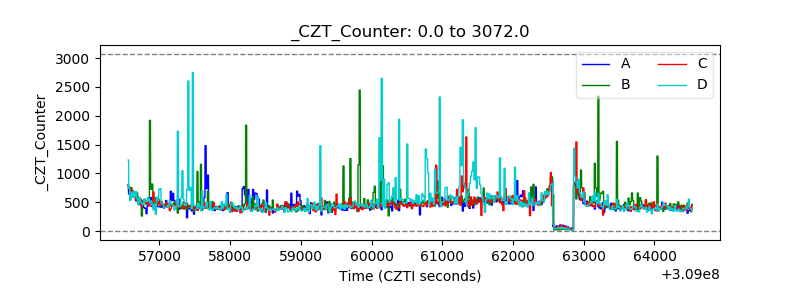 |
| +2.5 Volts monitor |  |
| +5 Volts monitor |  |
| _ROLL_ROT | 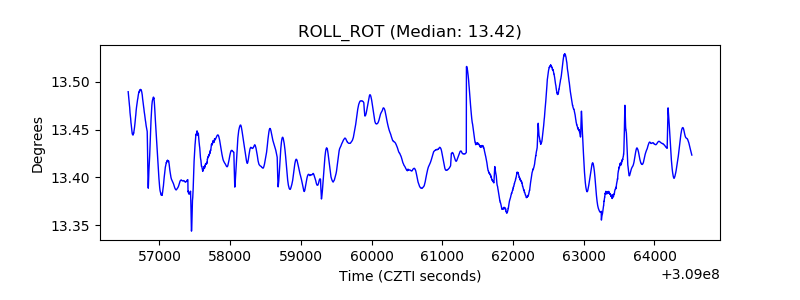 |
| _Roll_DEC | 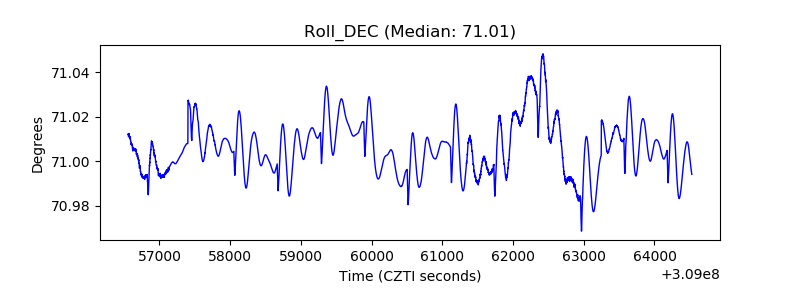 |
| _Roll_RA | 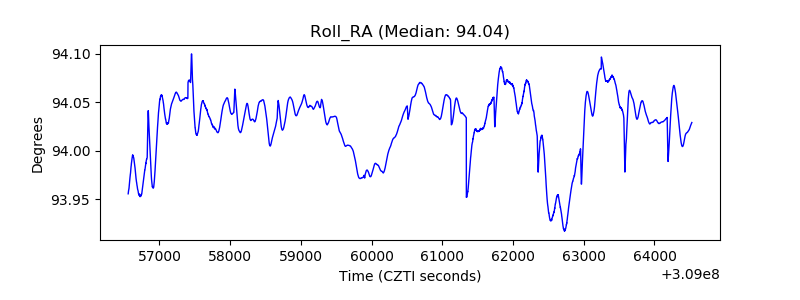 |
| Veto Counter | 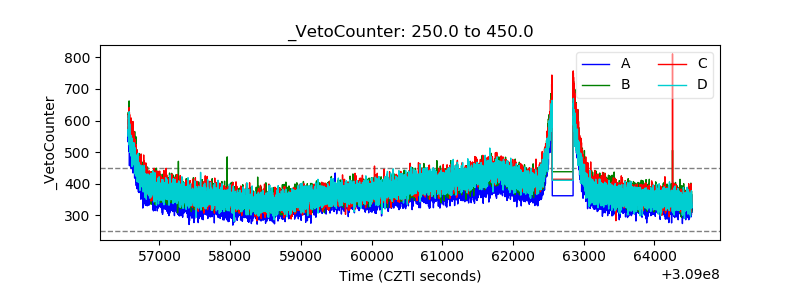 |