| Param | Original file | Final file |
|---|---|---|
| Filename | modeM0/AS1A07_100T03_9000003242_21922cztM0_level2.evt | modeM0/AS1A07_100T03_9000003242_21922cztM0_level2_quad_clean.evt |
| Size (bytes) | 483,840,000 | 132,701,760 |
| Size | 461.4 MB | 126.6 MB |
| Events in quadrant A | 3,410,290 | 878,447 |
| Events in quadrant B | 3,692,471 | 892,540 |
| Events in quadrant C | 3,451,561 | 872,848 |
| Events in quadrant D | 3,587,552 | 852,212 |
| Mode M0 | |||
|---|---|---|---|
| Quadrant | BADHDUFLAG | Total packets | Discarded packets |
| A | 0 | 15419 | 2 |
| B | 0 | 15993 | 2 |
| C | 0 | 15406 | 2 |
| D | 0 | 16134 | 2 |
| Mode SS | |||
|---|---|---|---|
| Quadrant | BADHDUFLAG | Total packets | Discarded packets |
| A | 0 | 152 | 0 |
| B | 0 | 152 | 0 |
| C | 0 | 152 | 0 |
| D | 0 | 152 | 0 |
| Mode M9 | |||
|---|---|---|---|
| Quadrant | BADHDUFLAG | Total packets | Discarded packets |
| A | 0 | 6 | 0 |
| B | 0 | 7 | 0 |
| C | 0 | 7 | 0 |
| D | 0 | 7 | 0 |
| Quadrant | Total seconds | Saturated seconds | Saturation percentage |
|---|---|---|---|
| A | 7523 | 45 | 0.598166% |
| B | 7523 | 103 | 1.369135% |
| C | 7523 | 72 | 0.957065% |
| D | 7523 | 63 | 0.837432% |
Noise dominated data is calculated using 1-second bins in cleaned event files. If a bin has >2000 counts, and if more than 50% of those come from <1% of pixels, then it is considered to be noise-dominated and hence unusable.
| Quadrant | # 1 sec bins | Bins with >0 counts | Bins with >2000 counts | High rate bins dominated by noise | Noise dominated (total time) | Noise dominated (detector-on time) | Marked lightcurve |
|---|---|---|---|---|---|---|---|
| A | 8018 | 7523 | 0 | 0 | 0.00% | 0.00% | 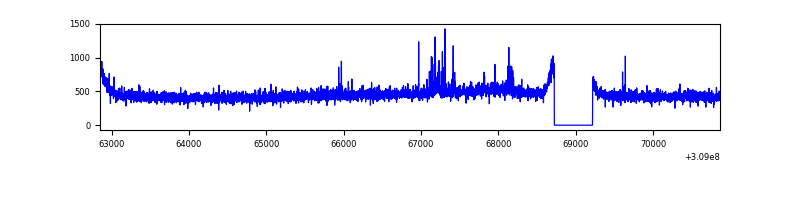 |
| B | 8018 | 7523 | 15 | 15 | 0.19% | 0.20% | 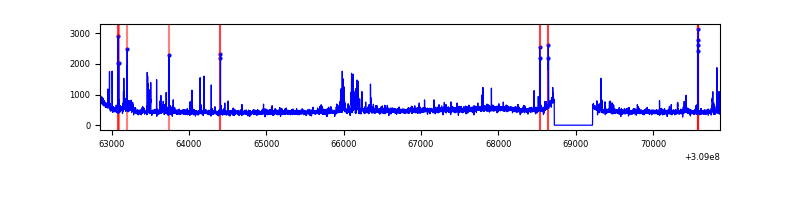 |
| C | 8018 | 7523 | 0 | 0 | 0.00% | 0.00% |  |
| D | 8018 | 7523 | 17 | 17 | 0.21% | 0.23% | 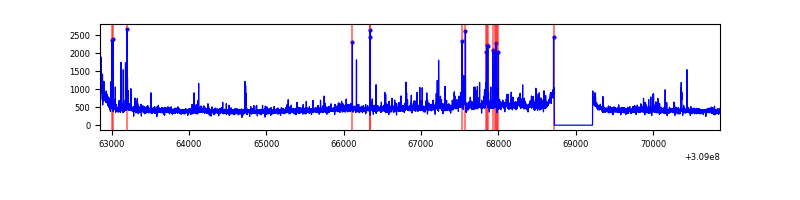 |
Top three noisy pixels from each quadrant. If the there are fewer than three noisy pixels in the level2.evt file, extra rows are filled as -1
| Pixel properties | Quadrant properties | ||||||
|---|---|---|---|---|---|---|---|
| Quadrant | DetID | PixID | Counts | Sigma | Mean | Median | Sigma |
| A | 4 | 2 | 43846 | 243.15 | 871 | 851 | 176.8 |
| A | 13 | 254 | 13533 | 71.72 | 871 | 851 | 176.8 |
| A | 3 | 137 | 7485 | 37.52 | 871 | 851 | 176.8 |
| B | 3 | 64 | 116477 | 692.49 | 871 | 848 | 167.0 |
| B | 0 | 197 | 71657 | 424.07 | 871 | 848 | 167.0 |
| B | 0 | 230 | 49364 | 290.56 | 871 | 848 | 167.0 |
| C | 14 | 238 | 132359 | 672.34 | 842 | 848 | 195.6 |
| C | 10 | 22 | 18458 | 90.03 | 842 | 848 | 195.6 |
| C | 8 | 128 | 12994 | 62.1 | 842 | 848 | 195.6 |
| D | 1 | 52 | 254898 | 1246.01 | 847 | 821 | 203.9 |
| D | 2 | 234 | 32008 | 152.94 | 847 | 821 | 203.9 |
| D | 12 | 235 | 30977 | 147.89 | 847 | 821 | 203.9 |
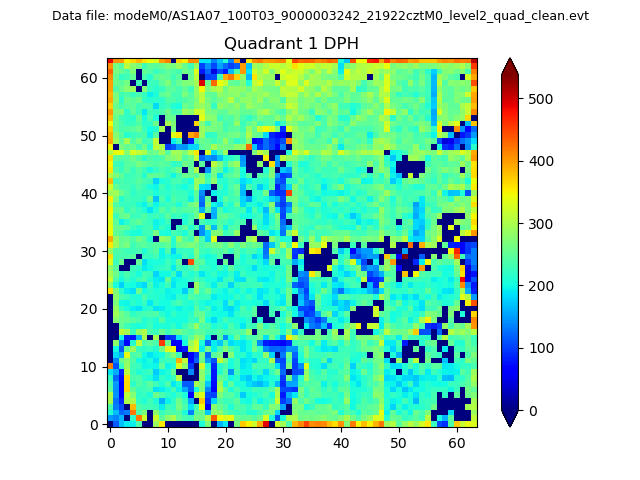
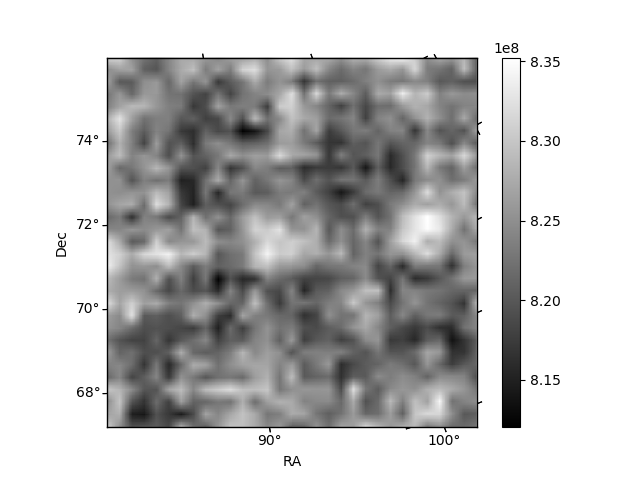
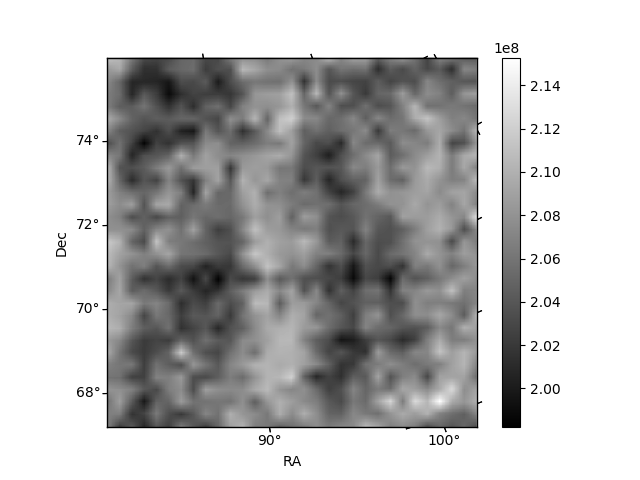
Histogram calculated using DETX and DETY for each event in the final _common_clean file
| Quadrant A |  |
 |
Quadrant B |
|---|---|---|---|
| Quadrant D |  |
 |
Quadrant C |
| Plot type | Count rate plots | Images |
|---|---|---|
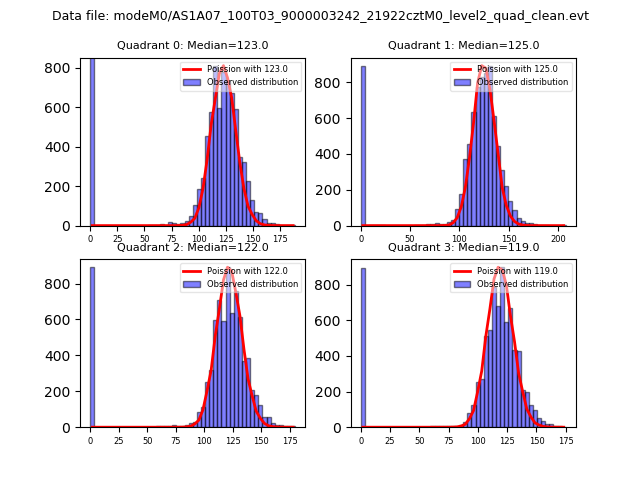
| Comparison with Poisson distribution Blue bars denote a histogram of data divided into 1 sec bins. Red curve is a Poisson curve with rate = median count rate of data. |
 |
 |
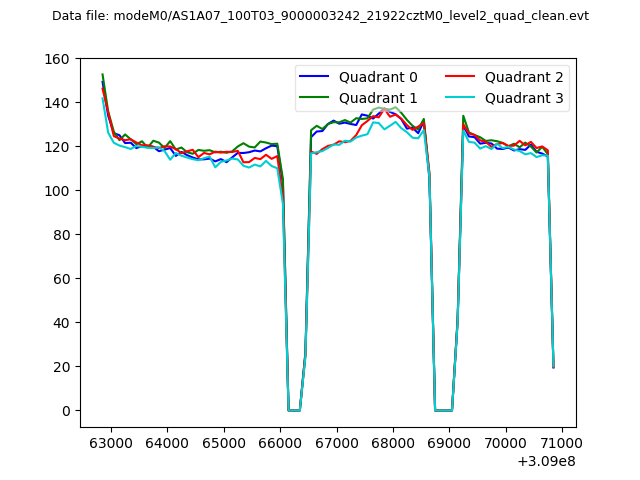
| Quadrant-wise count rates Data is divided into 100 sec bins |
 |
|
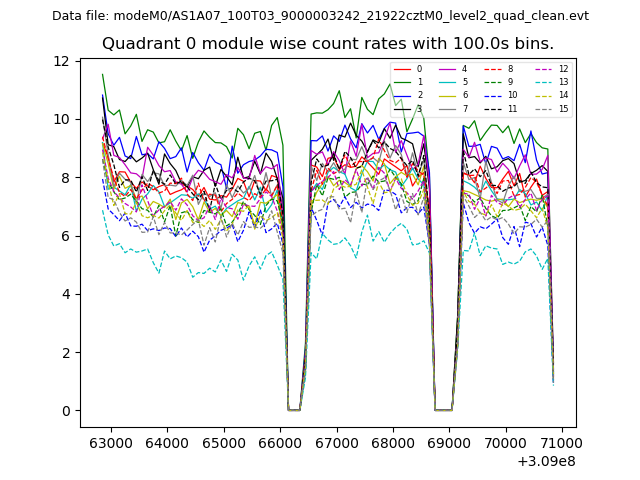
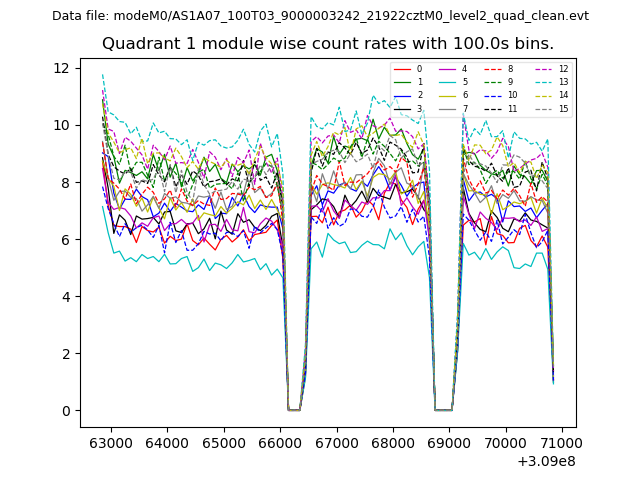
| Module-wise count rates for Quadrant A Data is divided into 100 sec bins |
 |
 |
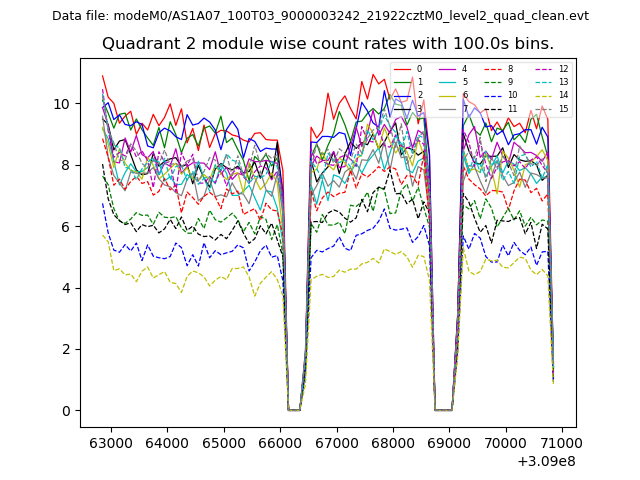
| Module-wise count rates for Quadrant B Data is divided into 100 sec bins |
 |
 |
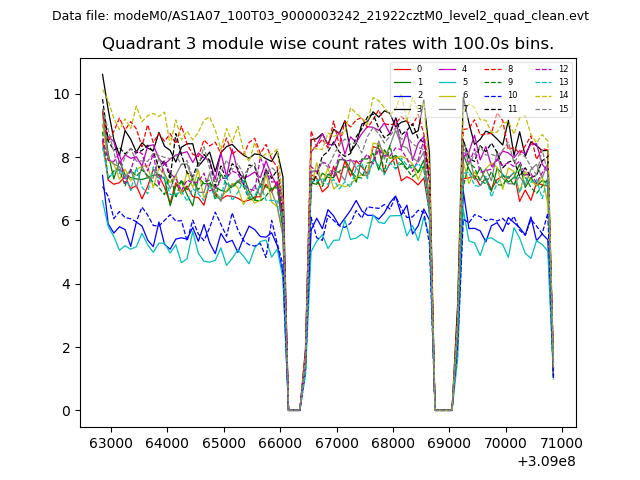
| Module-wise count rates for Quadrant C Data is divided into 100 sec bins |
 |
 |
| Module-wise count rates for Quadrant D Data is divided into 100 sec bins |
 |
 |
| Parameter | Plot |
|---|---|
| CZT HV Monitor | 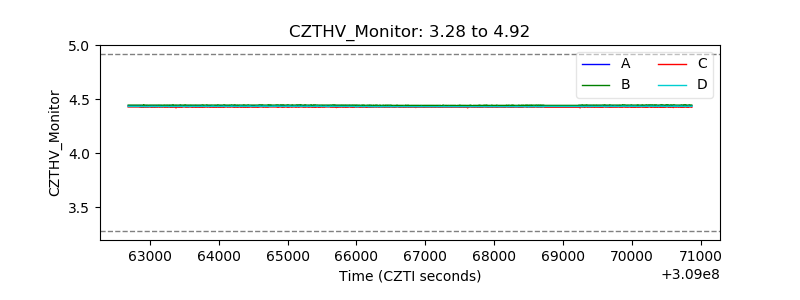 |
| D_VDD | 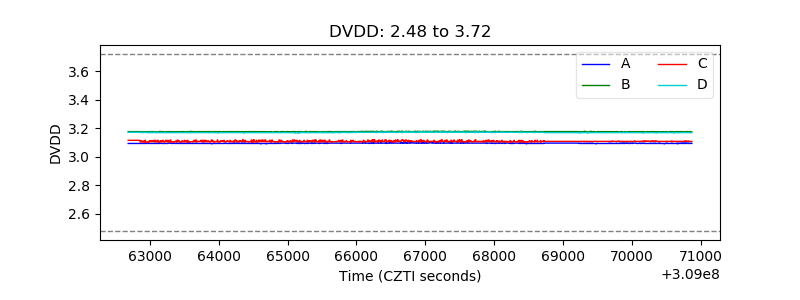 |
| Temperature 1 | 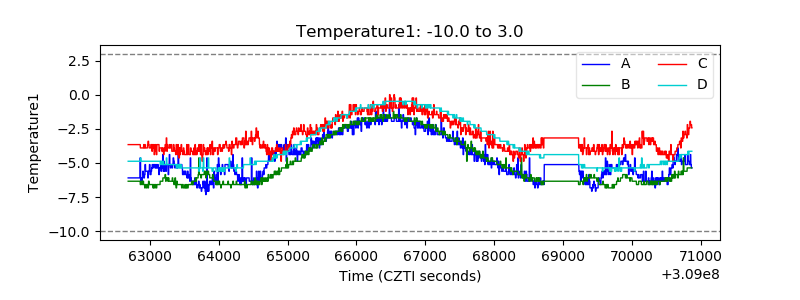 |
| Veto HV Monitor | 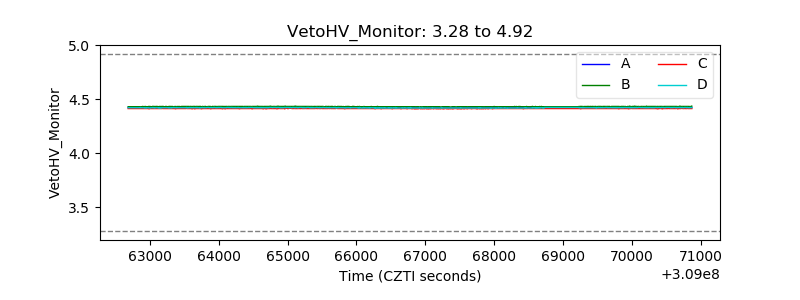 |
| Veto LLD | 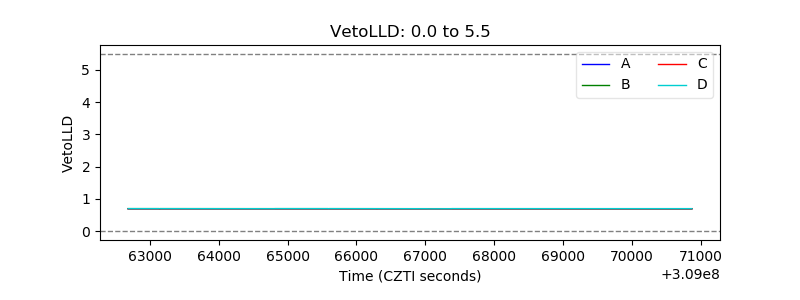 |
| Alpha Counter | 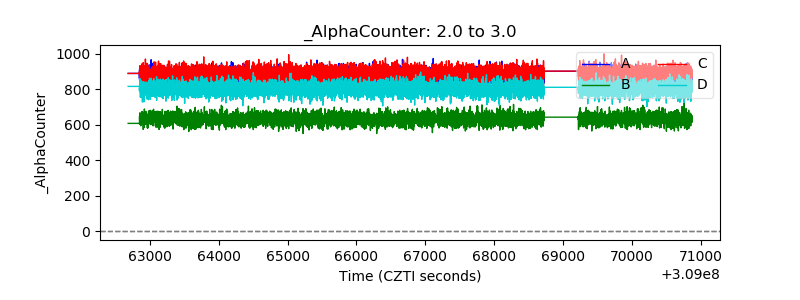 |
| _CPM_Rate | 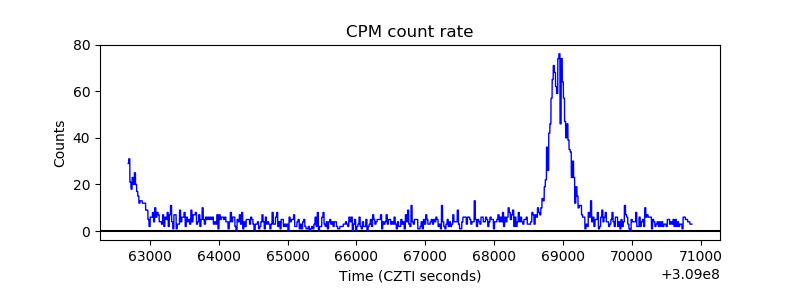 |
| CZT Counter | 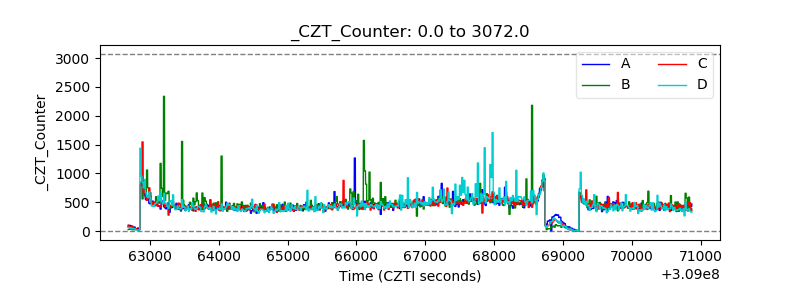 |
| +2.5 Volts monitor |  |
| +5 Volts monitor |  |
| _ROLL_ROT | 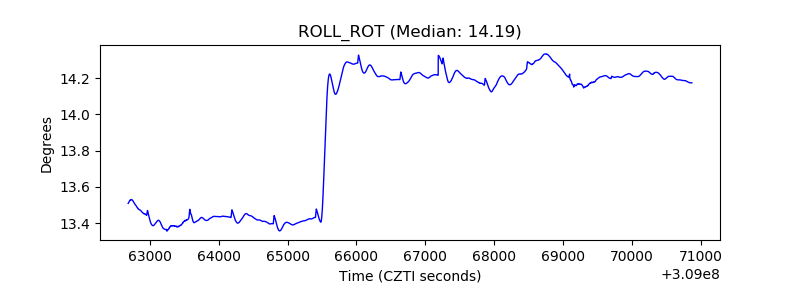 |
| _Roll_DEC | 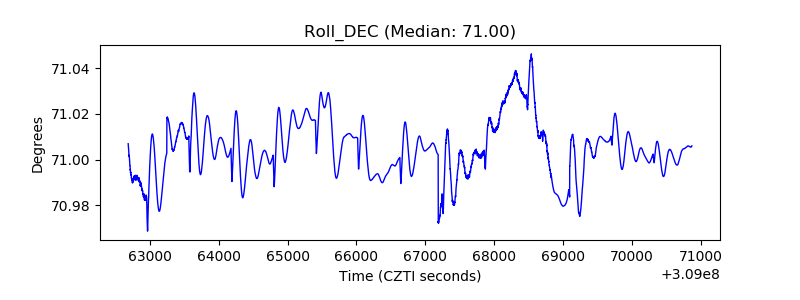 |
| _Roll_RA | 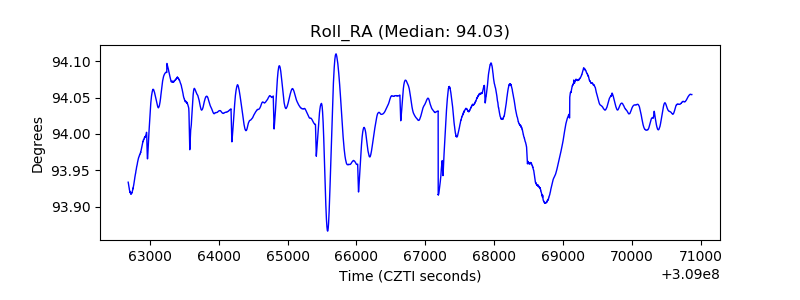 |
| Veto Counter | 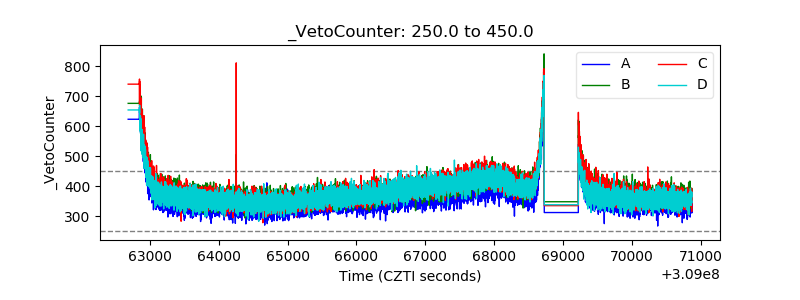 |