| Param | Original file | Final file |
|---|---|---|
| Filename | modeM0/AS1A07_100T03_9000003242_21923cztM0_level2.evt | modeM0/AS1A07_100T03_9000003242_21923cztM0_level2_quad_clean.evt |
| Size (bytes) | 839,920,320 | 202,671,360 |
| Size | 801.0 MB | 193.3 MB |
| Events in quadrant A | 5,393,367 | 1,355,724 |
| Events in quadrant B | 5,894,348 | 1,370,090 |
| Events in quadrant C | 5,381,102 | 1,334,378 |
| Events in quadrant D | 7,982,916 | 1,276,083 |
| Mode M0 | |||
|---|---|---|---|
| Quadrant | BADHDUFLAG | Total packets | Discarded packets |
| A | 0 | 23748 | 2 |
| B | 0 | 24980 | 2 |
| C | 0 | 23638 | 2 |
| D | 0 | 31613 | 2 |
| Mode SS | |||
|---|---|---|---|
| Quadrant | BADHDUFLAG | Total packets | Discarded packets |
| A | 0 | 236 | 0 |
| B | 0 | 236 | 0 |
| C | 0 | 236 | 0 |
| D | 0 | 236 | 0 |
| Mode M9 | |||
|---|---|---|---|
| Quadrant | BADHDUFLAG | Total packets | Discarded packets |
| A | 0 | 16 | 0 |
| B | 0 | 16 | 0 |
| C | 0 | 16 | 0 |
| D | 0 | 16 | 0 |
| Quadrant | Total seconds | Saturated seconds | Saturation percentage |
|---|---|---|---|
| A | 11598 | 82 | 0.707018% |
| B | 11599 | 157 | 1.353565% |
| C | 11599 | 114 | 0.982843% |
| D | 11599 | 721 | 6.216053% |
Noise dominated data is calculated using 1-second bins in cleaned event files. If a bin has >2000 counts, and if more than 50% of those come from <1% of pixels, then it is considered to be noise-dominated and hence unusable.
| Quadrant | # 1 sec bins | Bins with >0 counts | Bins with >2000 counts | High rate bins dominated by noise | Noise dominated (total time) | Noise dominated (detector-on time) | Marked lightcurve |
|---|---|---|---|---|---|---|---|
| A | 13148 | 11598 | 15 | 15 | 0.11% | 0.13% |  |
| B | 13149 | 11599 | 68 | 68 | 0.52% | 0.59% |  |
| C | 13149 | 11599 | 7 | 7 | 0.05% | 0.06% |  |
| D | 13149 | 11599 | 634 | 634 | 4.82% | 5.47% | 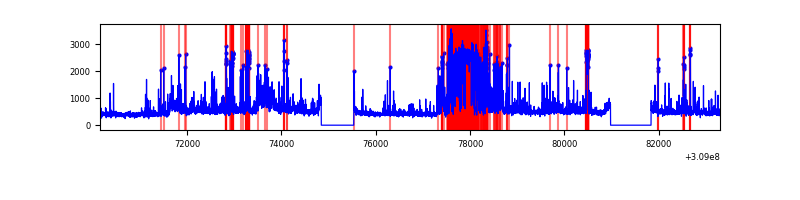 |
Top three noisy pixels from each quadrant. If the there are fewer than three noisy pixels in the level2.evt file, extra rows are filled as -1
| Pixel properties | Quadrant properties | ||||||
|---|---|---|---|---|---|---|---|
| Quadrant | DetID | PixID | Counts | Sigma | Mean | Median | Sigma |
| A | 4 | 2 | 136568 | 492.33 | 1360 | 1329 | 274.7 |
| A | 13 | 254 | 20304 | 69.08 | 1360 | 1329 | 274.7 |
| A | 0 | 226 | 11662 | 37.62 | 1360 | 1329 | 274.7 |
| B | 3 | 64 | 361936 | 1415.56 | 1349 | 1314 | 254.8 |
| B | 0 | 197 | 97291 | 376.74 | 1349 | 1314 | 254.8 |
| B | 6 | 36 | 55967 | 214.53 | 1349 | 1314 | 254.8 |
| C | 14 | 238 | 208515 | 683.32 | 1304 | 1311 | 303.2 |
| C | 10 | 22 | 91713 | 298.13 | 1304 | 1311 | 303.2 |
| C | 13 | 61 | 9140 | 25.82 | 1304 | 1311 | 303.2 |
| D | 1 | 52 | 2450137 | 7902.69 | 1286 | 1247 | 309.9 |
| D | 12 | 235 | 331317 | 1065.15 | 1286 | 1247 | 309.9 |
| D | 2 | 136 | 87462 | 278.22 | 1286 | 1247 | 309.9 |
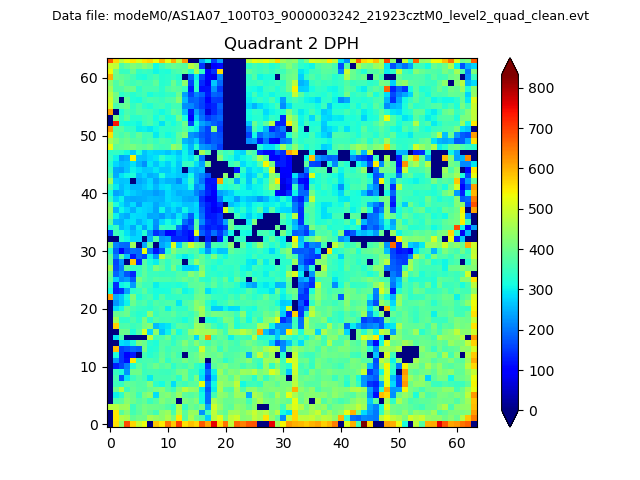
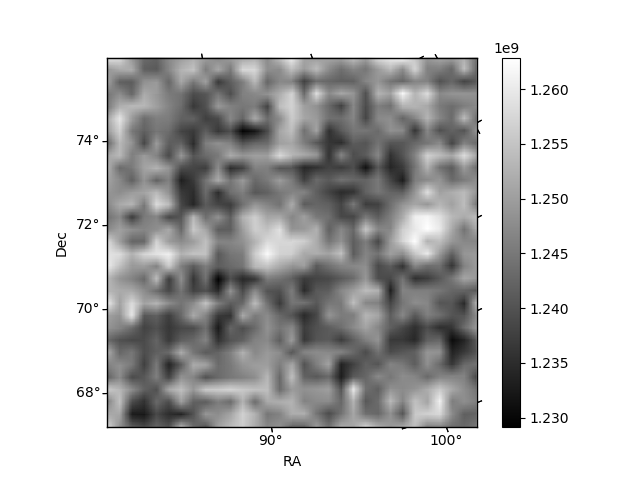
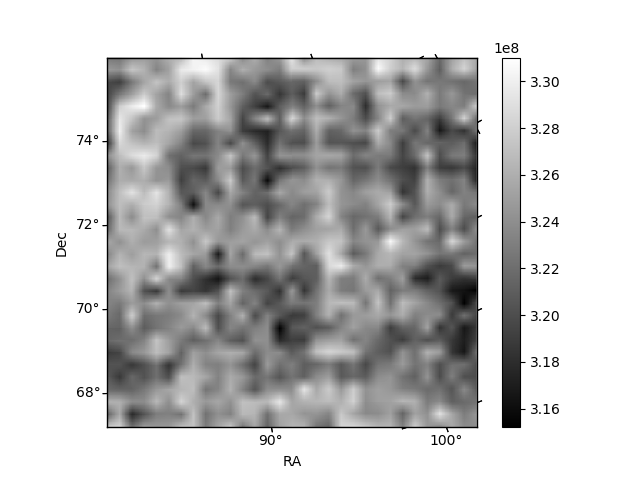
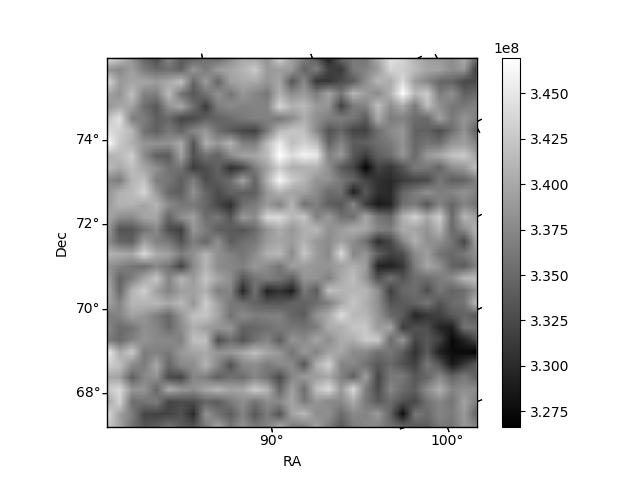
Histogram calculated using DETX and DETY for each event in the final _common_clean file
| Quadrant A |  |
 |
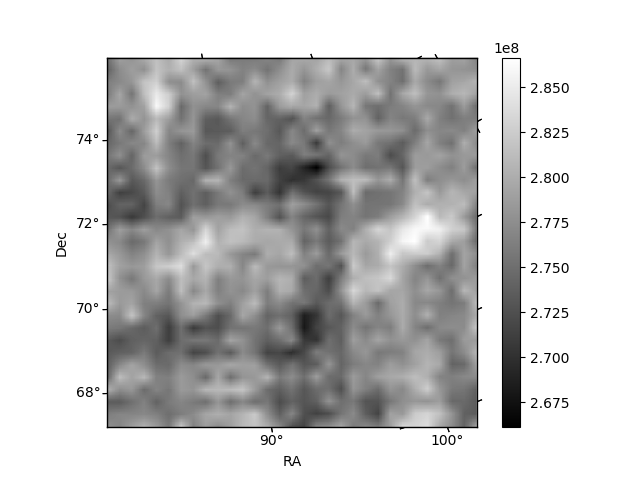
Quadrant B |
|---|---|---|---|
| Quadrant D | 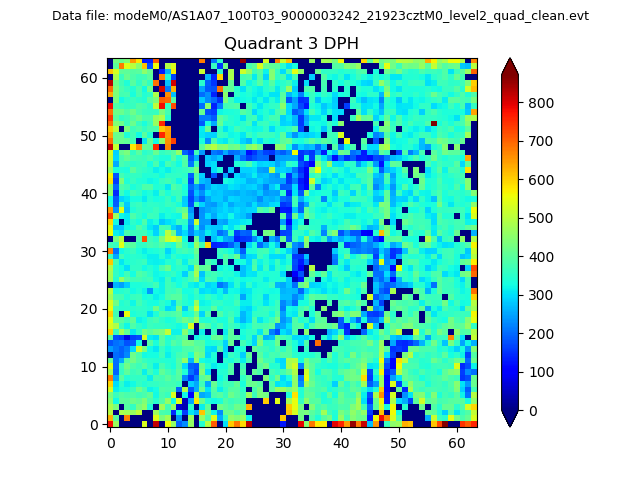 |
 |
Quadrant C |
| Plot type | Count rate plots | Images |
|---|---|---|
| Comparison with Poisson distribution Blue bars denote a histogram of data divided into 1 sec bins. Red curve is a Poisson curve with rate = median count rate of data. |
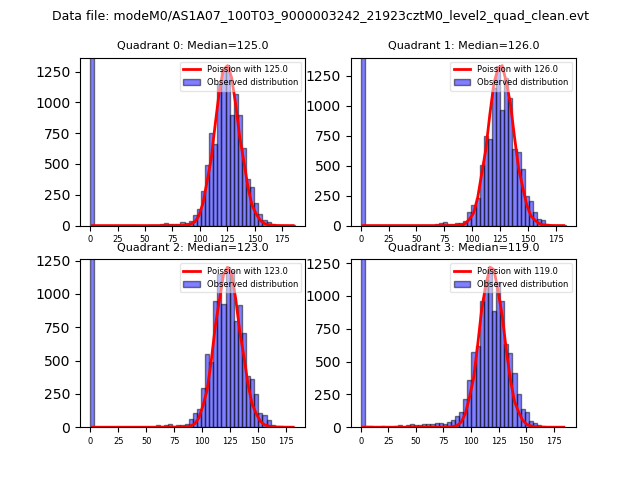 |
 |
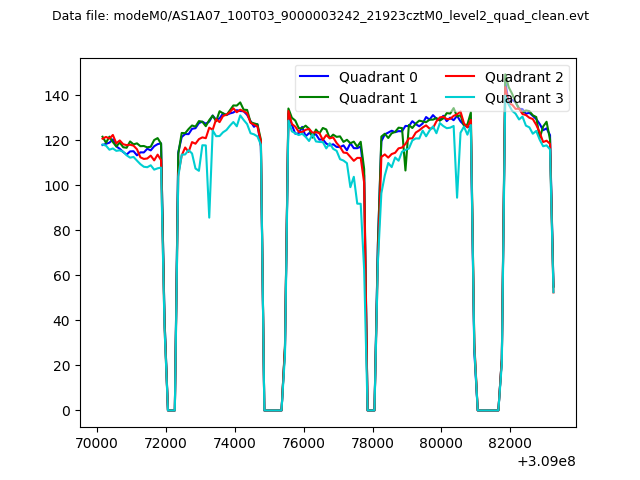
| Quadrant-wise count rates Data is divided into 100 sec bins |
 |
|
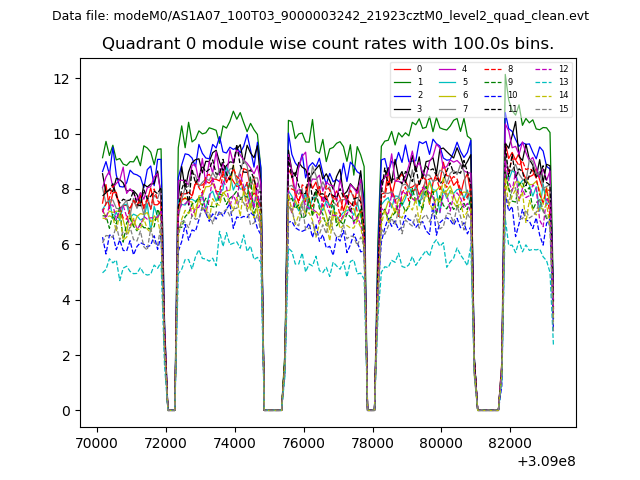
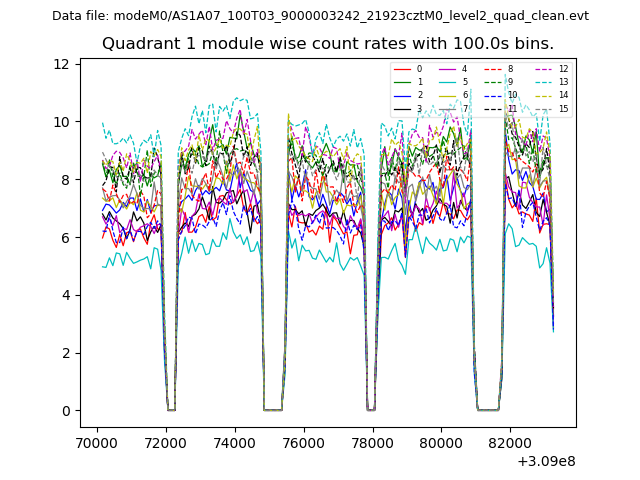
| Module-wise count rates for Quadrant A Data is divided into 100 sec bins |
 |
 |
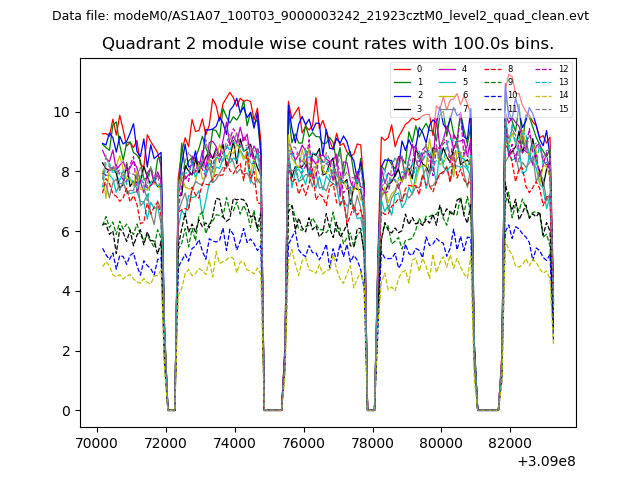
| Module-wise count rates for Quadrant B Data is divided into 100 sec bins |
 |
 |
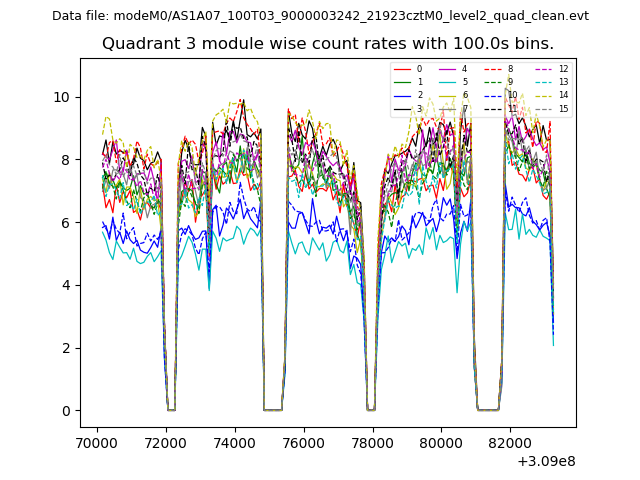
| Module-wise count rates for Quadrant C Data is divided into 100 sec bins |
 |
 |
| Module-wise count rates for Quadrant D Data is divided into 100 sec bins |
 |
 |
| Parameter | Plot |
|---|---|
| CZT HV Monitor | 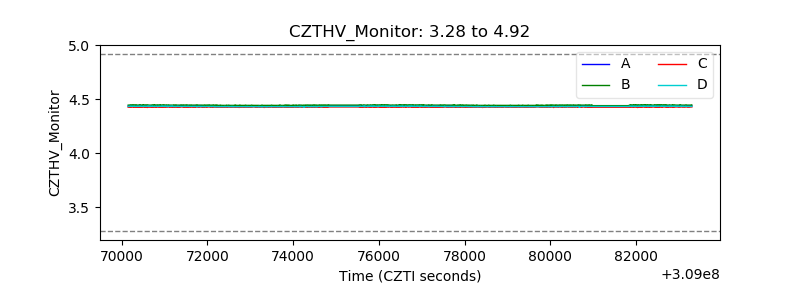 |
| D_VDD | 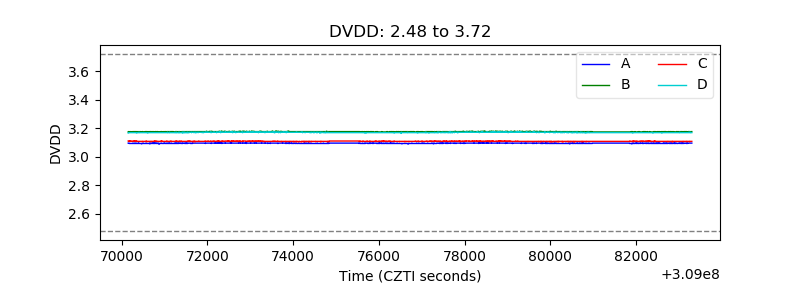 |
| Temperature 1 | 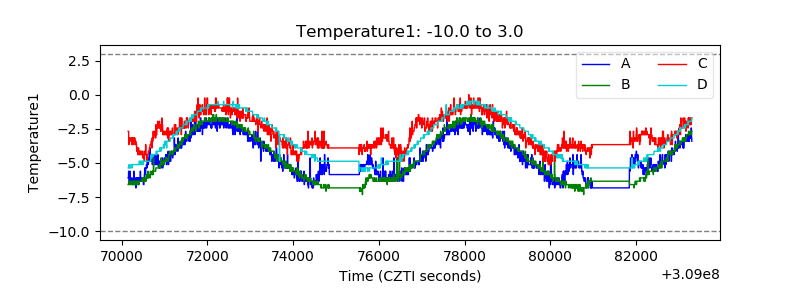 |
| Veto HV Monitor | 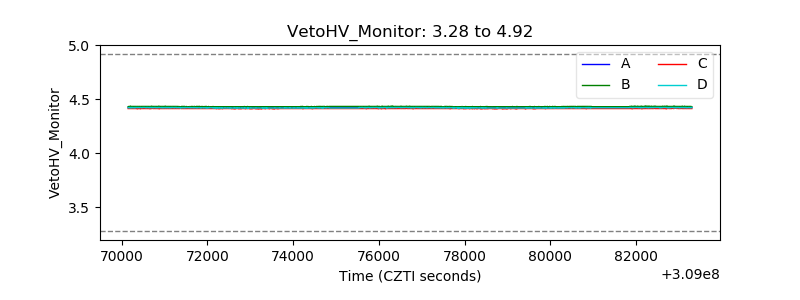 |
| Veto LLD | 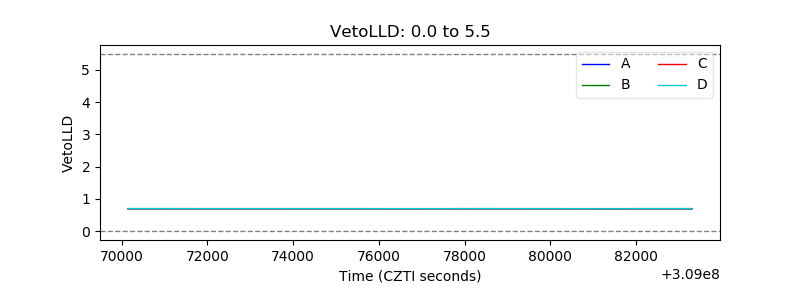 |
| Alpha Counter | 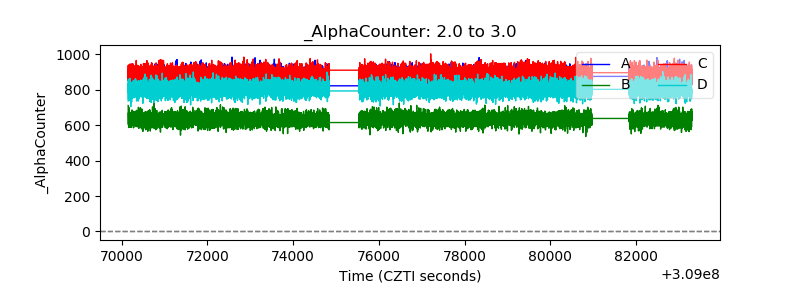 |
| _CPM_Rate | 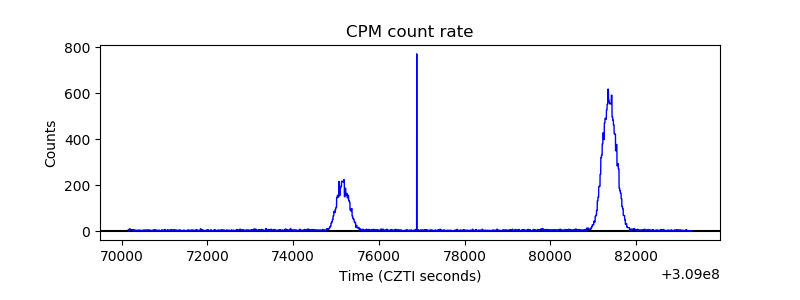 |
| CZT Counter | 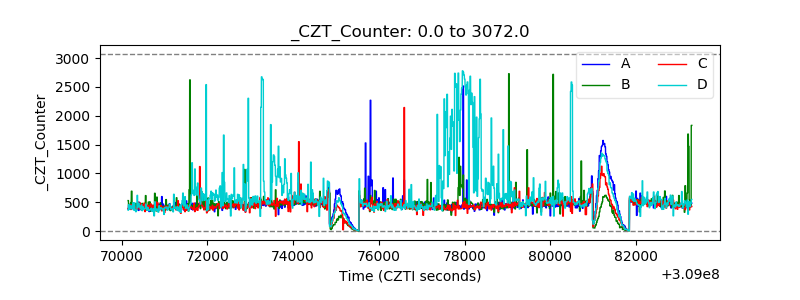 |
| +2.5 Volts monitor |  |
| +5 Volts monitor |  |
| _ROLL_ROT | 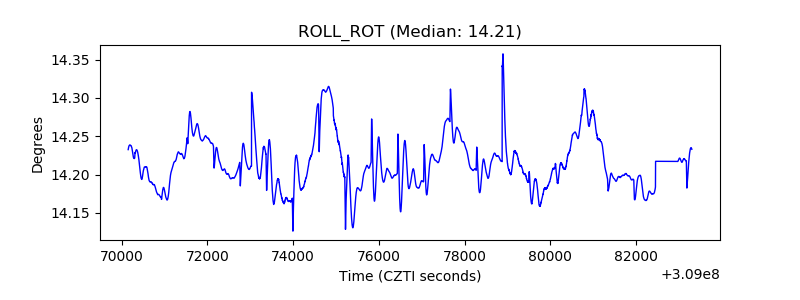 |
| _Roll_DEC | 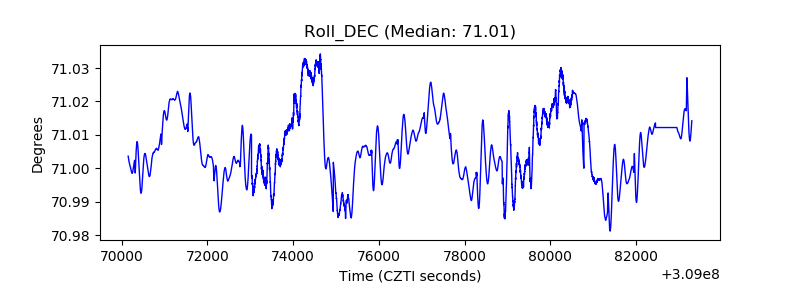 |
| _Roll_RA | 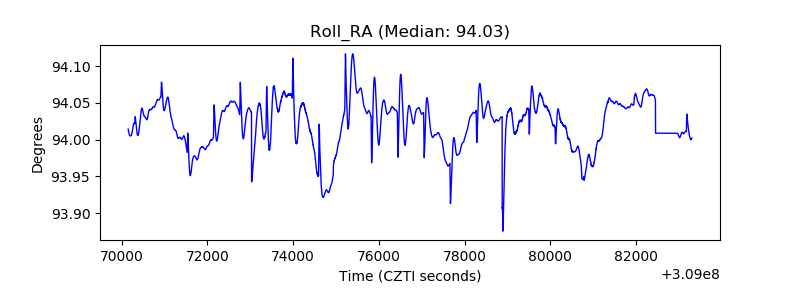 |
| Veto Counter | 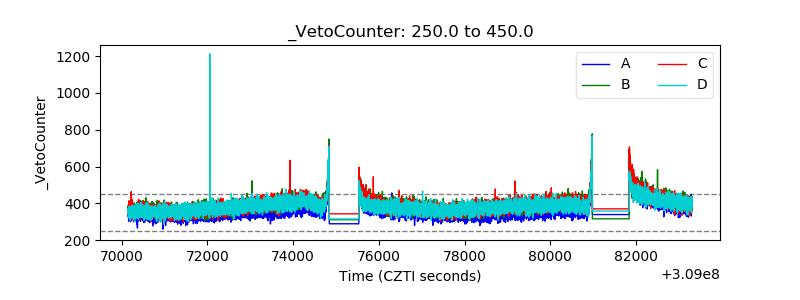 |