| Param | Original file | Final file |
|---|---|---|
| Filename | modeM0/AS1A07_100T03_9000003242_21926cztM0_level2.evt | modeM0/AS1A07_100T03_9000003242_21926cztM0_level2_quad_clean.evt |
| Size (bytes) | 1,022,613,120 | 195,223,680 |
| Size | 975.2 MB | 186.2 MB |
| Events in quadrant A | 5,228,335 | 1,362,614 |
| Events in quadrant B | 11,916,555 | 1,222,171 |
| Events in quadrant C | 5,219,381 | 1,315,050 |
| Events in quadrant D | 7,866,481 | 1,254,607 |
| Mode M0 | |||
|---|---|---|---|
| Quadrant | BADHDUFLAG | Total packets | Discarded packets |
| A | 0 | 22649 | 2 |
| B | 0 | 42781 | 2 |
| C | 0 | 22545 | 2 |
| D | 0 | 30639 | 4 |
| Mode SS | |||
|---|---|---|---|
| Quadrant | BADHDUFLAG | Total packets | Discarded packets |
| A | 0 | 222 | 0 |
| B | 0 | 222 | 0 |
| C | 0 | 222 | 0 |
| D | 0 | 222 | 0 |
| Mode M9 | |||
|---|---|---|---|
| Quadrant | BADHDUFLAG | Total packets | Discarded packets |
| A | 0 | 22 | 0 |
| B | 0 | 22 | 0 |
| C | 0 | 22 | 0 |
| D | 0 | 22 | 0 |
| Quadrant | Total seconds | Saturated seconds | Saturation percentage |
|---|---|---|---|
| A | 10947 | 88 | 0.803873% |
| B | 10947 | 2601 | 23.759934% |
| C | 10947 | 127 | 1.160135% |
| D | 10946 | 579 | 5.289604% |
Noise dominated data is calculated using 1-second bins in cleaned event files. If a bin has >2000 counts, and if more than 50% of those come from <1% of pixels, then it is considered to be noise-dominated and hence unusable.
| Quadrant | # 1 sec bins | Bins with >0 counts | Bins with >2000 counts | High rate bins dominated by noise | Noise dominated (total time) | Noise dominated (detector-on time) | Marked lightcurve |
|---|---|---|---|---|---|---|---|
| A | 13097 | 10947 | 0 | 0 | 0.00% | 0.00% | 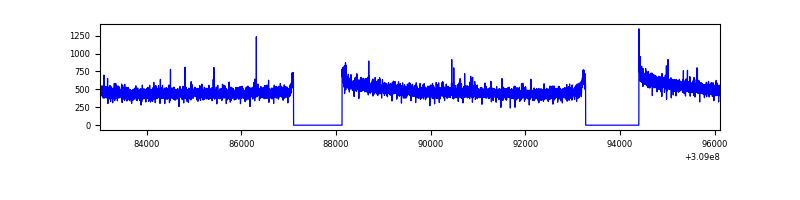 |
| B | 13096 | 10946 | 2347 | 2347 | 17.92% | 21.44% | 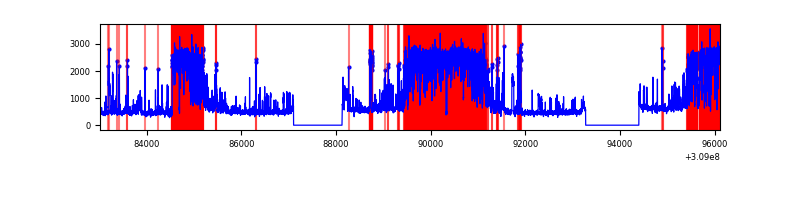 |
| C | 13097 | 10948 | 0 | 0 | 0.00% | 0.00% | 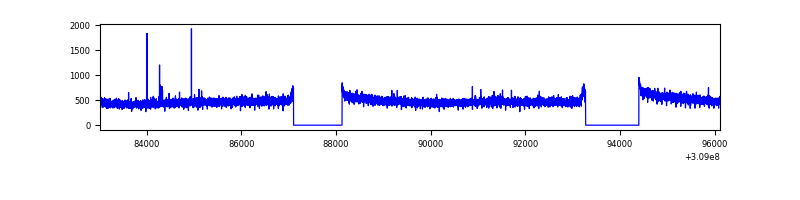 |
| D | 13096 | 10946 | 492 | 492 | 3.76% | 4.49% |  |
Top three noisy pixels from each quadrant. If the there are fewer than three noisy pixels in the level2.evt file, extra rows are filled as -1
| Pixel properties | Quadrant properties | ||||||
|---|---|---|---|---|---|---|---|
| Quadrant | DetID | PixID | Counts | Sigma | Mean | Median | Sigma |
| A | 3 | 1 | 30981 | 109.85 | 1343 | 1317 | 270.0 |
| A | 13 | 254 | 20133 | 69.68 | 1343 | 1317 | 270.0 |
| A | 0 | 226 | 11734 | 38.58 | 1343 | 1317 | 270.0 |
| B | 0 | 85 | 6634092 | 29327.72 | 1215 | 1187 | 226.2 |
| B | 3 | 64 | 265309 | 1167.83 | 1215 | 1187 | 226.2 |
| B | 0 | 197 | 78696 | 342.71 | 1215 | 1187 | 226.2 |
| C | 14 | 238 | 206611 | 692.73 | 1281 | 1285 | 296.4 |
| C | 10 | 22 | 19995 | 63.12 | 1281 | 1285 | 296.4 |
| C | 13 | 61 | 8824 | 25.43 | 1281 | 1285 | 296.4 |
| D | 1 | 52 | 1067010 | 3483.11 | 1277 | 1240 | 306.0 |
| D | 12 | 235 | 825041 | 2692.32 | 1277 | 1240 | 306.0 |
| D | 7 | 38 | 512276 | 1670.15 | 1277 | 1240 | 306.0 |
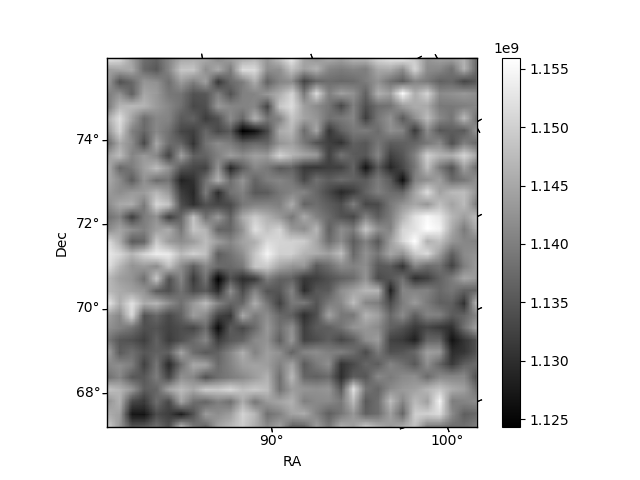
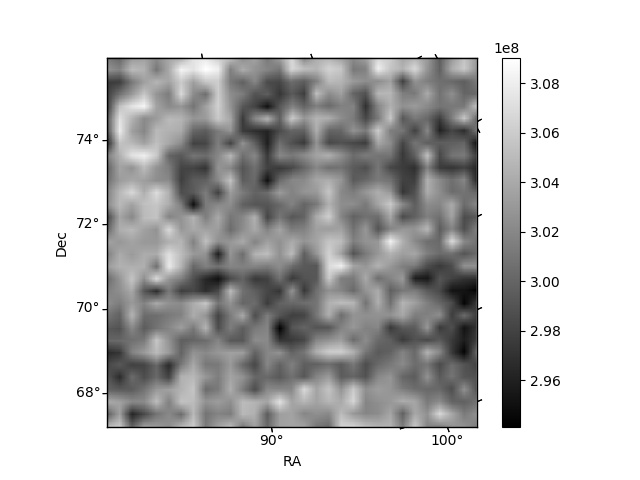
Histogram calculated using DETX and DETY for each event in the final _common_clean file
| Quadrant A |  |
 |
Quadrant B |
|---|---|---|---|
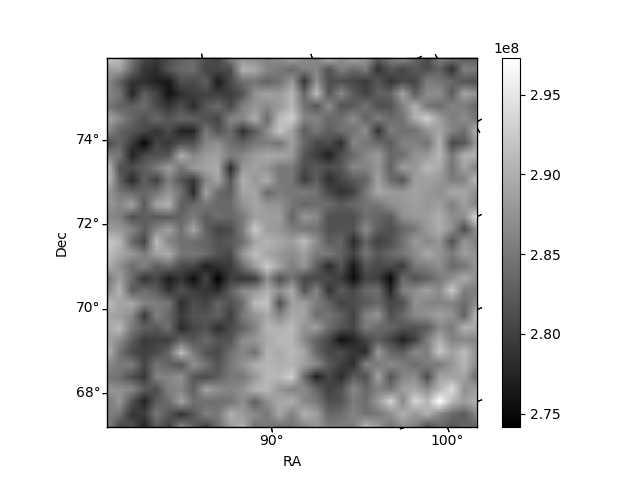
| Quadrant D |  |
 |
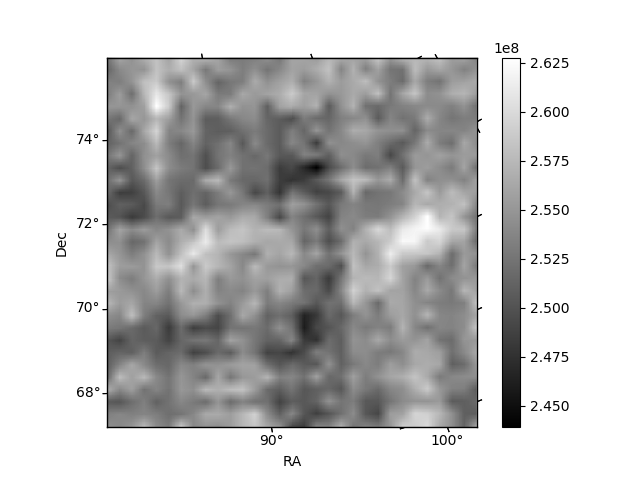
Quadrant C |
| Plot type | Count rate plots | Images |
|---|---|---|
| Comparison with Poisson distribution Blue bars denote a histogram of data divided into 1 sec bins. Red curve is a Poisson curve with rate = median count rate of data. |
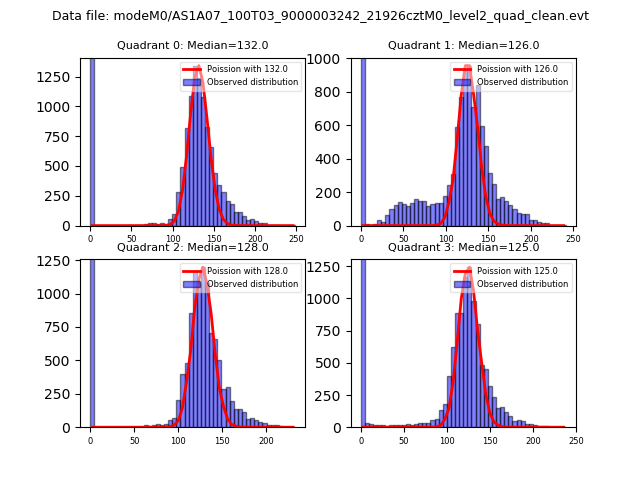 |
 |
| Quadrant-wise count rates Data is divided into 100 sec bins |
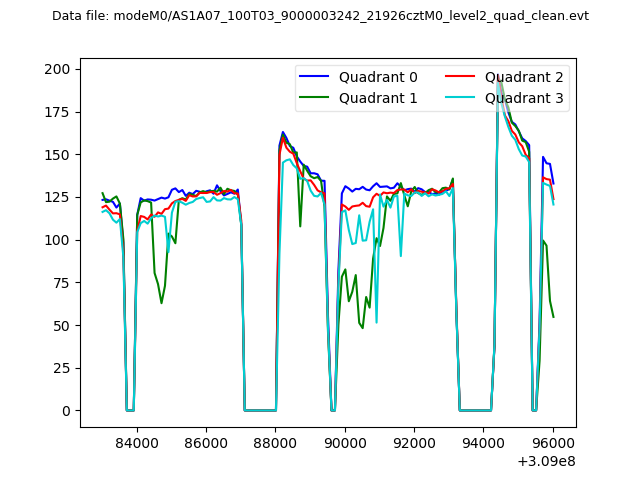 |
|
| Module-wise count rates for Quadrant A Data is divided into 100 sec bins |
 |
 |
| Module-wise count rates for Quadrant B Data is divided into 100 sec bins |
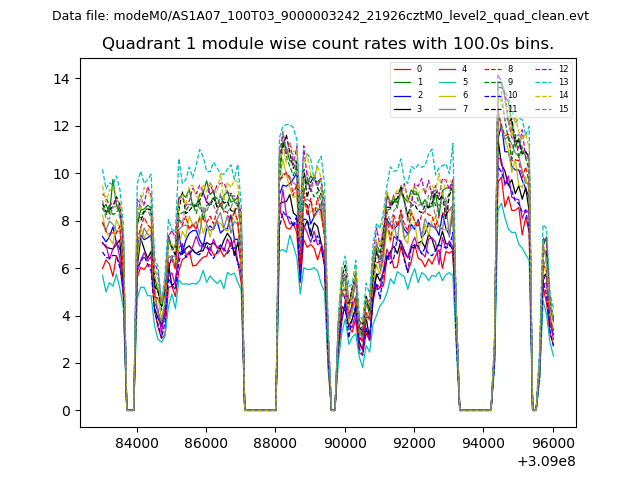 |
 |
| Module-wise count rates for Quadrant C Data is divided into 100 sec bins |
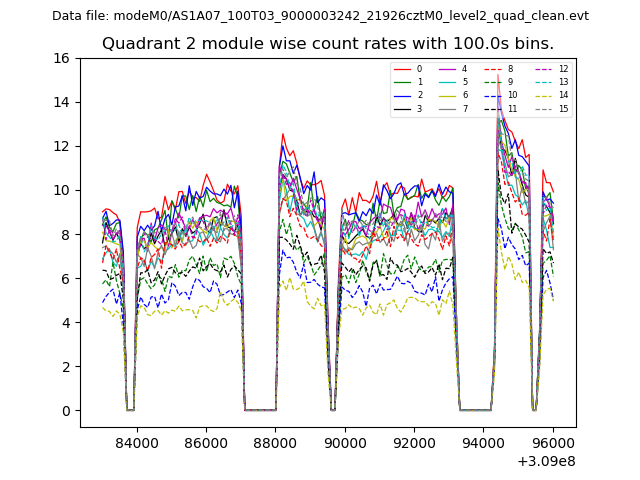 |
 |
| Module-wise count rates for Quadrant D Data is divided into 100 sec bins |
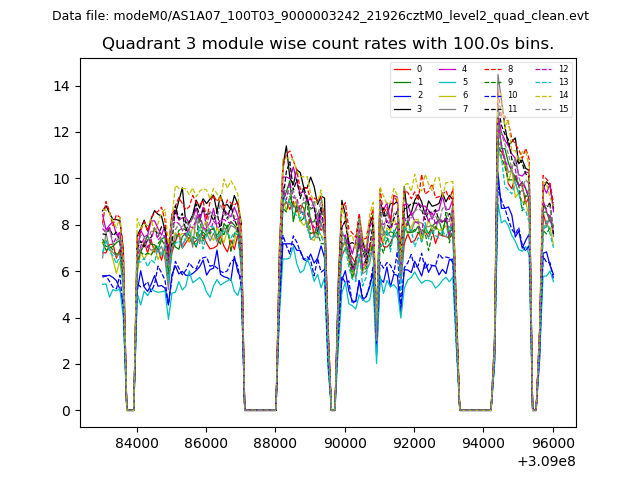 |
 |
| Parameter | Plot |
|---|---|
| CZT HV Monitor | 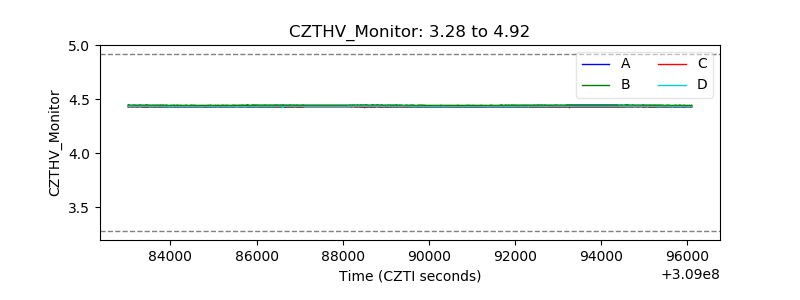 |
| D_VDD | 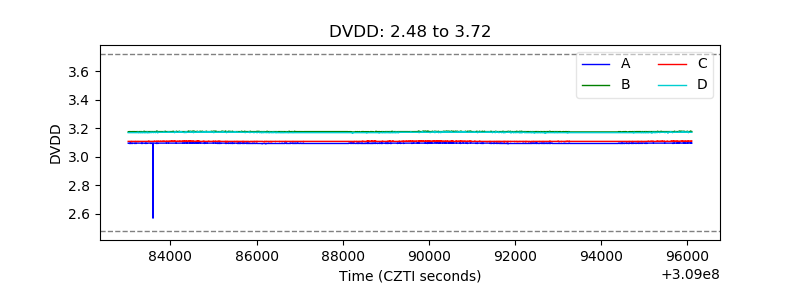 |
| Temperature 1 | 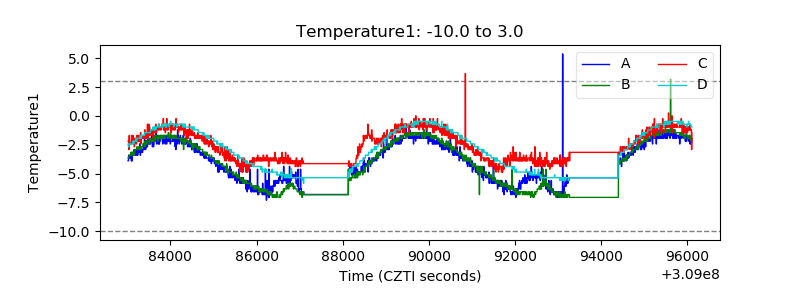 |
| Veto HV Monitor | 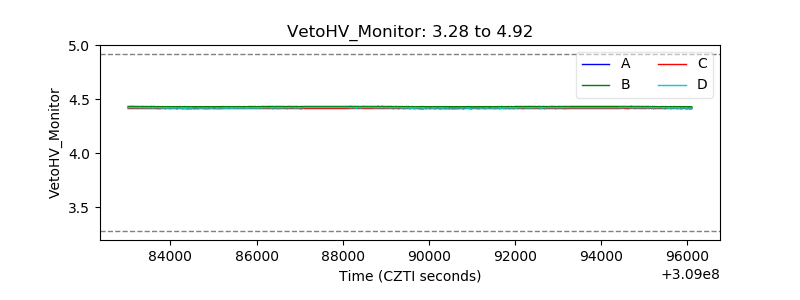 |
| Veto LLD | 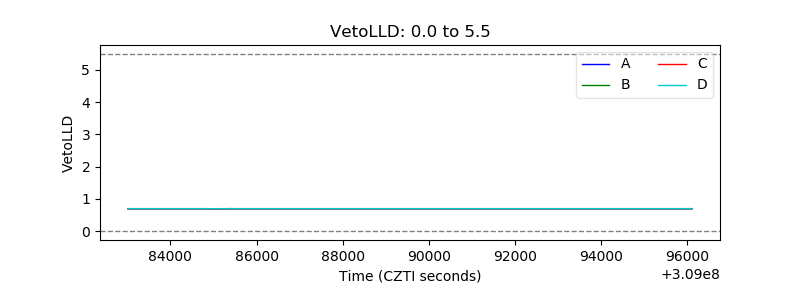 |
| Alpha Counter | 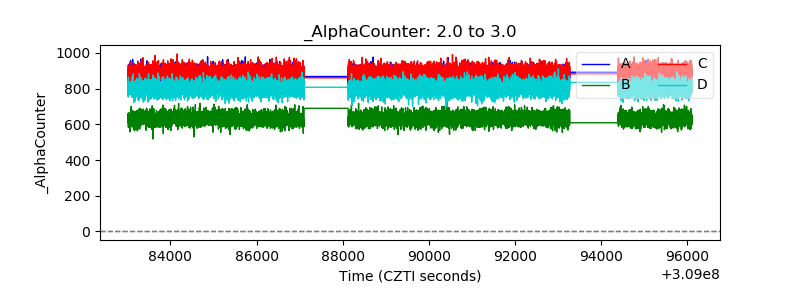 |
| _CPM_Rate | 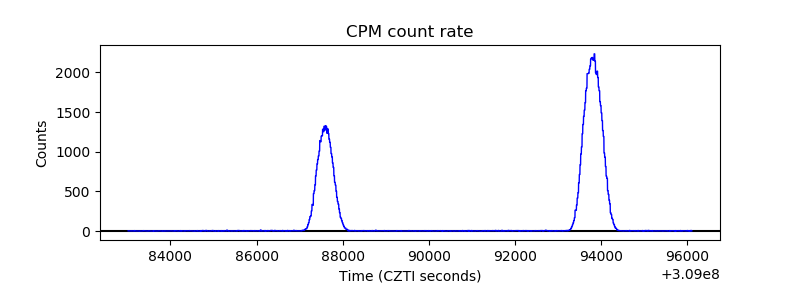 |
| CZT Counter |  |
| +2.5 Volts monitor |  |
| +5 Volts monitor |  |
| _ROLL_ROT | 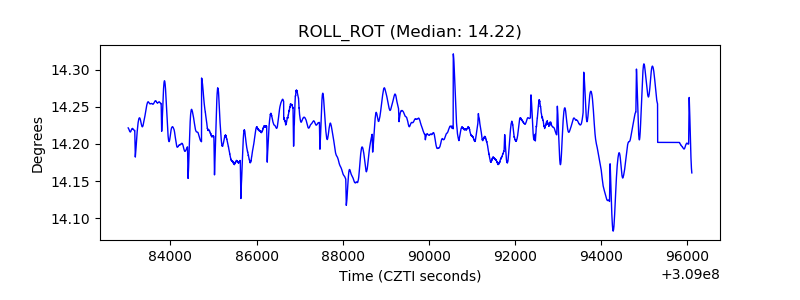 |
| _Roll_DEC | 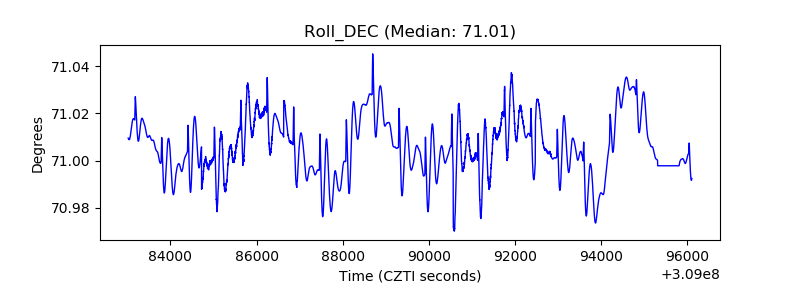 |
| _Roll_RA | 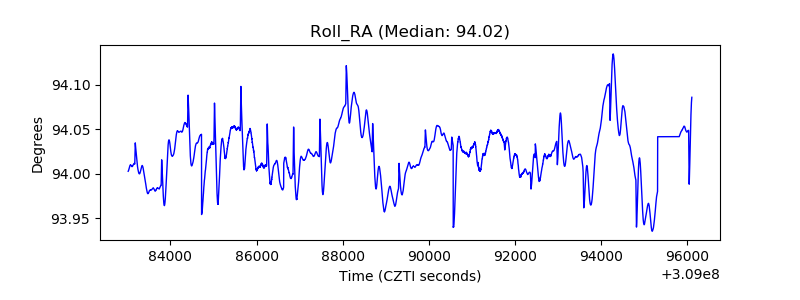 |
| Veto Counter | 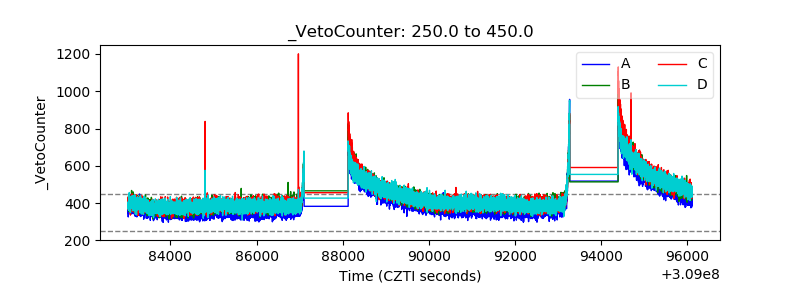 |