| Param | Original file | Final file |
|---|---|---|
| Filename | modeM0/AS1A07_100T03_9000003242_21927cztM0_level2.evt | modeM0/AS1A07_100T03_9000003242_21927cztM0_level2_quad_clean.evt |
| Size (bytes) | 650,612,160 | 110,963,520 |
| Size | 620.5 MB | 105.8 MB |
| Events in quadrant A | 3,004,750 | 805,804 |
| Events in quadrant B | 7,026,986 | 699,635 |
| Events in quadrant C | 3,053,881 | 780,356 |
| Events in quadrant D | 6,217,089 | 659,922 |
| Mode M0 | |||
|---|---|---|---|
| Quadrant | BADHDUFLAG | Total packets | Discarded packets |
| A | 0 | 12740 | 1 |
| B | 0 | 24935 | 3 |
| C | 0 | 12793 | 1 |
| D | 0 | 22485 | 1 |
| Mode SS | |||
|---|---|---|---|
| Quadrant | BADHDUFLAG | Total packets | Discarded packets |
| A | 0 | 122 | 0 |
| B | 0 | 122 | 0 |
| C | 0 | 122 | 0 |
| D | 0 | 122 | 0 |
| Mode M9 | |||
|---|---|---|---|
| Quadrant | BADHDUFLAG | Total packets | Discarded packets |
| A | 0 | 12 | 0 |
| B | 0 | 12 | 0 |
| C | 0 | 12 | 0 |
| D | 0 | 12 | 0 |
| Quadrant | Total seconds | Saturated seconds | Saturation percentage |
|---|---|---|---|
| A | 5920 | 85 | 1.435811% |
| B | 5919 | 1614 | 27.268120% |
| C | 5919 | 102 | 1.723264% |
| D | 5920 | 1150 | 19.425676% |
Noise dominated data is calculated using 1-second bins in cleaned event files. If a bin has >2000 counts, and if more than 50% of those come from <1% of pixels, then it is considered to be noise-dominated and hence unusable.
| Quadrant | # 1 sec bins | Bins with >0 counts | Bins with >2000 counts | High rate bins dominated by noise | Noise dominated (total time) | Noise dominated (detector-on time) | Marked lightcurve |
|---|---|---|---|---|---|---|---|
| A | 7150 | 5920 | 0 | 0 | 0.00% | 0.00% | 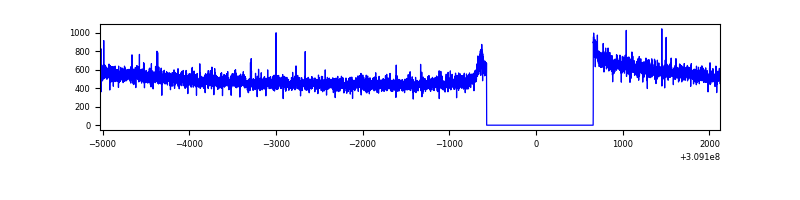 |
| B | 7149 | 5919 | 1372 | 1372 | 19.19% | 23.18% | 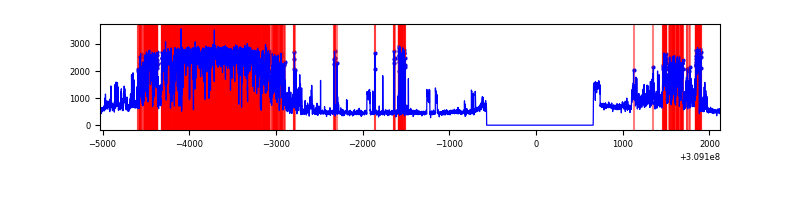 |
| C | 7149 | 5919 | 0 | 0 | 0.00% | 0.00% | 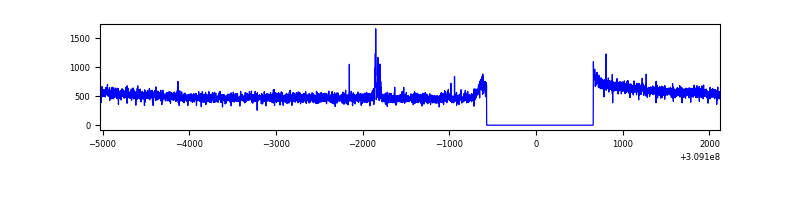 |
| D | 7150 | 5920 | 1065 | 1065 | 14.90% | 17.99% | 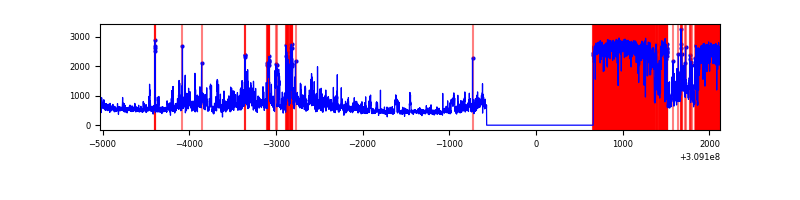 |
Top three noisy pixels from each quadrant. If the there are fewer than three noisy pixels in the level2.evt file, extra rows are filled as -1
| Pixel properties | Quadrant properties | ||||||
|---|---|---|---|---|---|---|---|
| Quadrant | DetID | PixID | Counts | Sigma | Mean | Median | Sigma |
| A | 13 | 254 | 11019 | 66.52 | 775 | 759 | 154.2 |
| A | 3 | 1 | 9995 | 59.88 | 775 | 759 | 154.2 |
| A | 0 | 226 | 6949 | 40.13 | 775 | 759 | 154.2 |
| B | 0 | 85 | 4020495 | 31725.12 | 686 | 670 | 126.7 |
| B | 3 | 64 | 191577 | 1506.67 | 686 | 670 | 126.7 |
| B | 0 | 197 | 59395 | 463.47 | 686 | 670 | 126.7 |
| C | 14 | 238 | 120119 | 698.86 | 744 | 750 | 170.8 |
| C | 10 | 22 | 30858 | 176.27 | 744 | 750 | 170.8 |
| C | 13 | 61 | 5180 | 25.94 | 744 | 750 | 170.8 |
| D | 7 | 238 | 2623683 | 16494.73 | 666 | 647 | 159.0 |
| D | 12 | 235 | 626379 | 3934.86 | 666 | 647 | 159.0 |
| D | 1 | 52 | 373705 | 2345.94 | 666 | 647 | 159.0 |
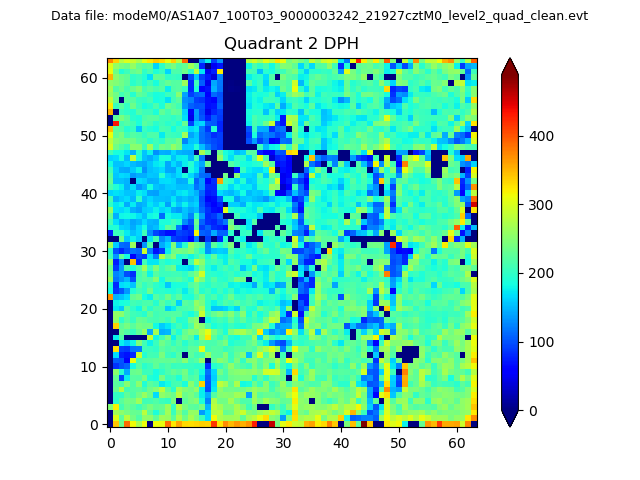
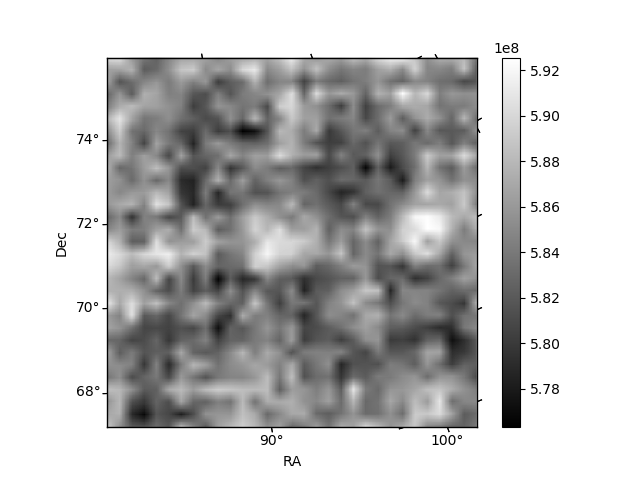
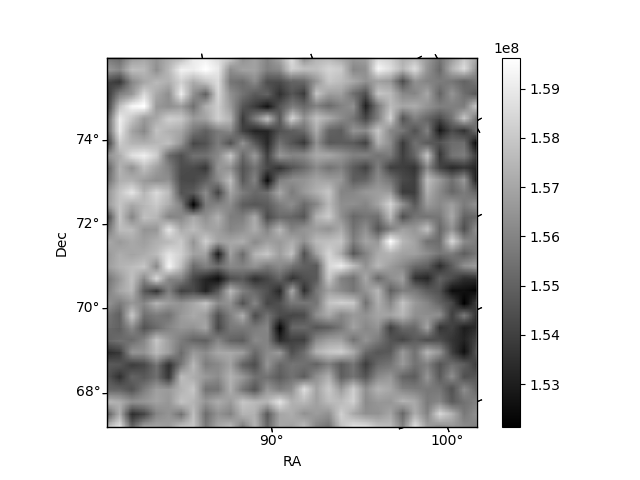
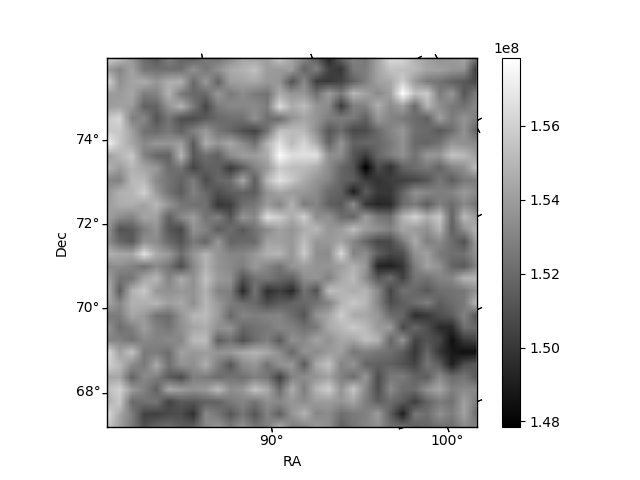
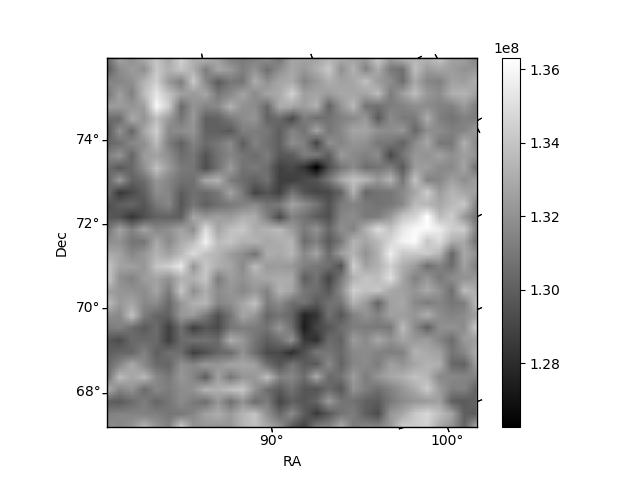
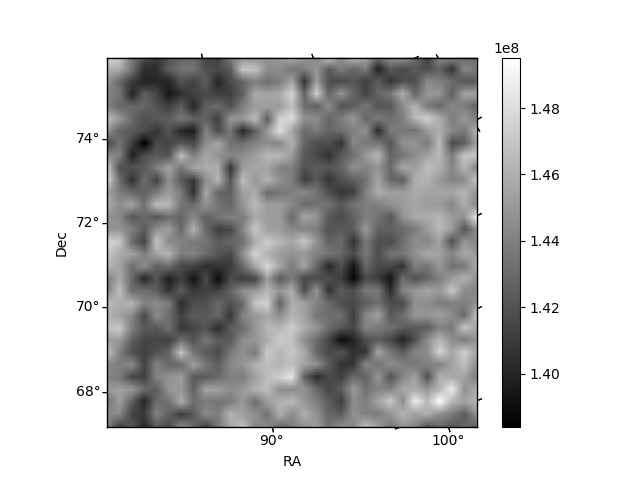
Histogram calculated using DETX and DETY for each event in the final _common_clean file
| Quadrant A | 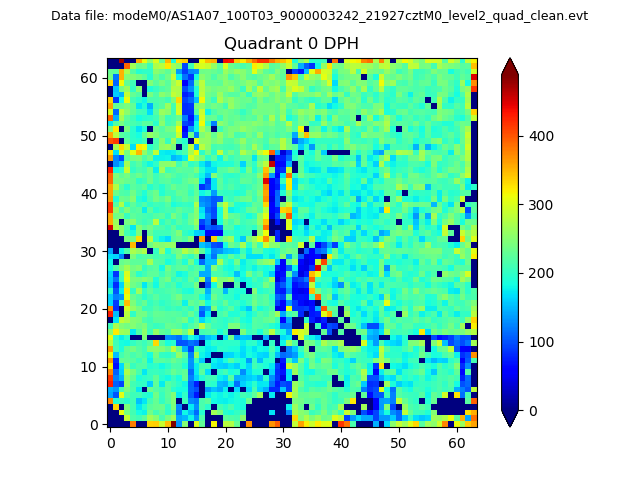 |
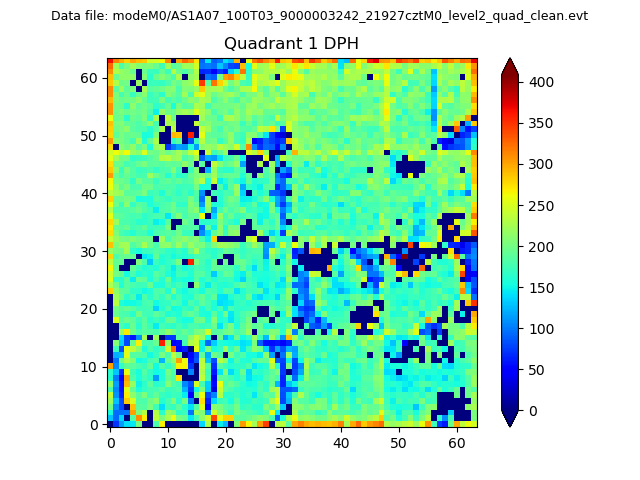 |
Quadrant B |
|---|---|---|---|
| Quadrant D | 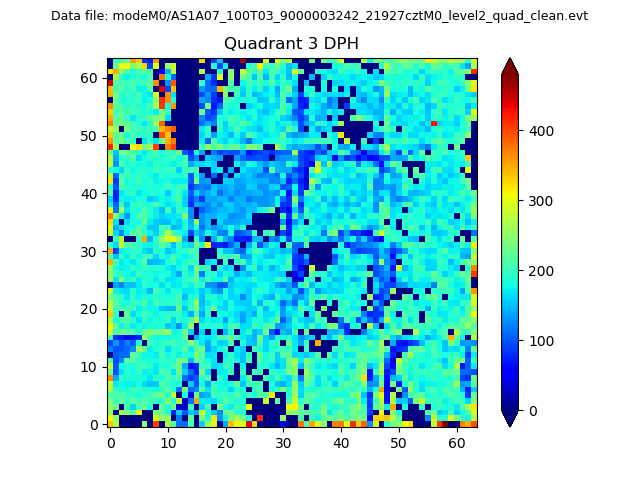 |
 |
Quadrant C |
| Plot type | Count rate plots | Images |
|---|---|---|
| Comparison with Poisson distribution Blue bars denote a histogram of data divided into 1 sec bins. Red curve is a Poisson curve with rate = median count rate of data. |
 |
 |
| Quadrant-wise count rates Data is divided into 100 sec bins |
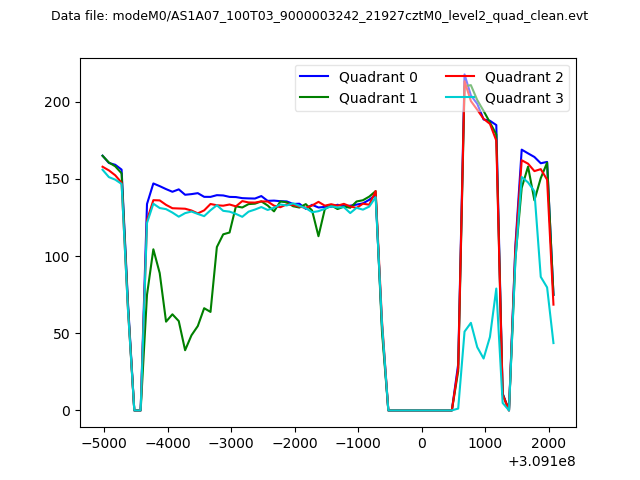 |
|
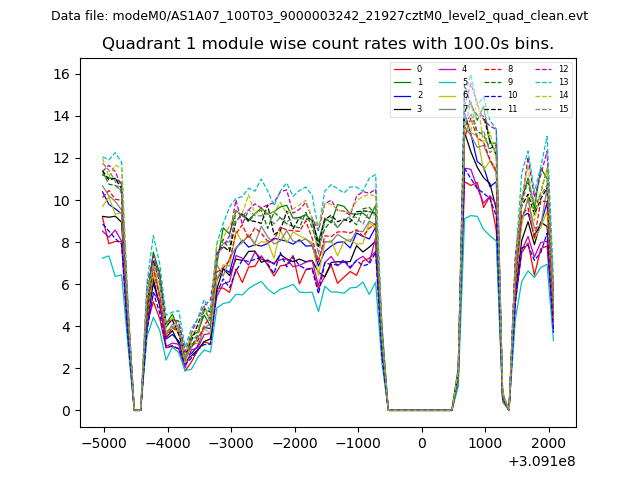
| Module-wise count rates for Quadrant A Data is divided into 100 sec bins |
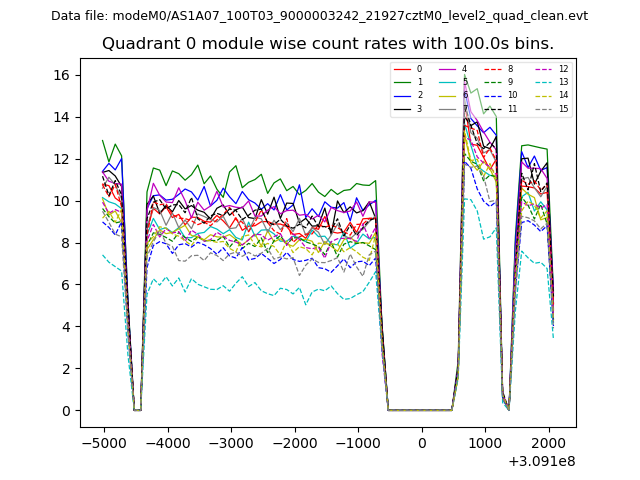 |
 |
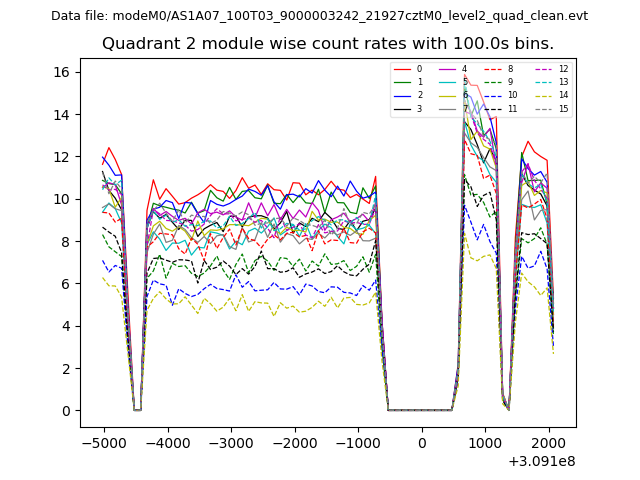
| Module-wise count rates for Quadrant B Data is divided into 100 sec bins |
 |
 |
| Module-wise count rates for Quadrant C Data is divided into 100 sec bins |
 |
 |
| Module-wise count rates for Quadrant D Data is divided into 100 sec bins |
 |
 |
| Parameter | Plot |
|---|---|
| CZT HV Monitor | 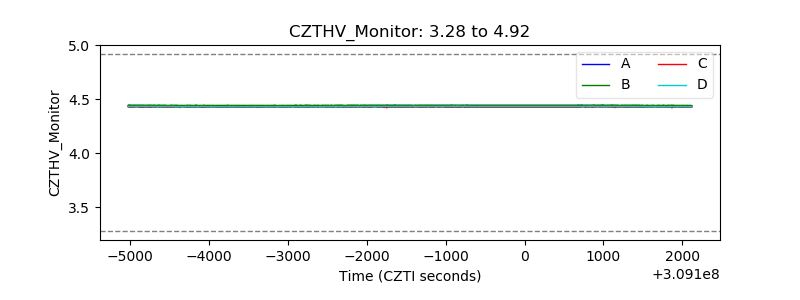 |
| D_VDD | 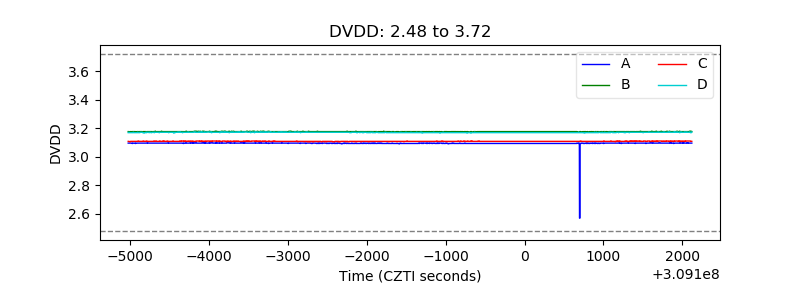 |
| Temperature 1 | 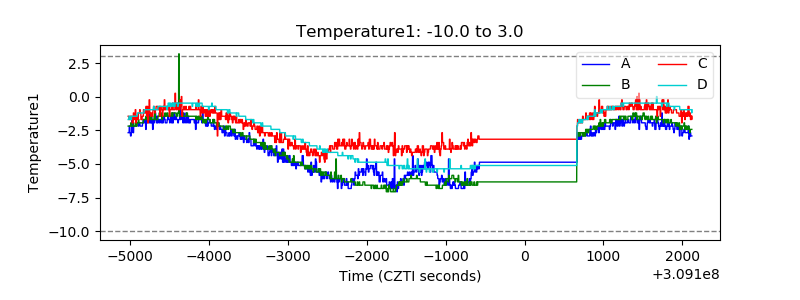 |
| Veto HV Monitor | 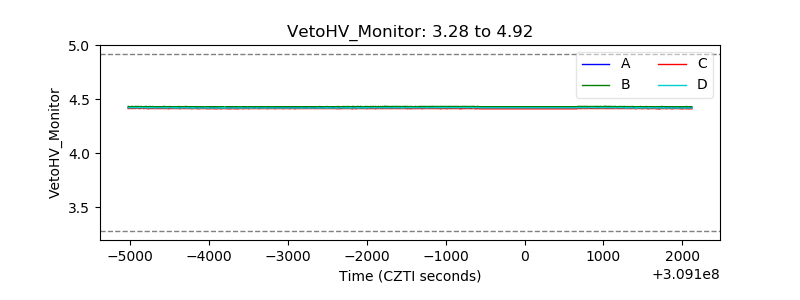 |
| Veto LLD | 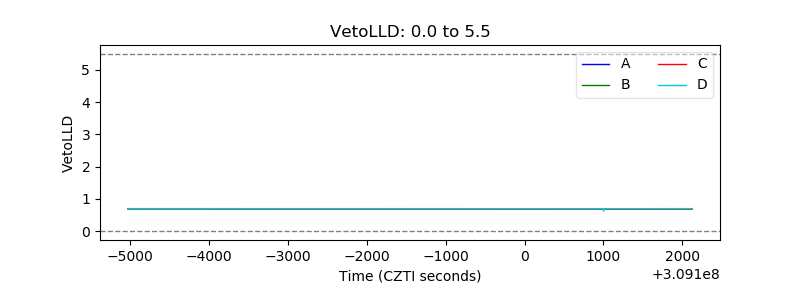 |
| Alpha Counter | 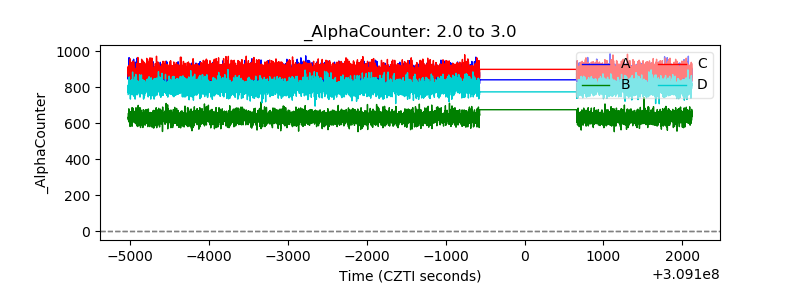 |
| _CPM_Rate | 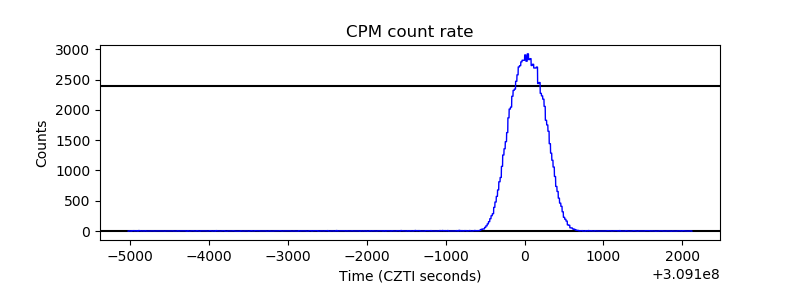 |
| CZT Counter | 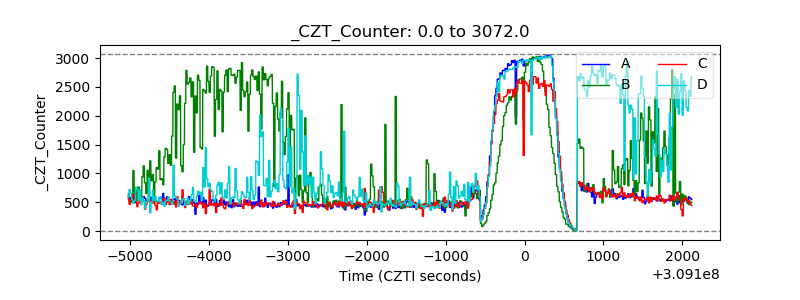 |
| +2.5 Volts monitor |  |
| +5 Volts monitor |  |
| _ROLL_ROT | 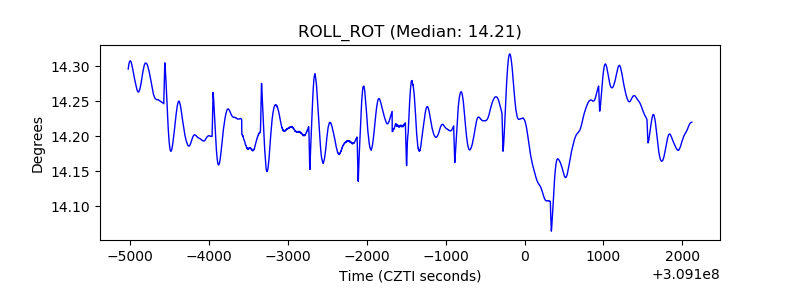 |
| _Roll_DEC | 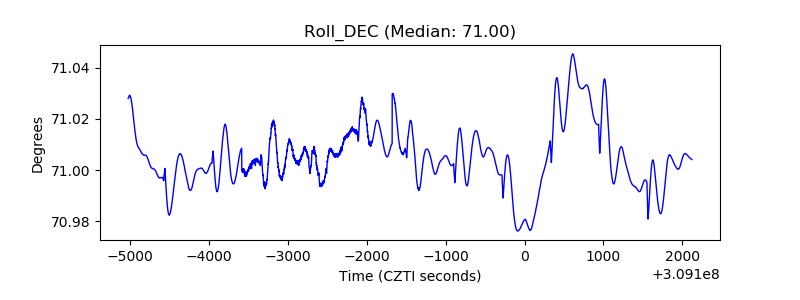 |
| _Roll_RA | 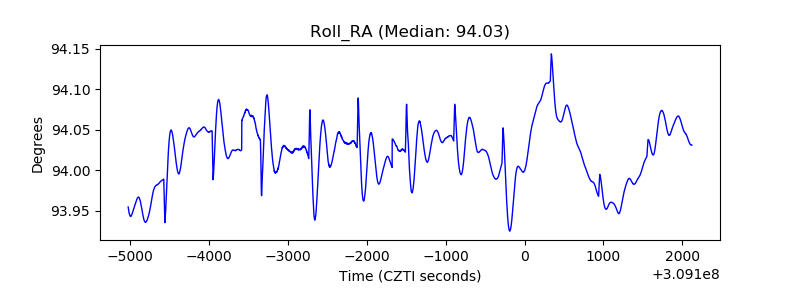 |
| Veto Counter | 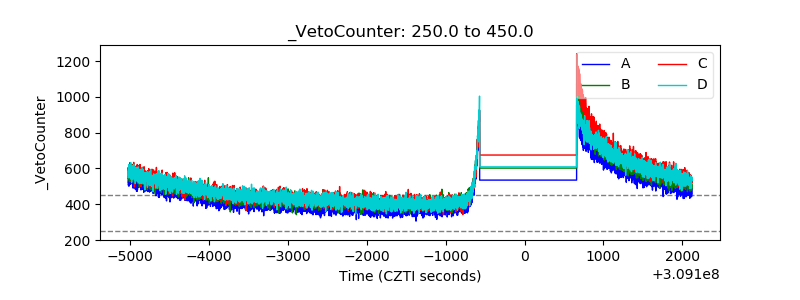 |