| Param | Original file | Final file |
|---|---|---|
| Filename | modeM0/AS1A07_100T03_9000003242_21928cztM0_level2.evt | modeM0/AS1A07_100T03_9000003242_21928cztM0_level2_quad_clean.evt |
| Size (bytes) | 653,774,400 | 126,624,960 |
| Size | 623.5 MB | 120.8 MB |
| Events in quadrant A | 3,240,695 | 898,921 |
| Events in quadrant B | 4,029,674 | 896,468 |
| Events in quadrant C | 3,398,902 | 881,240 |
| Events in quadrant D | 8,714,114 | 728,093 |
| Mode M0 | |||
|---|---|---|---|
| Quadrant | BADHDUFLAG | Total packets | Discarded packets |
| A | 0 | 13700 | 1 |
| B | 0 | 16086 | 1 |
| C | 0 | 14051 | 1 |
| D | 0 | 30257 | 1 |
| Mode SS | |||
|---|---|---|---|
| Quadrant | BADHDUFLAG | Total packets | Discarded packets |
| A | 0 | 122 | 0 |
| B | 0 | 122 | 0 |
| C | 0 | 122 | 0 |
| D | 0 | 122 | 0 |
| Mode M9 | |||
|---|---|---|---|
| Quadrant | BADHDUFLAG | Total packets | Discarded packets |
| A | 0 | 13 | 0 |
| B | 0 | 13 | 0 |
| C | 0 | 13 | 0 |
| D | 0 | 13 | 0 |
| Quadrant | Total seconds | Saturated seconds | Saturation percentage |
|---|---|---|---|
| A | 6159 | 85 | 1.380094% |
| B | 6160 | 289 | 4.691558% |
| C | 6159 | 120 | 1.948368% |
| D | 6159 | 1783 | 28.949505% |
Noise dominated data is calculated using 1-second bins in cleaned event files. If a bin has >2000 counts, and if more than 50% of those come from <1% of pixels, then it is considered to be noise-dominated and hence unusable.
| Quadrant | # 1 sec bins | Bins with >0 counts | Bins with >2000 counts | High rate bins dominated by noise | Noise dominated (total time) | Noise dominated (detector-on time) | Marked lightcurve |
|---|---|---|---|---|---|---|---|
| A | 7474 | 6159 | 0 | 0 | 0.00% | 0.00% | 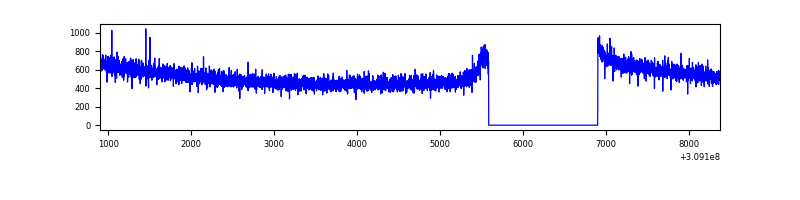 |
| B | 7475 | 6160 | 121 | 121 | 1.62% | 1.96% | 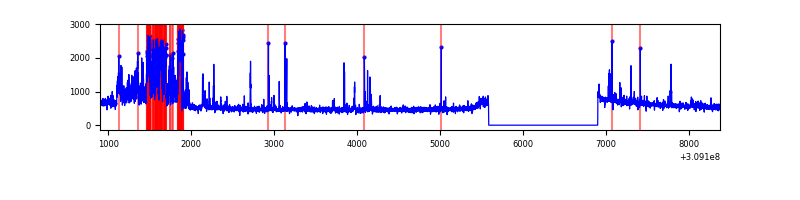 |
| C | 7474 | 6159 | 0 | 0 | 0.00% | 0.00% | 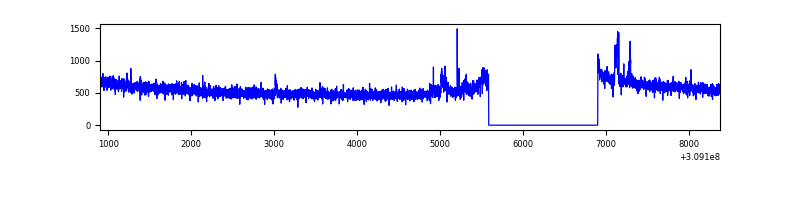 |
| D | 7474 | 6159 | 1699 | 1699 | 22.73% | 27.59% | 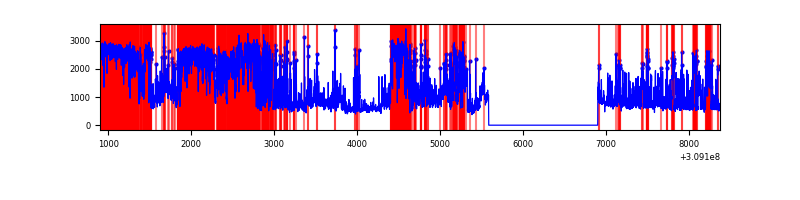 |
Top three noisy pixels from each quadrant. If the there are fewer than three noisy pixels in the level2.evt file, extra rows are filled as -1
| Pixel properties | Quadrant properties | ||||||
|---|---|---|---|---|---|---|---|
| Quadrant | DetID | PixID | Counts | Sigma | Mean | Median | Sigma |
| A | 13 | 254 | 10611 | 59.08 | 838 | 824 | 165.7 |
| A | 0 | 226 | 7378 | 39.56 | 838 | 824 | 165.7 |
| A | 3 | 137 | 6284 | 32.96 | 838 | 824 | 165.7 |
| B | 0 | 85 | 569145 | 3765.94 | 823 | 803 | 150.9 |
| B | 3 | 64 | 105762 | 695.48 | 823 | 803 | 150.9 |
| B | 0 | 197 | 71758 | 470.16 | 823 | 803 | 150.9 |
| C | 14 | 238 | 133221 | 716.61 | 815 | 821 | 184.8 |
| C | 10 | 22 | 89163 | 478.15 | 815 | 821 | 184.8 |
| C | 13 | 61 | 5792 | 26.91 | 815 | 821 | 184.8 |
| D | 7 | 238 | 4338749 | 25058.85 | 726 | 707 | 173.1 |
| D | 12 | 235 | 740662 | 4274.38 | 726 | 707 | 173.1 |
| D | 1 | 52 | 661803 | 3818.84 | 726 | 707 | 173.1 |
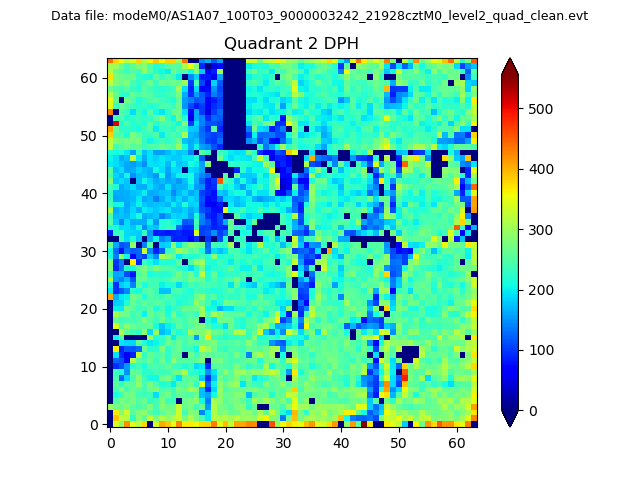
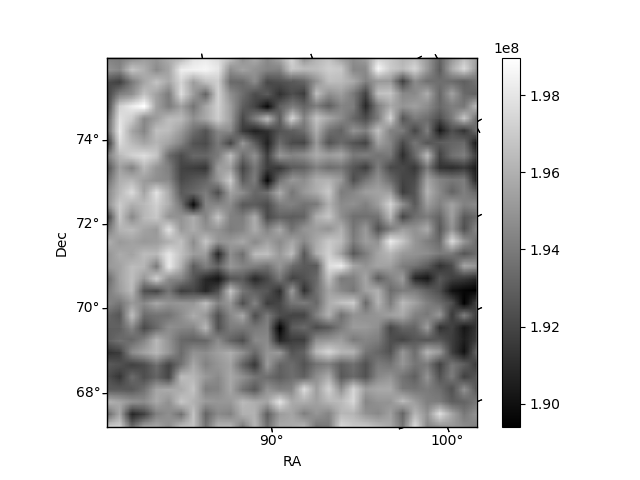
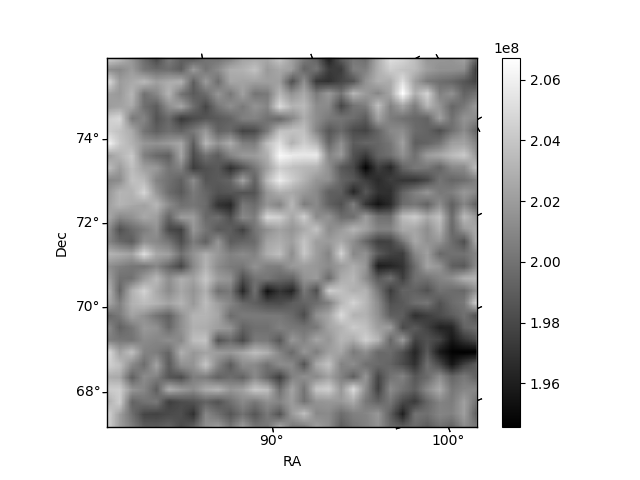
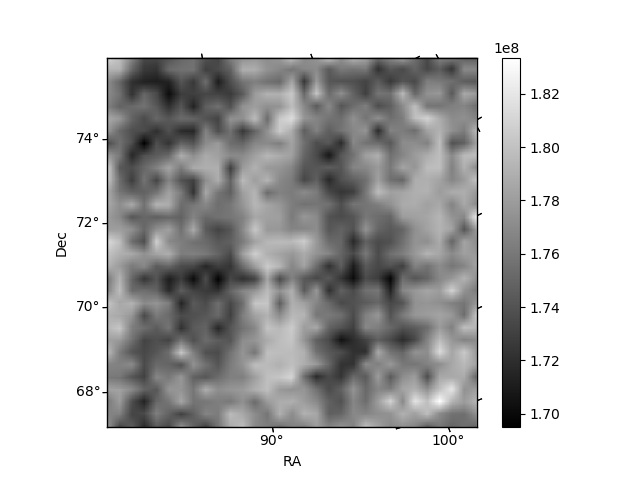
Histogram calculated using DETX and DETY for each event in the final _common_clean file
| Quadrant A |  |
 |
Quadrant B |
|---|---|---|---|
| Quadrant D | 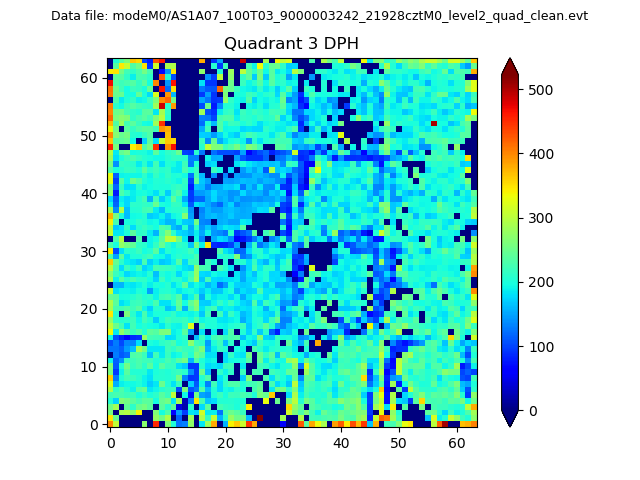 |
 |
Quadrant C |
| Plot type | Count rate plots | Images |
|---|---|---|
| Comparison with Poisson distribution Blue bars denote a histogram of data divided into 1 sec bins. Red curve is a Poisson curve with rate = median count rate of data. |
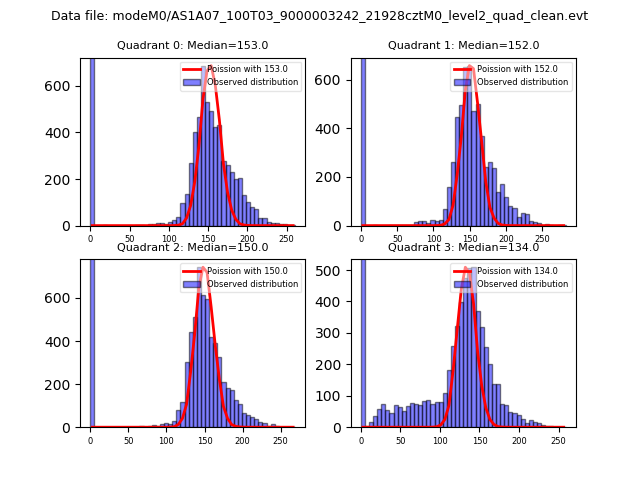 |
 |
| Quadrant-wise count rates Data is divided into 100 sec bins |
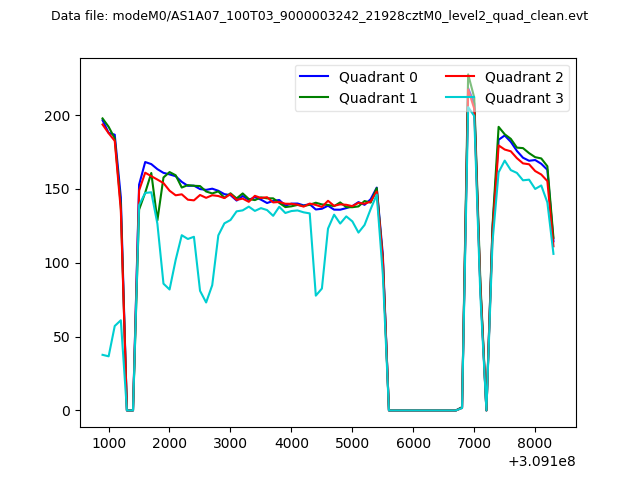 |
|
| Module-wise count rates for Quadrant A Data is divided into 100 sec bins |
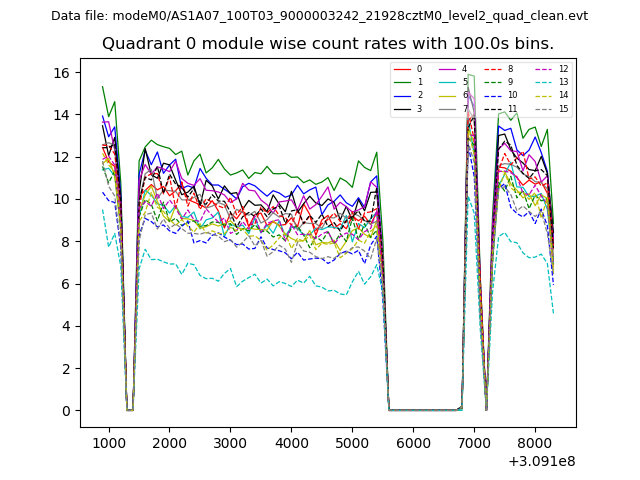 |
 |
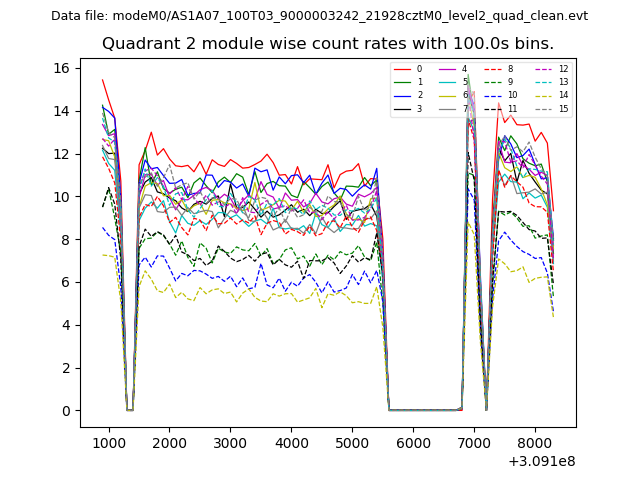
| Module-wise count rates for Quadrant B Data is divided into 100 sec bins |
 |
 |
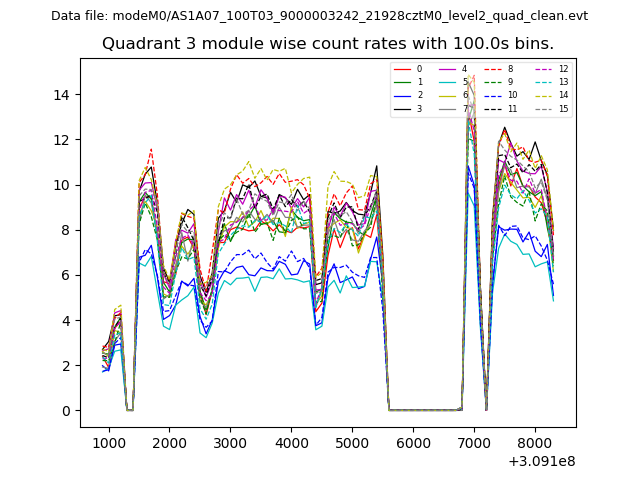
| Module-wise count rates for Quadrant C Data is divided into 100 sec bins |
 |
 |
| Module-wise count rates for Quadrant D Data is divided into 100 sec bins |
 |
 |
| Parameter | Plot |
|---|---|
| CZT HV Monitor | 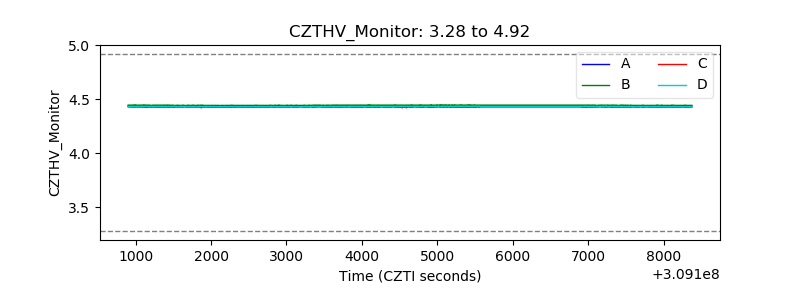 |
| D_VDD | 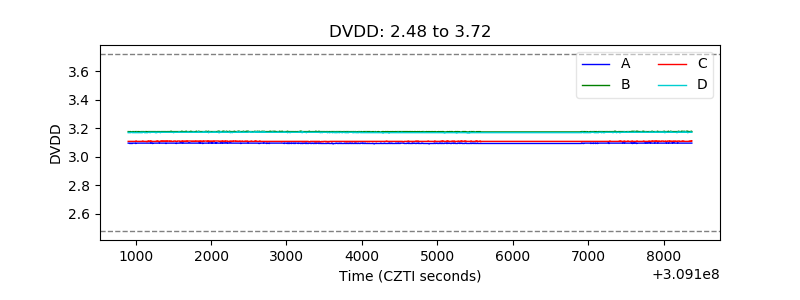 |
| Temperature 1 | 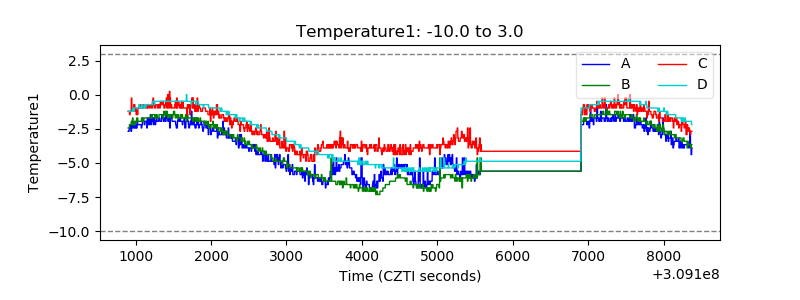 |
| Veto HV Monitor | 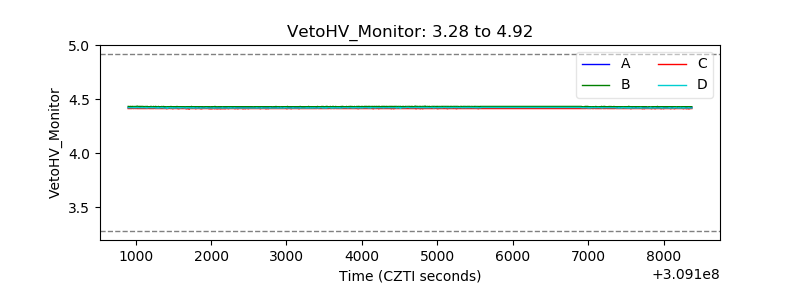 |
| Veto LLD | 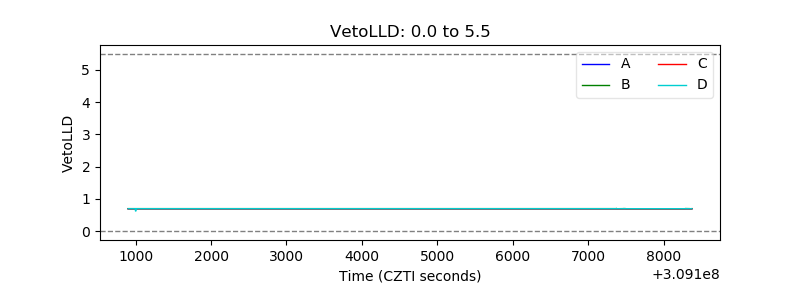 |
| Alpha Counter | 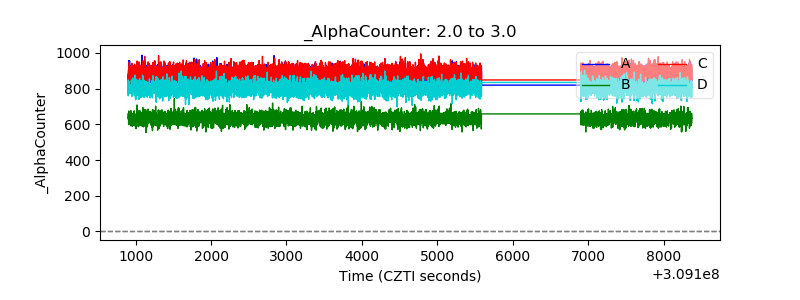 |
| _CPM_Rate | 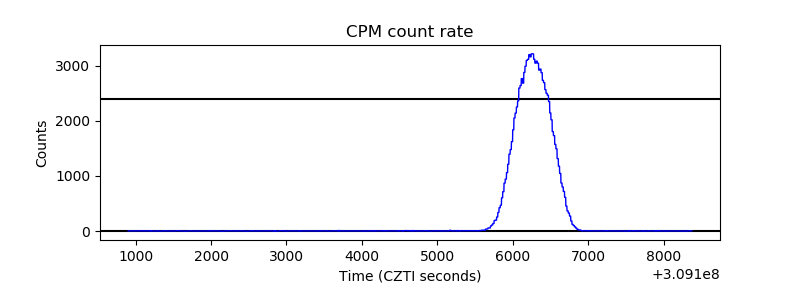 |
| CZT Counter | 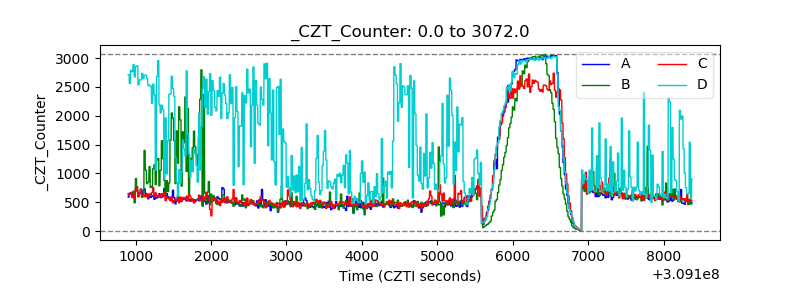 |
| +2.5 Volts monitor |  |
| +5 Volts monitor | 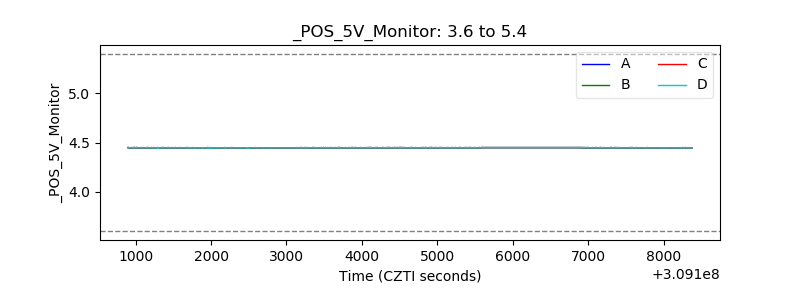 |
| _ROLL_ROT | 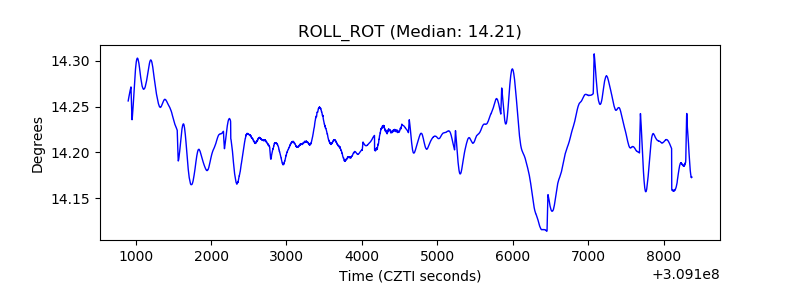 |
| _Roll_DEC | 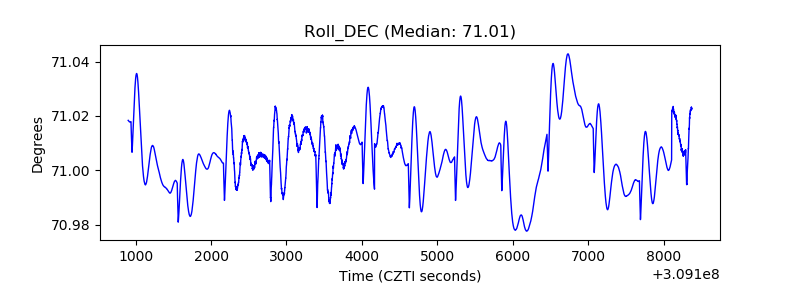 |
| _Roll_RA | 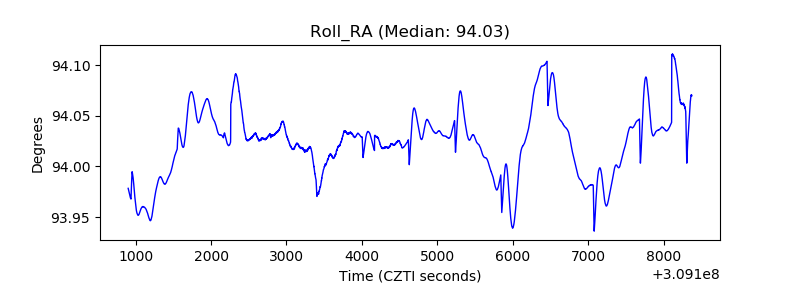 |
| Veto Counter | 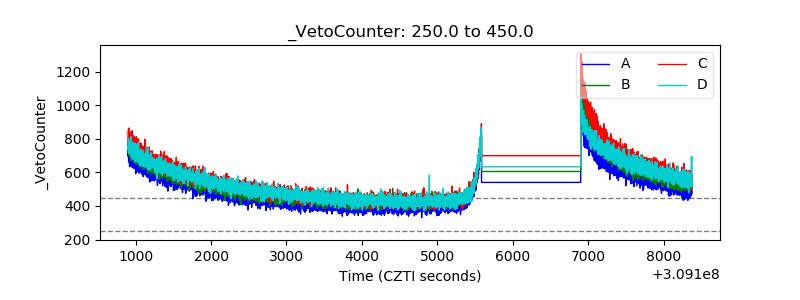 |