| Param | Original file | Final file |
|---|---|---|
| Filename | modeM0/AS1A07_100T03_9000003242_21929cztM0_level2.evt | modeM0/AS1A07_100T03_9000003242_21929cztM0_level2_quad_clean.evt |
| Size (bytes) | 486,789,120 | 124,922,880 |
| Size | 464.2 MB | 119.1 MB |
| Events in quadrant A | 4,033,289 | 851,106 |
| Events in quadrant B | 2,966,286 | 877,632 |
| Events in quadrant C | 3,049,617 | 859,488 |
| Events in quadrant D | 4,316,923 | 806,966 |
| Mode M0 | |||
|---|---|---|---|
| Quadrant | BADHDUFLAG | Total packets | Discarded packets |
| A | 0 | 15669 | 1 |
| B | 0 | 12375 | 1 |
| C | 0 | 12572 | 1 |
| D | 0 | 16646 | 1 |
| Mode SS | |||
|---|---|---|---|
| Quadrant | BADHDUFLAG | Total packets | Discarded packets |
| A | 0 | 114 | 0 |
| B | 0 | 114 | 0 |
| C | 0 | 114 | 0 |
| D | 0 | 114 | 0 |
| Mode M9 | |||
|---|---|---|---|
| Quadrant | BADHDUFLAG | Total packets | Discarded packets |
| A | 0 | 13 | 0 |
| B | 0 | 13 | 0 |
| C | 0 | 13 | 0 |
| D | 0 | 13 | 0 |
| Quadrant | Total seconds | Saturated seconds | Saturation percentage |
|---|---|---|---|
| A | 5546 | 216 | 3.894699% |
| B | 5545 | 115 | 2.073940% |
| C | 5545 | 151 | 2.723174% |
| D | 5545 | 407 | 7.339946% |
Noise dominated data is calculated using 1-second bins in cleaned event files. If a bin has >2000 counts, and if more than 50% of those come from <1% of pixels, then it is considered to be noise-dominated and hence unusable.
| Quadrant | # 1 sec bins | Bins with >0 counts | Bins with >2000 counts | High rate bins dominated by noise | Noise dominated (total time) | Noise dominated (detector-on time) | Marked lightcurve |
|---|---|---|---|---|---|---|---|
| A | 6896 | 5546 | 83 | 83 | 1.20% | 1.50% | 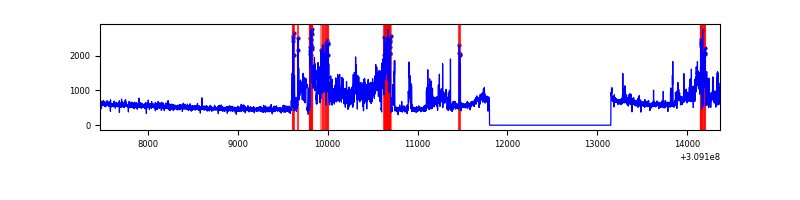 |
| B | 6895 | 5545 | 6 | 6 | 0.09% | 0.11% | 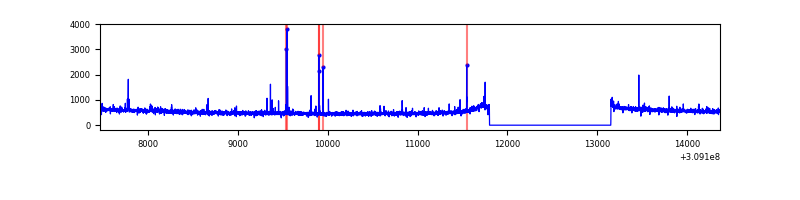 |
| C | 6895 | 5545 | 13 | 13 | 0.19% | 0.23% | 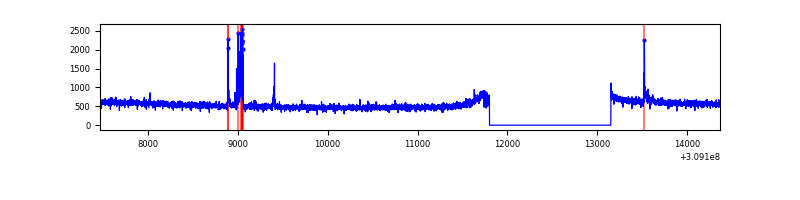 |
| D | 6895 | 5545 | 283 | 283 | 4.10% | 5.10% | 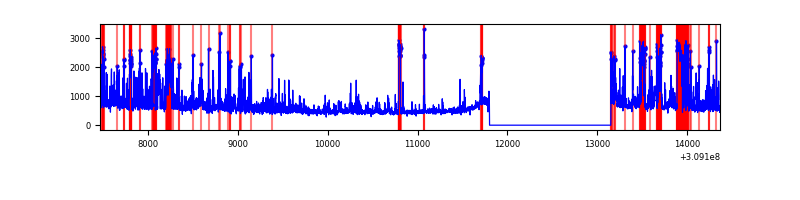 |
Top three noisy pixels from each quadrant. If the there are fewer than three noisy pixels in the level2.evt file, extra rows are filled as -1
| Pixel properties | Quadrant properties | ||||||
|---|---|---|---|---|---|---|---|
| Quadrant | DetID | PixID | Counts | Sigma | Mean | Median | Sigma |
| A | 15 | 236 | 1195349 | 8190.15 | 735 | 721 | 145.9 |
| A | 13 | 254 | 9920 | 63.07 | 735 | 721 | 145.9 |
| A | 0 | 226 | 6608 | 40.36 | 735 | 721 | 145.9 |
| B | 3 | 64 | 49513 | 361.15 | 737 | 719 | 135.1 |
| B | 0 | 190 | 19621 | 139.9 | 737 | 719 | 135.1 |
| B | 12 | 111 | 14876 | 104.78 | 737 | 719 | 135.1 |
| C | 14 | 238 | 115901 | 691.38 | 728 | 733 | 166.6 |
| C | 10 | 22 | 95274 | 567.55 | 728 | 733 | 166.6 |
| C | 13 | 61 | 5150 | 26.52 | 728 | 733 | 166.6 |
| D | 1 | 52 | 715149 | 4163.77 | 716 | 697 | 171.6 |
| D | 12 | 235 | 667031 | 3883.34 | 716 | 697 | 171.6 |
| D | 11 | 176 | 112428 | 651.16 | 716 | 697 | 171.6 |
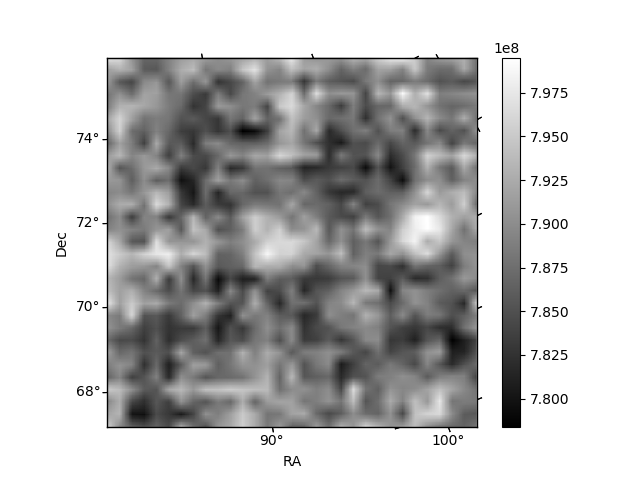
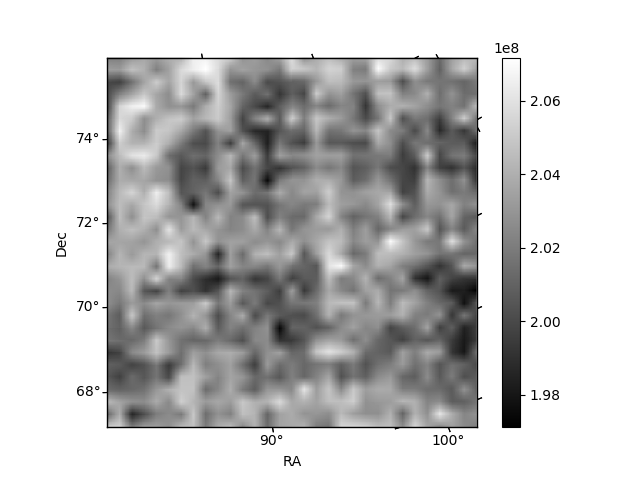
Histogram calculated using DETX and DETY for each event in the final _common_clean file
| Quadrant A | 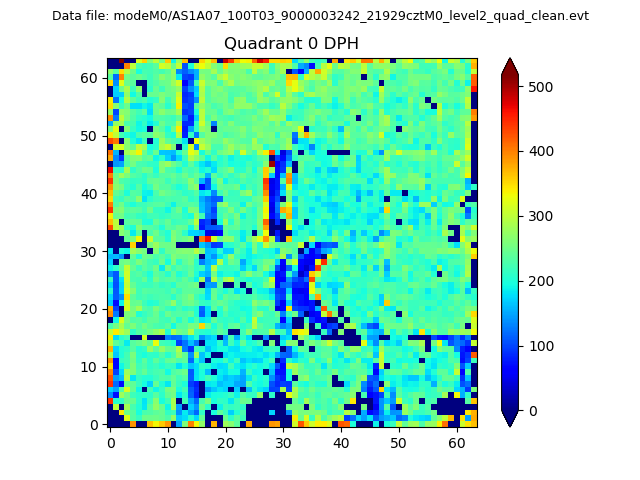 |
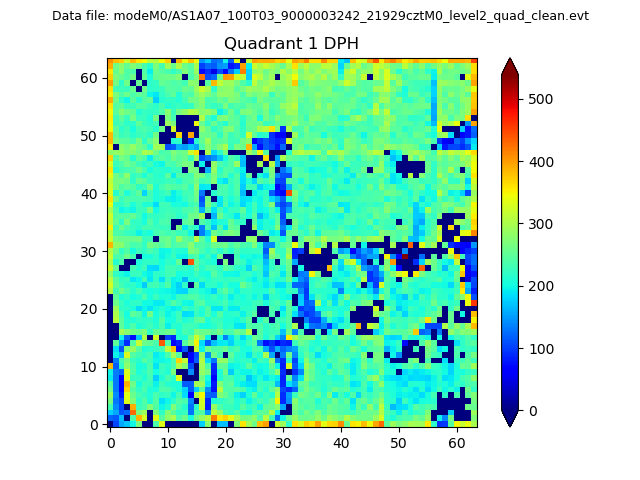 |
Quadrant B |
|---|---|---|---|
| Quadrant D | 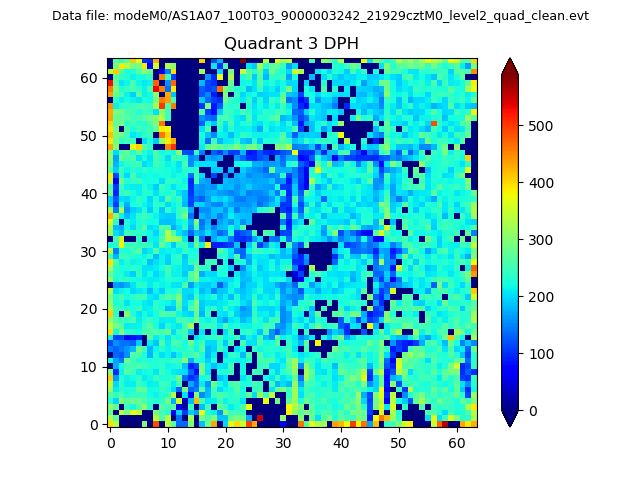 |
 |
Quadrant C |
| Plot type | Count rate plots | Images |
|---|---|---|
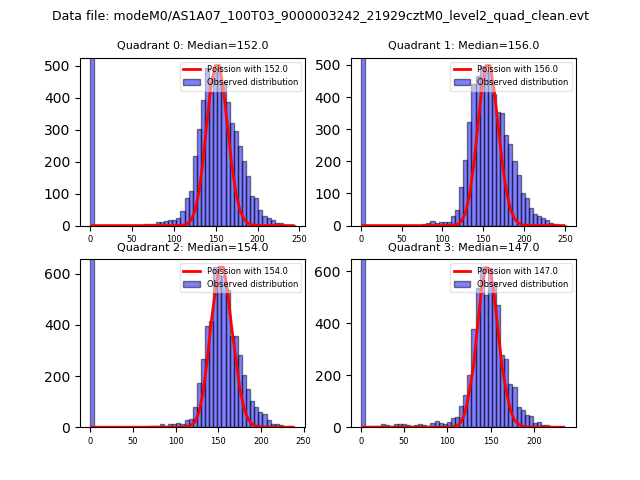
| Comparison with Poisson distribution Blue bars denote a histogram of data divided into 1 sec bins. Red curve is a Poisson curve with rate = median count rate of data. |
 |
 |
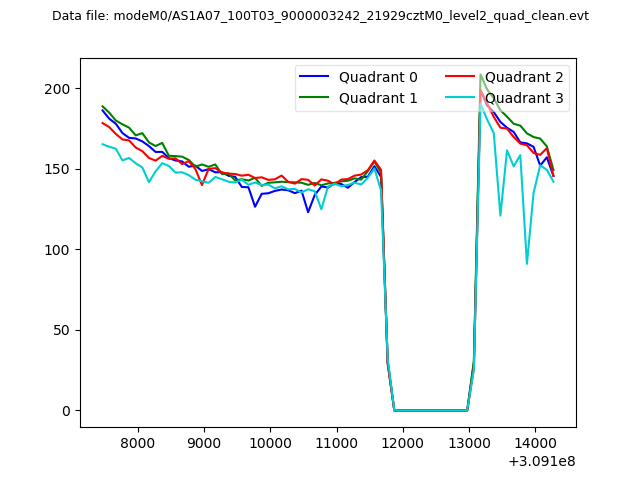
| Quadrant-wise count rates Data is divided into 100 sec bins |
 |
|
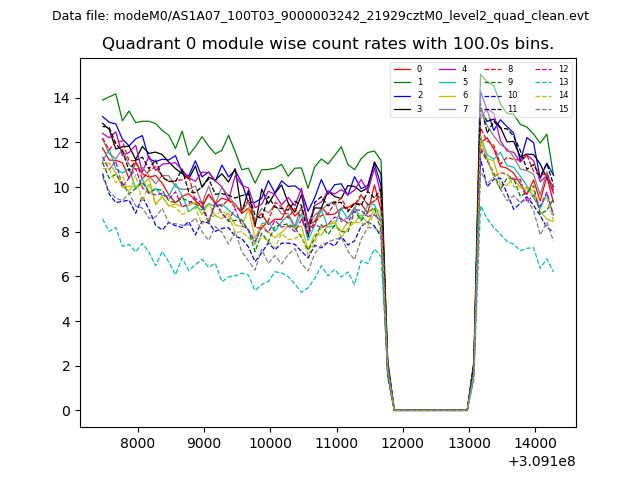
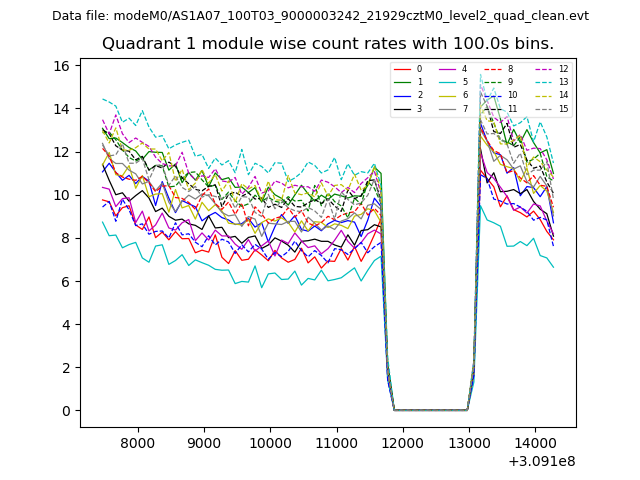
| Module-wise count rates for Quadrant A Data is divided into 100 sec bins |
 |
 |
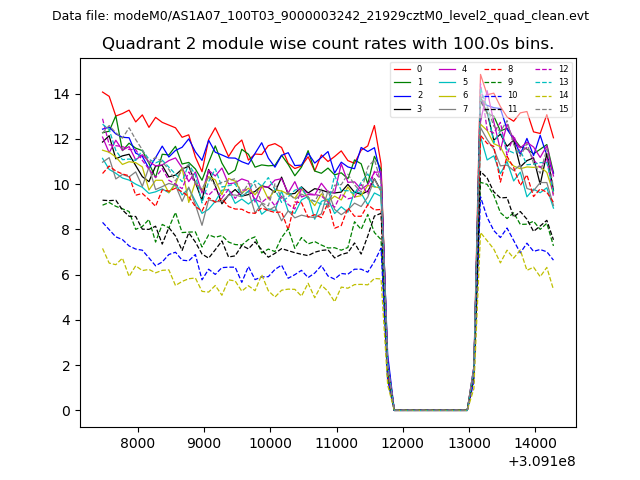
| Module-wise count rates for Quadrant B Data is divided into 100 sec bins |
 |
 |
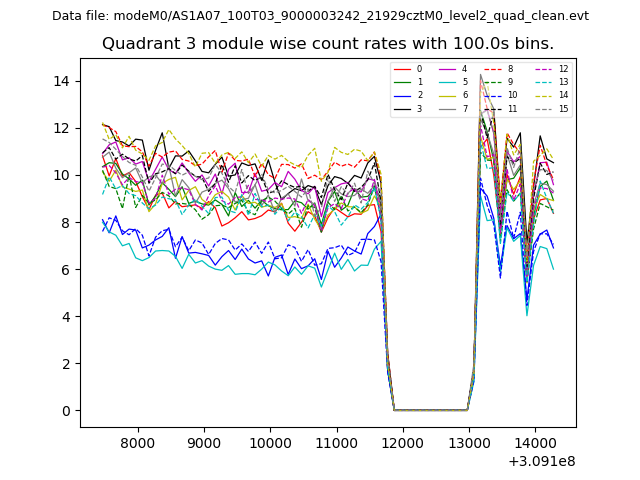
| Module-wise count rates for Quadrant C Data is divided into 100 sec bins |
 |
 |
| Module-wise count rates for Quadrant D Data is divided into 100 sec bins |
 |
 |
| Parameter | Plot |
|---|---|
| CZT HV Monitor | 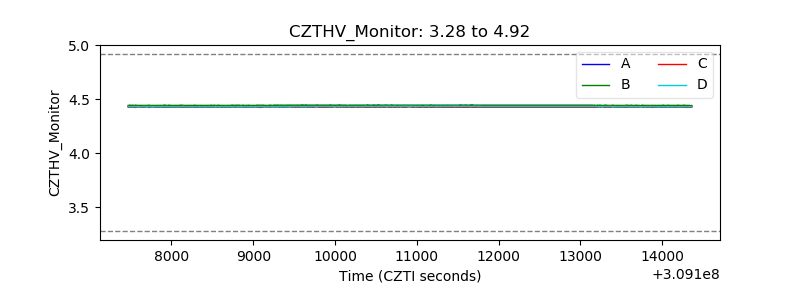 |
| D_VDD | 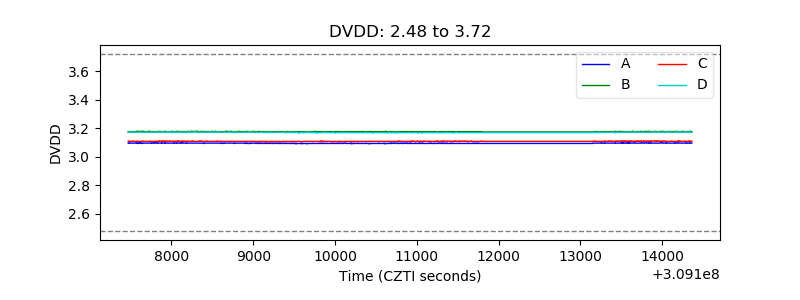 |
| Temperature 1 | 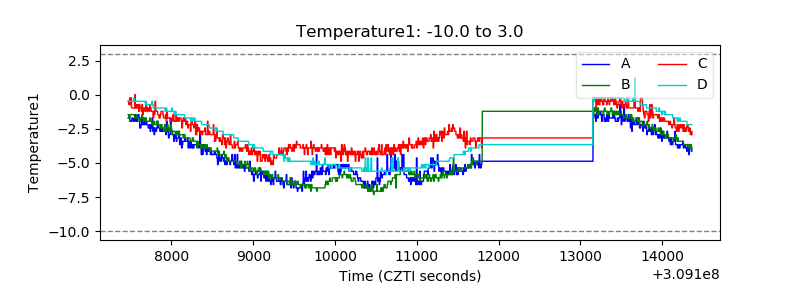 |
| Veto HV Monitor | 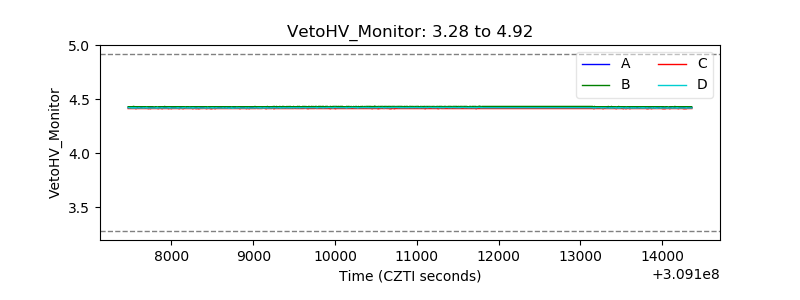 |
| Veto LLD | 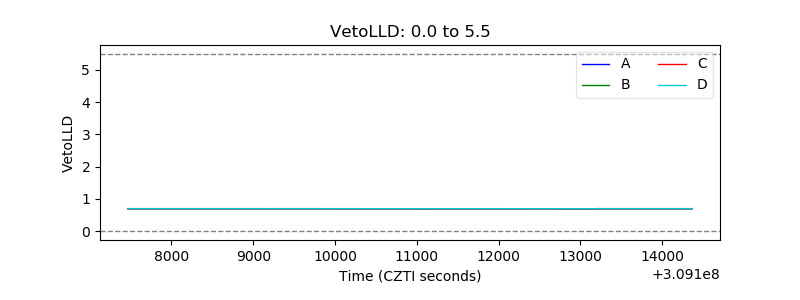 |
| Alpha Counter | 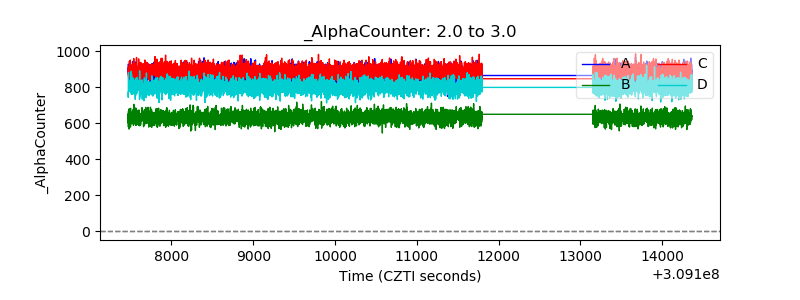 |
| _CPM_Rate | 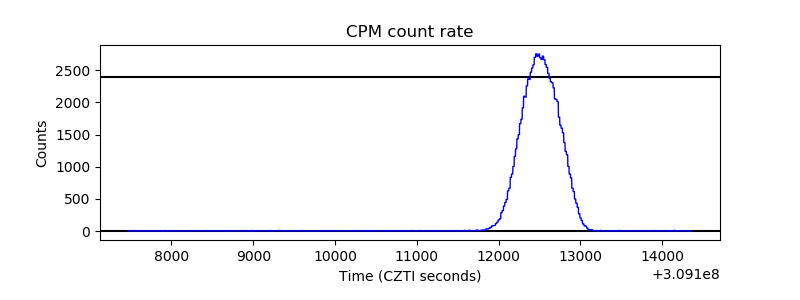 |
| CZT Counter |  |
| +2.5 Volts monitor |  |
| +5 Volts monitor |  |
| _ROLL_ROT | 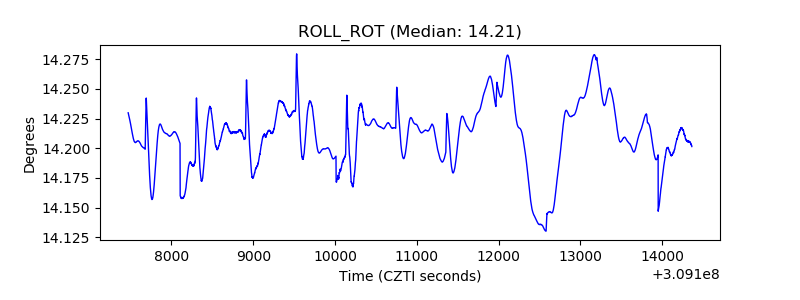 |
| _Roll_DEC | 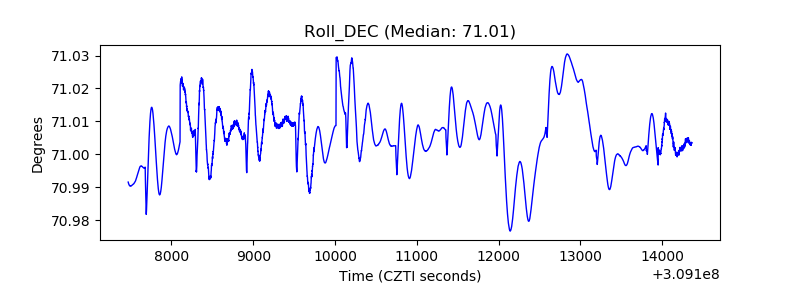 |
| _Roll_RA | 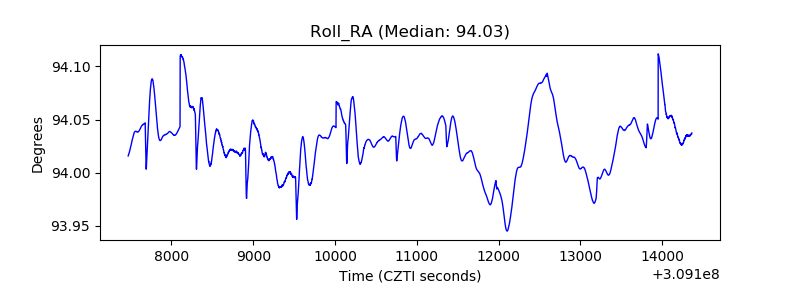 |
| Veto Counter | 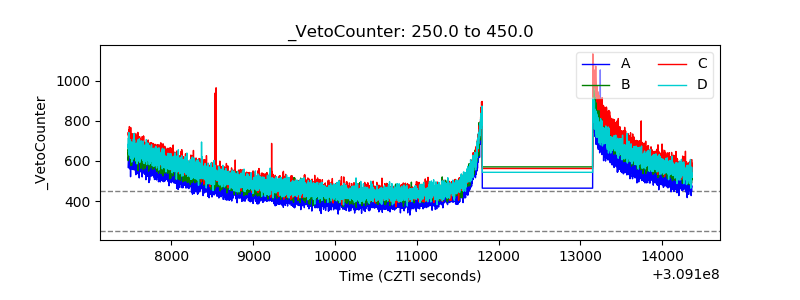 |