| Param | Original file | Final file |
|---|---|---|
| Filename | modeM0/AS1A07_100T03_9000003242_21931cztM0_level2.evt | modeM0/AS1A07_100T03_9000003242_21931cztM0_level2_quad_clean.evt |
| Size (bytes) | 617,232,960 | 133,381,440 |
| Size | 588.6 MB | 127.2 MB |
| Events in quadrant A | 7,397,135 | 850,841 |
| Events in quadrant B | 3,353,843 | 937,033 |
| Events in quadrant C | 3,255,577 | 920,644 |
| Events in quadrant D | 4,240,896 | 871,859 |
| Mode M0 | |||
|---|---|---|---|
| Quadrant | BADHDUFLAG | Total packets | Discarded packets |
| A | 0 | 26537 | 1 |
| B | 0 | 14166 | 1 |
| C | 0 | 13817 | 1 |
| D | 0 | 17157 | 1 |
| Mode SS | |||
|---|---|---|---|
| Quadrant | BADHDUFLAG | Total packets | Discarded packets |
| A | 0 | 132 | 0 |
| B | 0 | 132 | 0 |
| C | 0 | 132 | 0 |
| D | 0 | 132 | 0 |
| Mode M9 | |||
|---|---|---|---|
| Quadrant | BADHDUFLAG | Total packets | Discarded packets |
| A | 0 | 17 | 0 |
| B | 0 | 18 | 0 |
| C | 0 | 18 | 0 |
| D | 0 | 18 | 0 |
| Quadrant | Total seconds | Saturated seconds | Saturation percentage |
|---|---|---|---|
| A | 6587 | 1128 | 17.124639% |
| B | 6586 | 98 | 1.488005% |
| C | 6586 | 111 | 1.685393% |
| D | 6586 | 330 | 5.010629% |
Noise dominated data is calculated using 1-second bins in cleaned event files. If a bin has >2000 counts, and if more than 50% of those come from <1% of pixels, then it is considered to be noise-dominated and hence unusable.
| Quadrant | # 1 sec bins | Bins with >0 counts | Bins with >2000 counts | High rate bins dominated by noise | Noise dominated (total time) | Noise dominated (detector-on time) | Marked lightcurve |
|---|---|---|---|---|---|---|---|
| A | 7642 | 6587 | 721 | 721 | 9.43% | 10.95% | 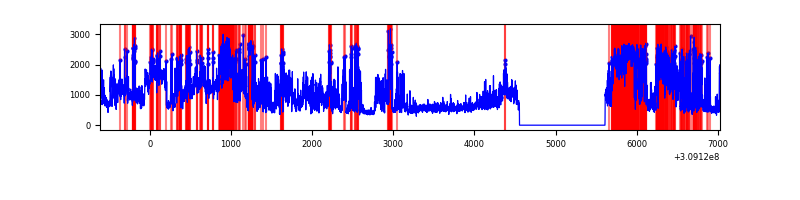 |
| B | 7641 | 6586 | 11 | 11 | 0.14% | 0.17% | 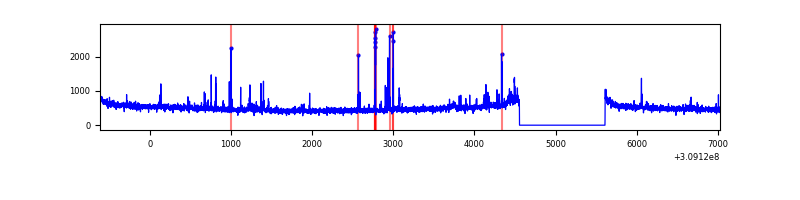 |
| C | 7641 | 6586 | 0 | 0 | 0.00% | 0.00% | 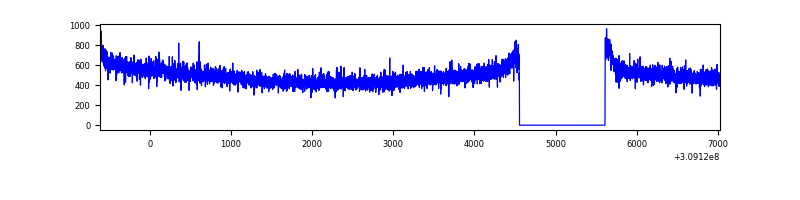 |
| D | 7641 | 6586 | 222 | 222 | 2.91% | 3.37% | 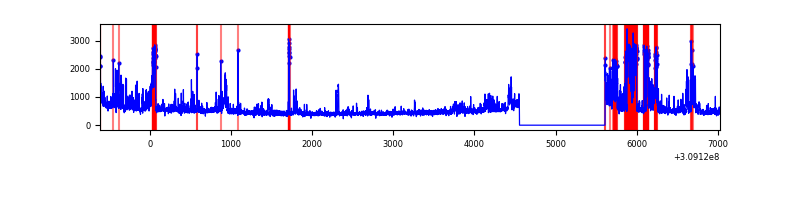 |
Top three noisy pixels from each quadrant. If the there are fewer than three noisy pixels in the level2.evt file, extra rows are filled as -1
| Pixel properties | Quadrant properties | ||||||
|---|---|---|---|---|---|---|---|
| Quadrant | DetID | PixID | Counts | Sigma | Mean | Median | Sigma |
| A | 15 | 236 | 4309227 | 28181.67 | 770 | 756 | 152.9 |
| A | 5 | 16 | 67799 | 438.53 | 770 | 756 | 152.9 |
| A | 4 | 2 | 28584 | 182.02 | 770 | 756 | 152.9 |
| B | 3 | 64 | 70966 | 462.74 | 818 | 797 | 151.6 |
| B | 0 | 230 | 22785 | 145.0 | 818 | 797 | 151.6 |
| B | 0 | 197 | 19924 | 126.13 | 818 | 797 | 151.6 |
| C | 14 | 238 | 126086 | 685.22 | 800 | 805 | 182.8 |
| C | 4 | 175 | 6370 | 30.44 | 800 | 805 | 182.8 |
| C | 13 | 61 | 5337 | 24.79 | 800 | 805 | 182.8 |
| D | 1 | 52 | 583069 | 3089.15 | 790 | 768 | 188.5 |
| D | 12 | 235 | 342873 | 1814.89 | 790 | 768 | 188.5 |
| D | 11 | 176 | 134509 | 709.51 | 790 | 768 | 188.5 |
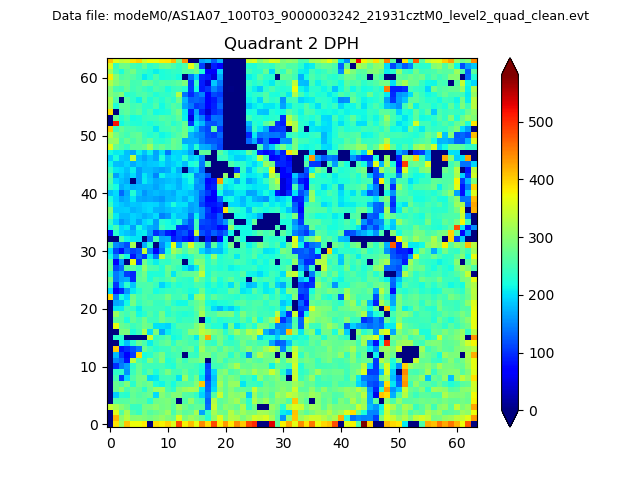
Histogram calculated using DETX and DETY for each event in the final _common_clean file
| Quadrant A | 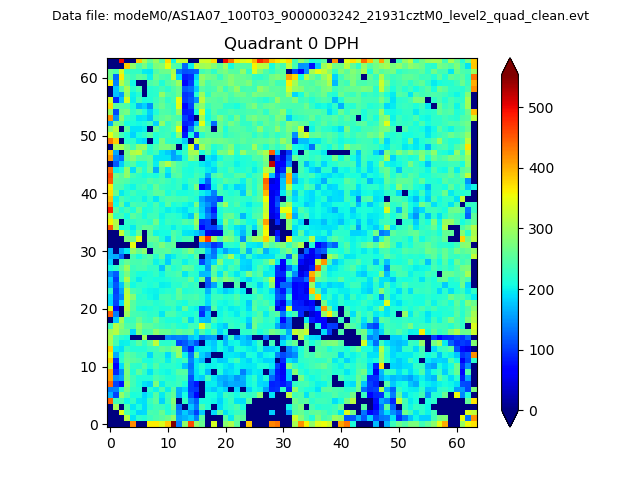 |
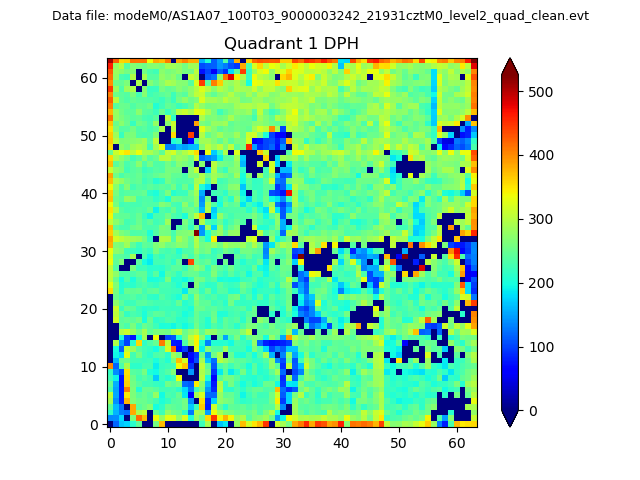 |
Quadrant B |
|---|---|---|---|
| Quadrant D | 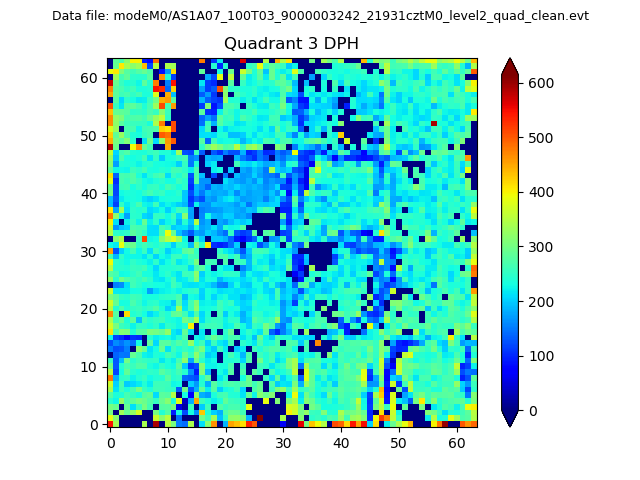 |
 |
Quadrant C |
| Plot type | Count rate plots | Images |
|---|---|---|
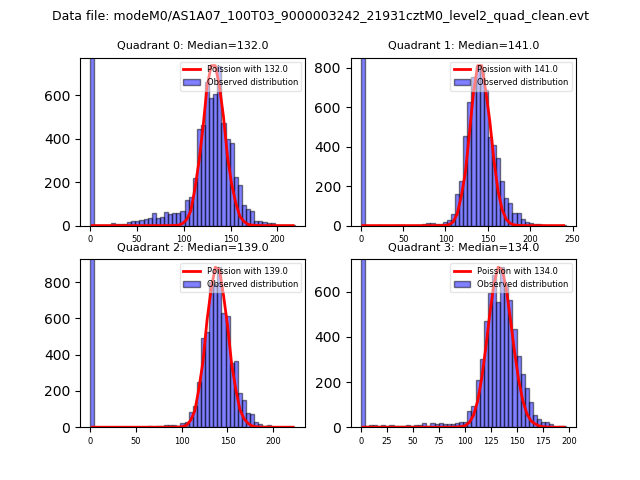
| Comparison with Poisson distribution Blue bars denote a histogram of data divided into 1 sec bins. Red curve is a Poisson curve with rate = median count rate of data. |
 |
 |
| Quadrant-wise count rates Data is divided into 100 sec bins |
 |
|
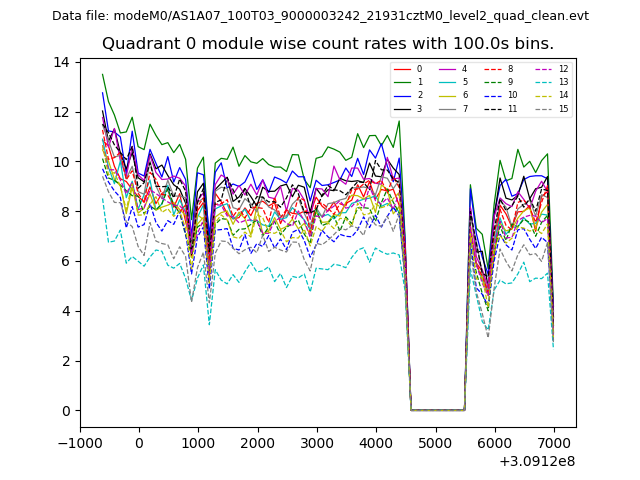
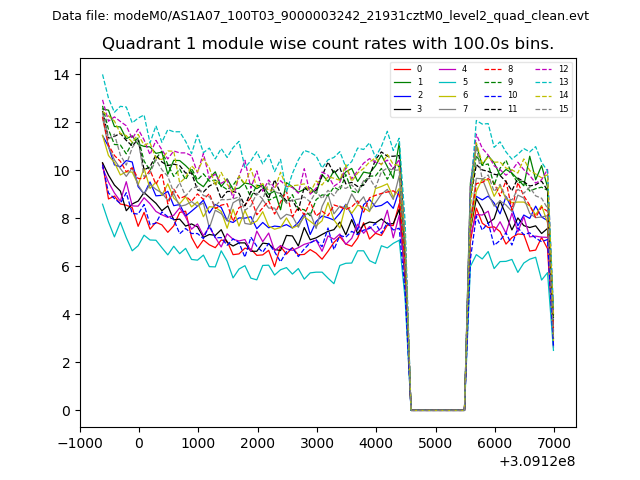
| Module-wise count rates for Quadrant A Data is divided into 100 sec bins |
 |
 |
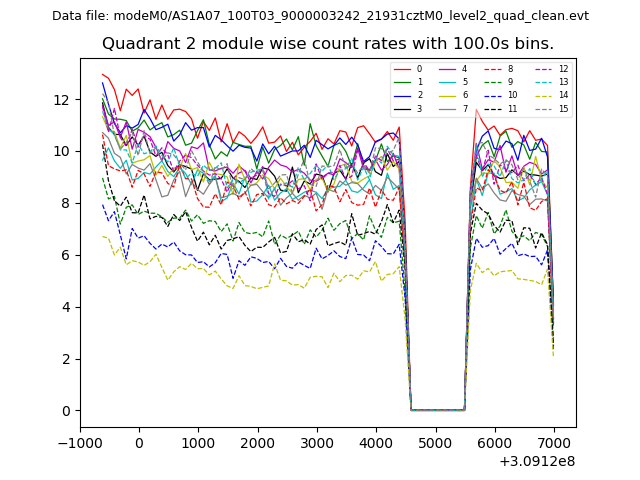
| Module-wise count rates for Quadrant B Data is divided into 100 sec bins |
 |
 |
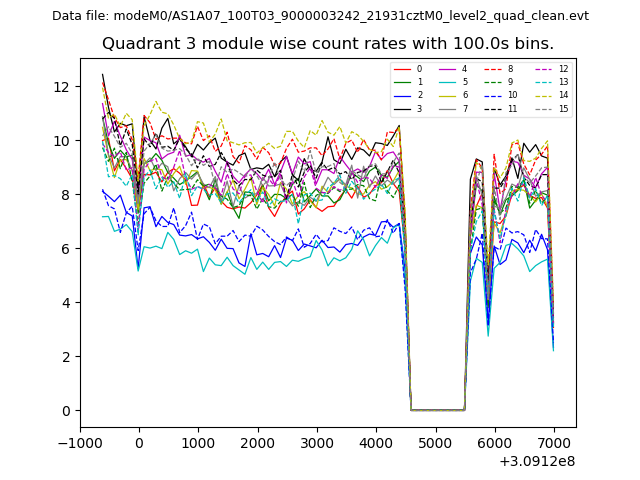
| Module-wise count rates for Quadrant C Data is divided into 100 sec bins |
 |
 |
| Module-wise count rates for Quadrant D Data is divided into 100 sec bins |
 |
 |
| Parameter | Plot |
|---|---|
| CZT HV Monitor | 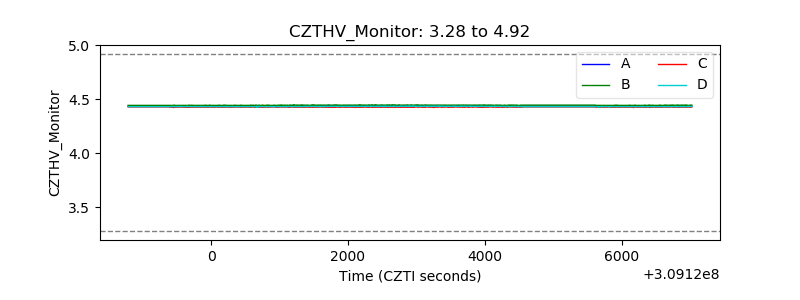 |
| D_VDD | 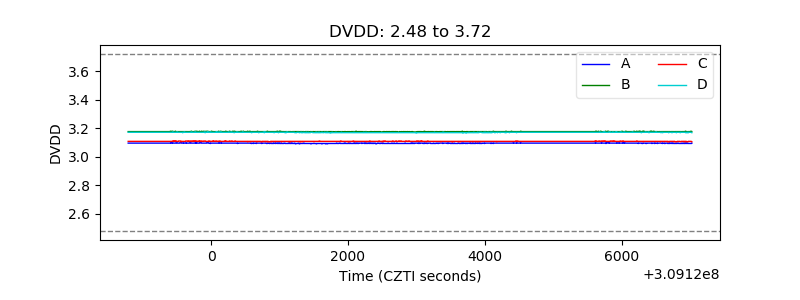 |
| Temperature 1 | 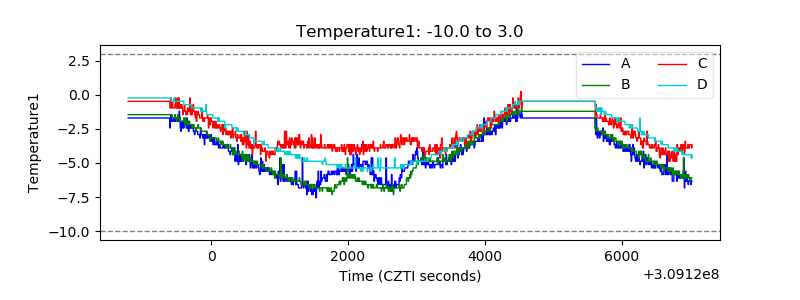 |
| Veto HV Monitor | 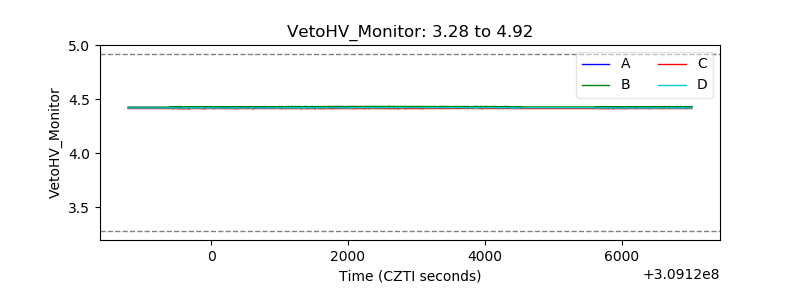 |
| Veto LLD | 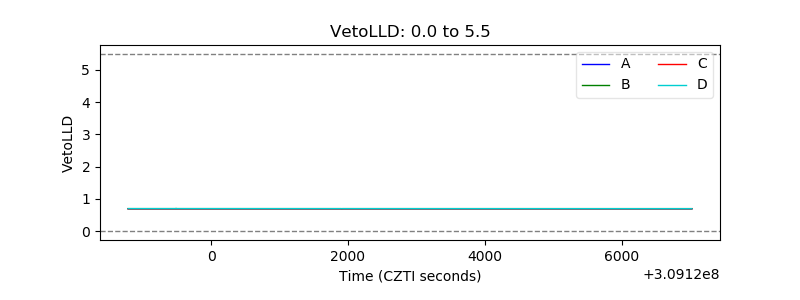 |
| Alpha Counter | 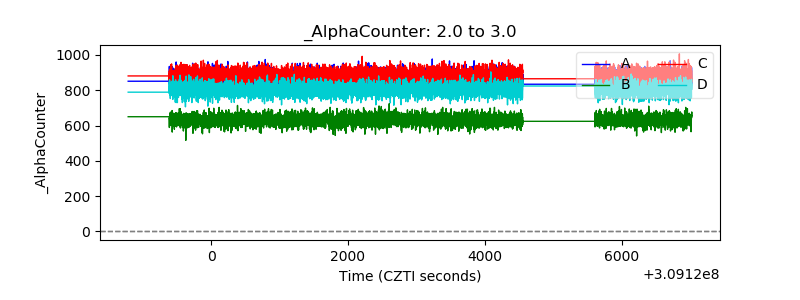 |
| _CPM_Rate | 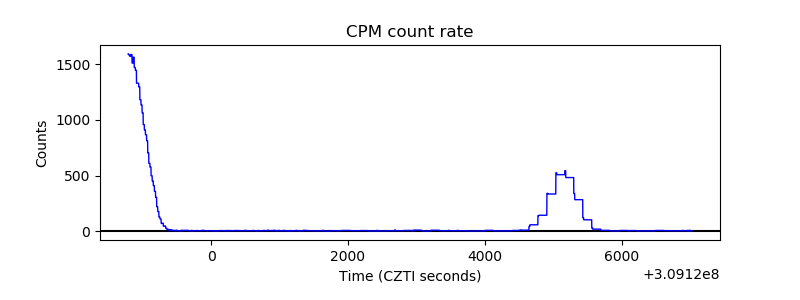 |
| CZT Counter | 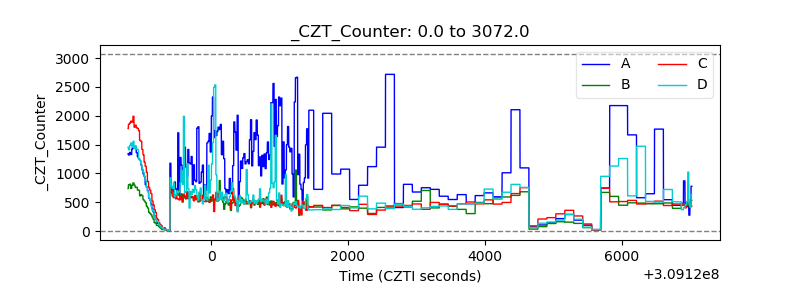 |
| +2.5 Volts monitor |  |
| +5 Volts monitor |  |
| _ROLL_ROT | 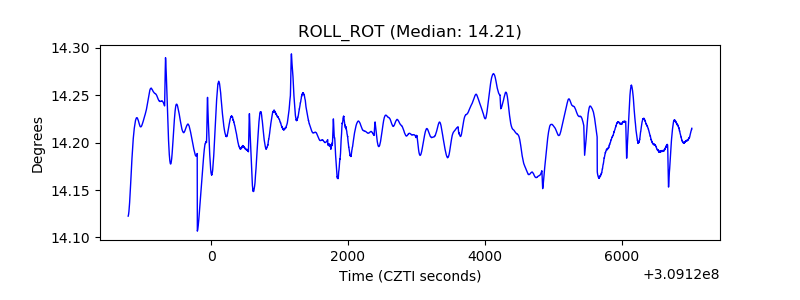 |
| _Roll_DEC | 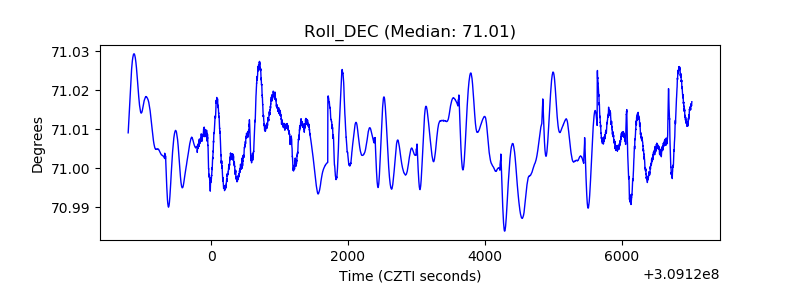 |
| _Roll_RA | 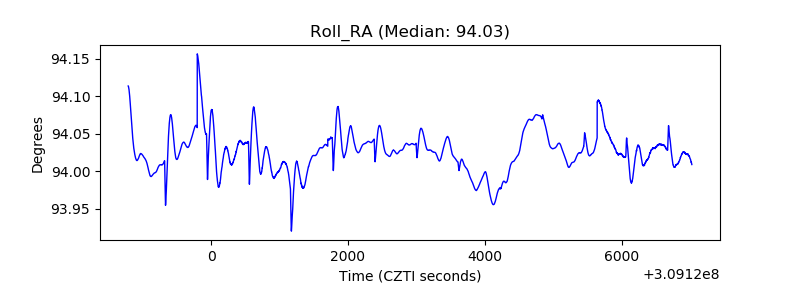 |
| Veto Counter | 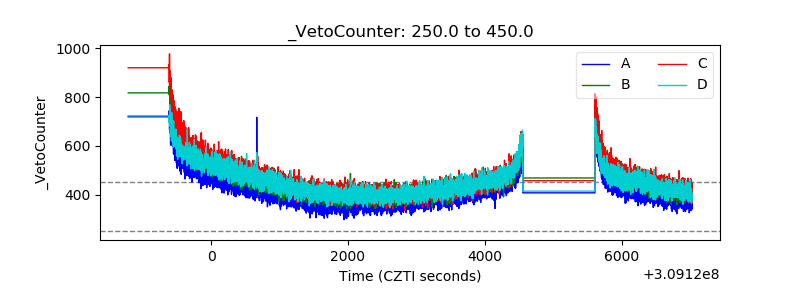 |