| Param | Original file | Final file |
|---|---|---|
| Filename | modeM0/AS1A07_100T03_9000003242_21932cztM0_level2.evt | modeM0/AS1A07_100T03_9000003242_21932cztM0_level2_quad_clean.evt |
| Size (bytes) | 638,971,200 | 131,944,320 |
| Size | 609.4 MB | 125.8 MB |
| Events in quadrant A | 6,453,180 | 848,754 |
| Events in quadrant B | 3,530,075 | 923,787 |
| Events in quadrant C | 3,288,218 | 906,424 |
| Events in quadrant D | 5,611,120 | 834,413 |
| Mode M0 | |||
|---|---|---|---|
| Quadrant | BADHDUFLAG | Total packets | Discarded packets |
| A | 0 | 23965 | 2 |
| B | 0 | 15027 | 2 |
| C | 0 | 14293 | 2 |
| D | 0 | 21580 | 4 |
| Mode SS | |||
|---|---|---|---|
| Quadrant | BADHDUFLAG | Total packets | Discarded packets |
| A | 0 | 140 | 0 |
| B | 0 | 140 | 0 |
| C | 0 | 140 | 0 |
| D | 0 | 140 | 0 |
| Mode M9 | |||
|---|---|---|---|
| Quadrant | BADHDUFLAG | Total packets | Discarded packets |
| A | 0 | 15 | 0 |
| B | 0 | 16 | 0 |
| C | 0 | 16 | 0 |
| D | 0 | 16 | 0 |
| Quadrant | Total seconds | Saturated seconds | Saturation percentage |
|---|---|---|---|
| A | 6923 | 1067 | 15.412393% |
| B | 6923 | 91 | 1.314459% |
| C | 6923 | 80 | 1.155568% |
| D | 6922 | 685 | 9.895984% |
Noise dominated data is calculated using 1-second bins in cleaned event files. If a bin has >2000 counts, and if more than 50% of those come from <1% of pixels, then it is considered to be noise-dominated and hence unusable.
| Quadrant | # 1 sec bins | Bins with >0 counts | Bins with >2000 counts | High rate bins dominated by noise | Noise dominated (total time) | Noise dominated (detector-on time) | Marked lightcurve |
|---|---|---|---|---|---|---|---|
| A | 7578 | 6923 | 684 | 684 | 9.03% | 9.88% | 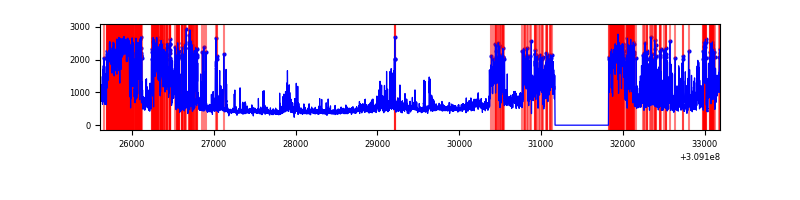 |
| B | 7578 | 6924 | 24 | 24 | 0.32% | 0.35% | 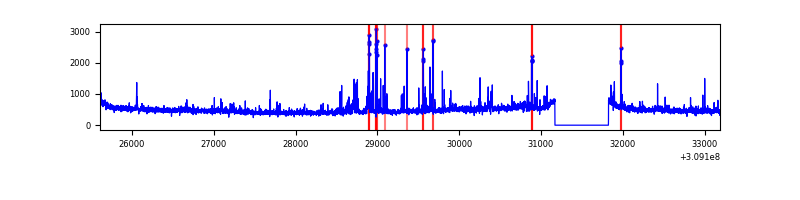 |
| C | 7578 | 6923 | 0 | 0 | 0.00% | 0.00% | 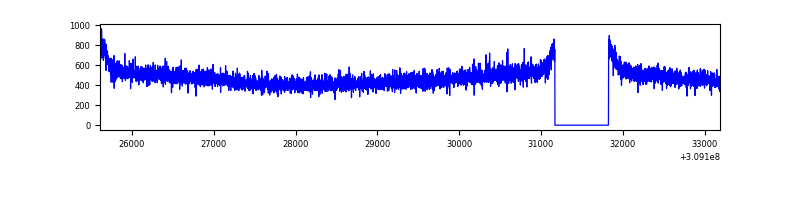 |
| D | 7577 | 6922 | 516 | 516 | 6.81% | 7.45% | 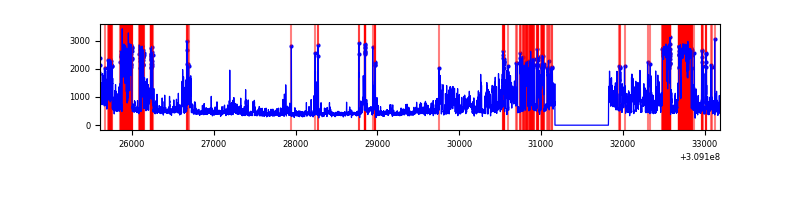 |
Top three noisy pixels from each quadrant. If the there are fewer than three noisy pixels in the level2.evt file, extra rows are filled as -1
| Pixel properties | Quadrant properties | ||||||
|---|---|---|---|---|---|---|---|
| Quadrant | DetID | PixID | Counts | Sigma | Mean | Median | Sigma |
| A | 15 | 236 | 3429412 | 21923.16 | 778 | 762 | 156.4 |
| A | 13 | 254 | 12316 | 73.88 | 778 | 762 | 156.4 |
| A | 4 | 2 | 8237 | 47.8 | 778 | 762 | 156.4 |
| B | 3 | 64 | 210200 | 1351.92 | 827 | 806 | 154.9 |
| B | 0 | 219 | 25018 | 156.32 | 827 | 806 | 154.9 |
| B | 0 | 190 | 23800 | 148.46 | 827 | 806 | 154.9 |
| C | 14 | 238 | 128513 | 681.12 | 809 | 812 | 187.5 |
| C | 4 | 175 | 6350 | 29.54 | 809 | 812 | 187.5 |
| C | 13 | 61 | 5524 | 25.13 | 809 | 812 | 187.5 |
| D | 12 | 235 | 1158925 | 6164.67 | 780 | 758 | 187.9 |
| D | 1 | 52 | 1077437 | 5730.93 | 780 | 758 | 187.9 |
| D | 7 | 238 | 234922 | 1246.4 | 780 | 758 | 187.9 |
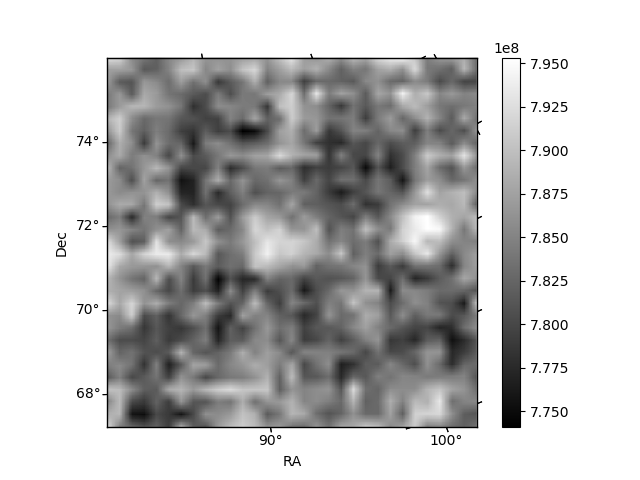
Histogram calculated using DETX and DETY for each event in the final _common_clean file
| Quadrant A | 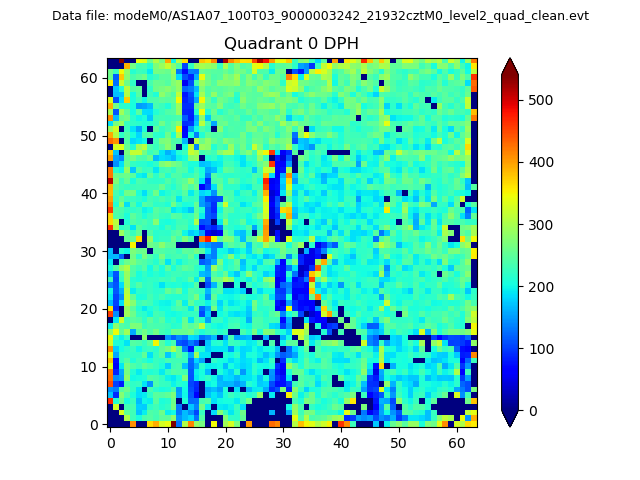 |
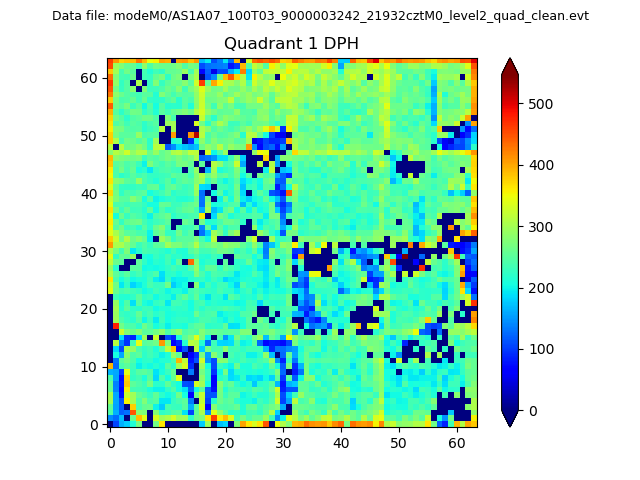 |
Quadrant B |
|---|---|---|---|
| Quadrant D |  |
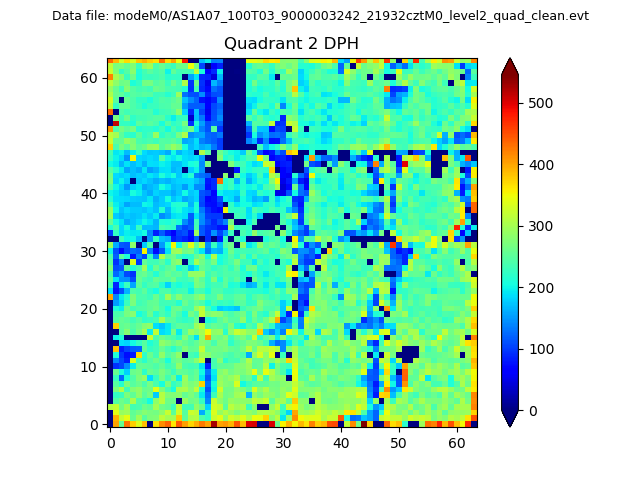 |
Quadrant C |
| Plot type | Count rate plots | Images |
|---|---|---|
| Comparison with Poisson distribution Blue bars denote a histogram of data divided into 1 sec bins. Red curve is a Poisson curve with rate = median count rate of data. |
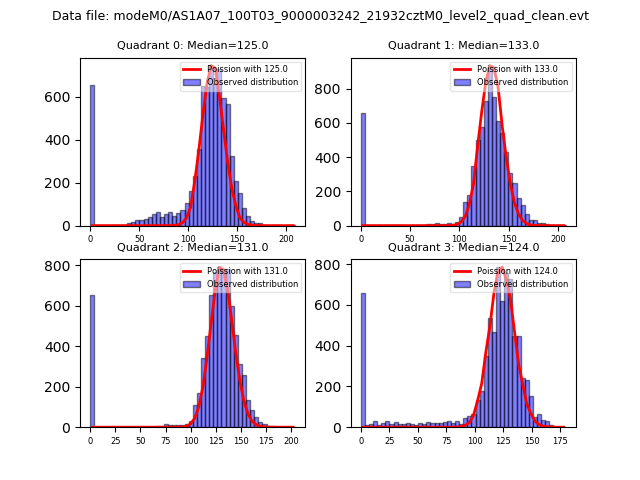 |
 |
| Quadrant-wise count rates Data is divided into 100 sec bins |
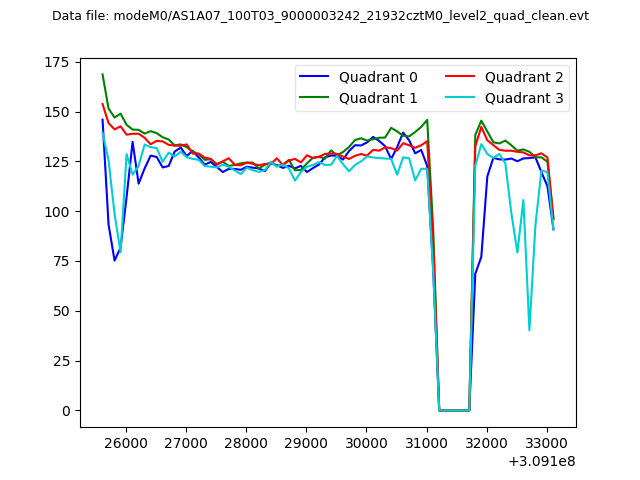 |
|
| Module-wise count rates for Quadrant A Data is divided into 100 sec bins |
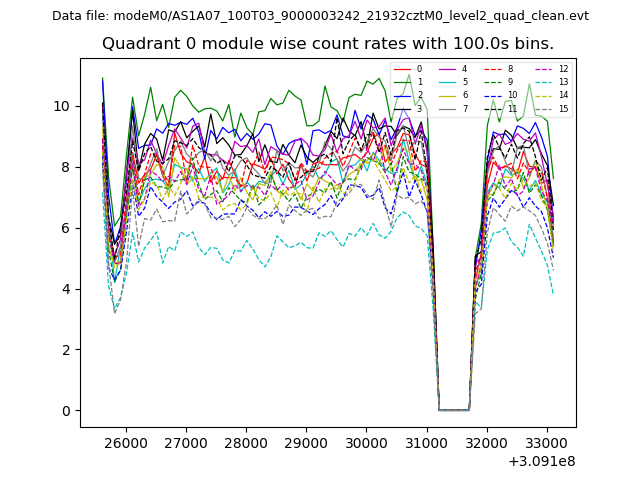 |
 |
| Module-wise count rates for Quadrant B Data is divided into 100 sec bins |
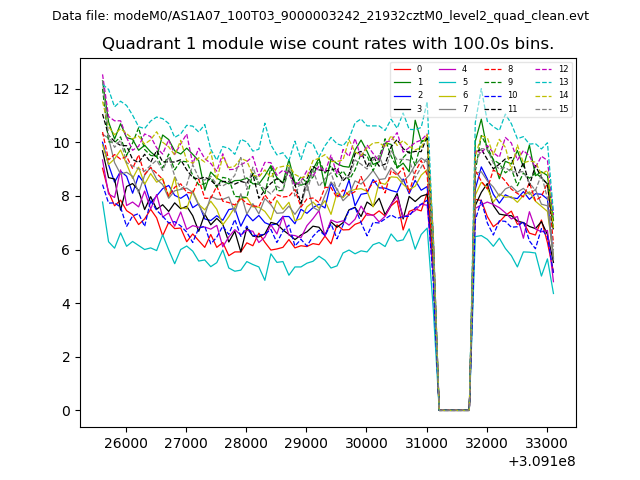 |
 |
| Module-wise count rates for Quadrant C Data is divided into 100 sec bins |
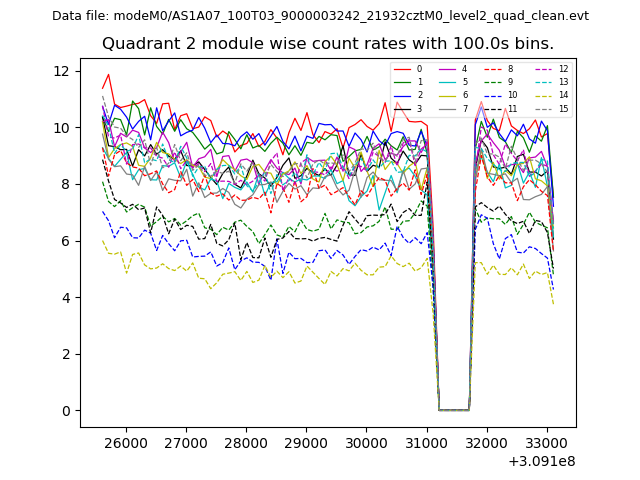 |
 |
| Module-wise count rates for Quadrant D Data is divided into 100 sec bins |
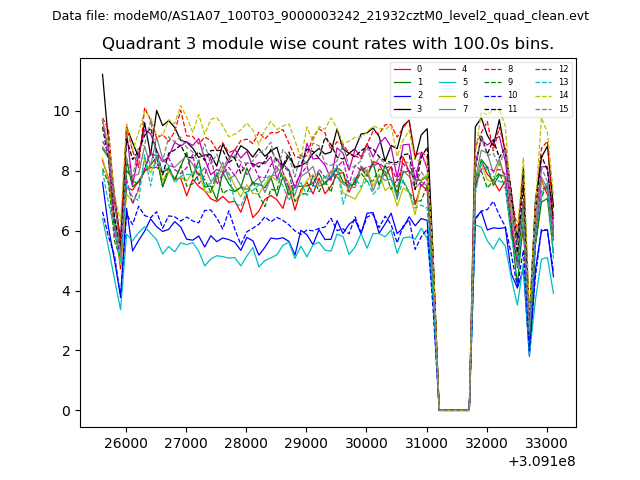 |
 |
| Parameter | Plot |
|---|---|
| CZT HV Monitor |  |
| D_VDD | 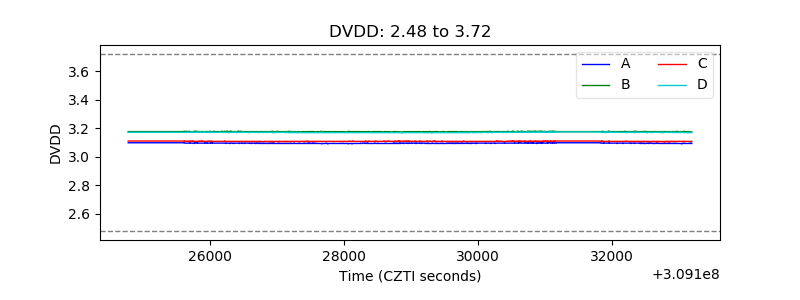 |
| Temperature 1 | 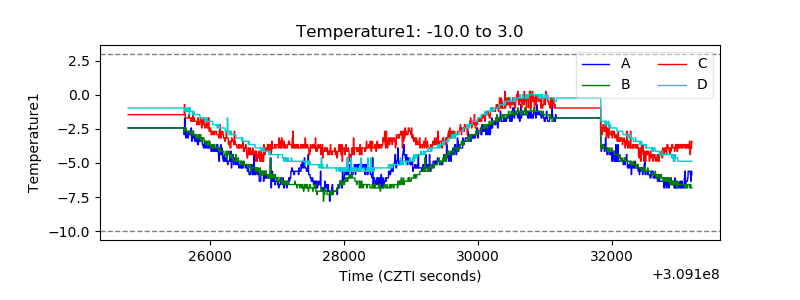 |
| Veto HV Monitor | 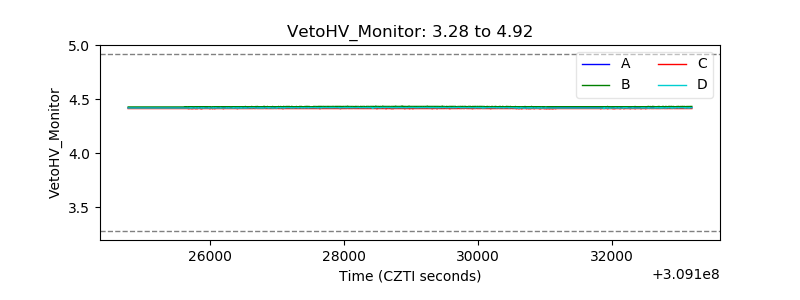 |
| Veto LLD | 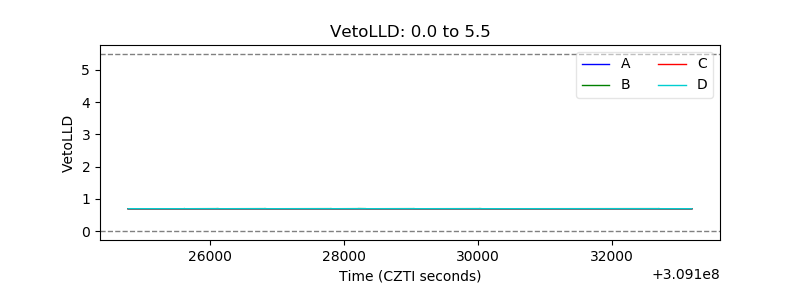 |
| Alpha Counter | 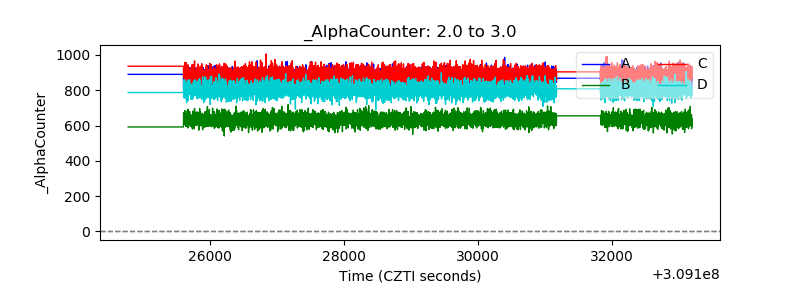 |
| _CPM_Rate | 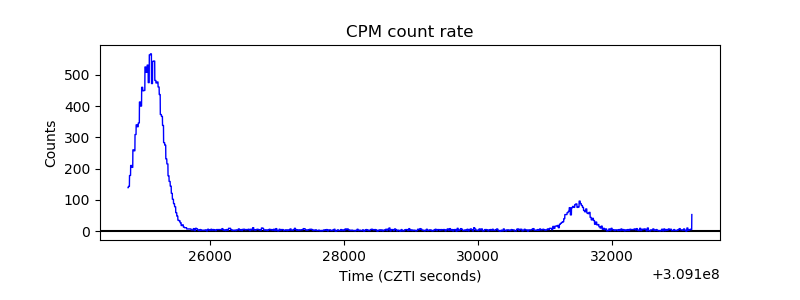 |
| CZT Counter | 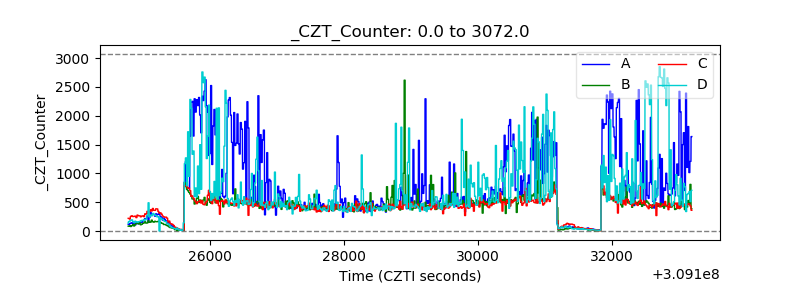 |
| +2.5 Volts monitor |  |
| +5 Volts monitor |  |
| _ROLL_ROT | 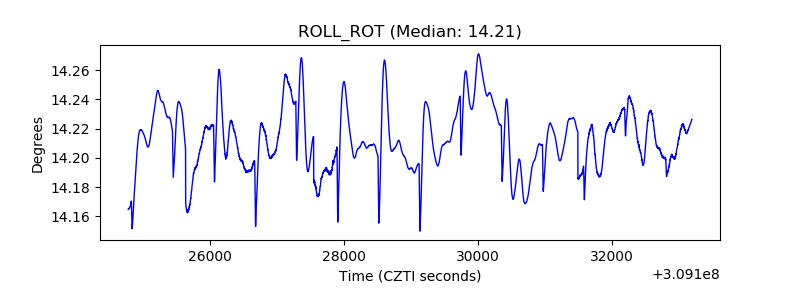 |
| _Roll_DEC | 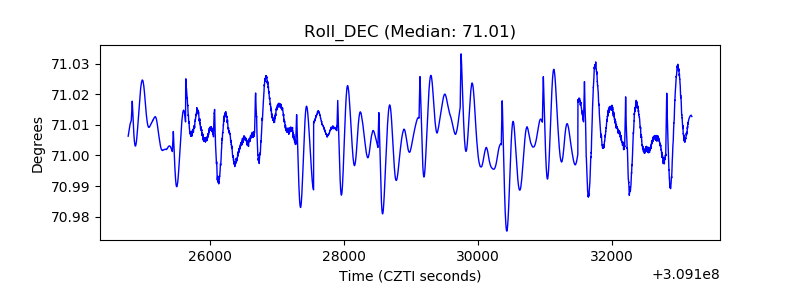 |
| _Roll_RA | 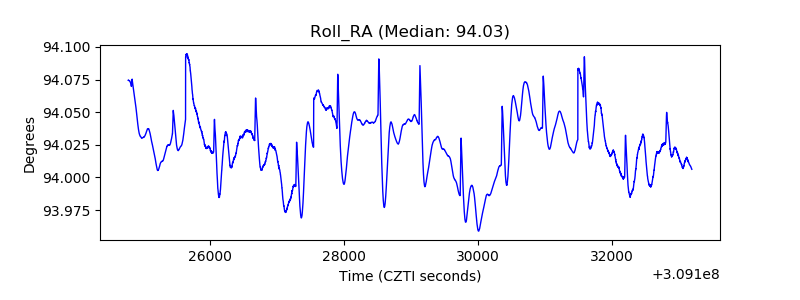 |
| Veto Counter | 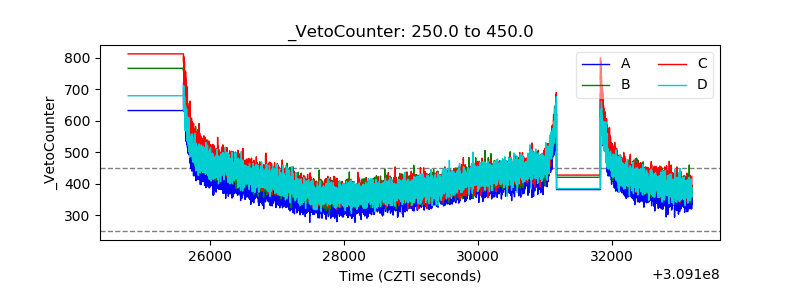 |