| Param | Original file | Final file |
|---|---|---|
| Filename | modeM0/AS1A07_100T03_9000003242_21933cztM0_level2.evt | modeM0/AS1A07_100T03_9000003242_21933cztM0_level2_quad_clean.evt |
| Size (bytes) | 644,878,080 | 136,437,120 |
| Size | 615.0 MB | 130.1 MB |
| Events in quadrant A | 4,968,950 | 911,568 |
| Events in quadrant B | 3,621,732 | 949,373 |
| Events in quadrant C | 3,457,782 | 930,224 |
| Events in quadrant D | 6,985,495 | 830,721 |
| Mode M0 | |||
|---|---|---|---|
| Quadrant | BADHDUFLAG | Total packets | Discarded packets |
| A | 0 | 19808 | 1 |
| B | 0 | 15620 | 1 |
| C | 0 | 15201 | 1 |
| D | 0 | 25768 | 1 |
| Mode SS | |||
|---|---|---|---|
| Quadrant | BADHDUFLAG | Total packets | Discarded packets |
| A | 0 | 148 | 0 |
| B | 0 | 148 | 0 |
| C | 0 | 148 | 0 |
| D | 0 | 148 | 0 |
| Mode M9 | |||
|---|---|---|---|
| Quadrant | BADHDUFLAG | Total packets | Discarded packets |
| A | 0 | 4 | 0 |
| B | 0 | 5 | 0 |
| C | 0 | 5 | 0 |
| D | 0 | 5 | 0 |
| Quadrant | Total seconds | Saturated seconds | Saturation percentage |
|---|---|---|---|
| A | 7335 | 386 | 5.262440% |
| B | 7335 | 81 | 1.104294% |
| C | 7335 | 79 | 1.077028% |
| D | 7335 | 1020 | 13.905930% |
Noise dominated data is calculated using 1-second bins in cleaned event files. If a bin has >2000 counts, and if more than 50% of those come from <1% of pixels, then it is considered to be noise-dominated and hence unusable.
| Quadrant | # 1 sec bins | Bins with >0 counts | Bins with >2000 counts | High rate bins dominated by noise | Noise dominated (total time) | Noise dominated (detector-on time) | Marked lightcurve |
|---|---|---|---|---|---|---|---|
| A | 7640 | 7336 | 254 | 254 | 3.32% | 3.46% | 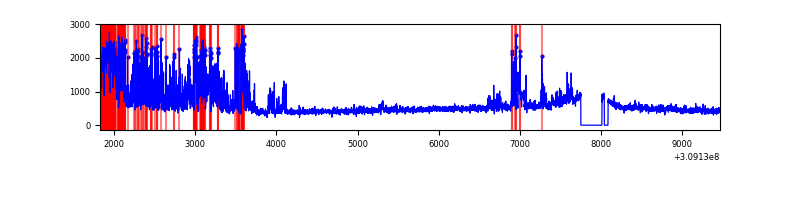 |
| B | 7640 | 7337 | 21 | 21 | 0.27% | 0.29% | 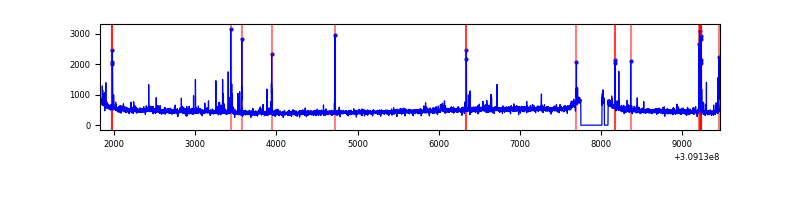 |
| C | 7640 | 7337 | 1 | 1 | 0.01% | 0.01% | 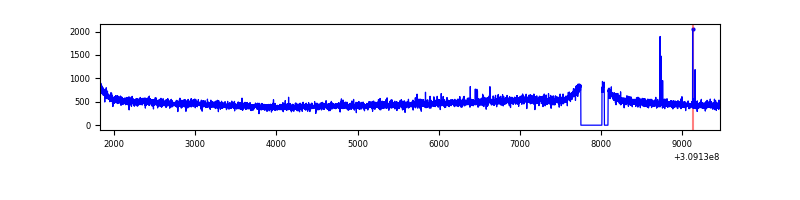 |
| D | 7640 | 7335 | 845 | 845 | 11.06% | 11.52% | 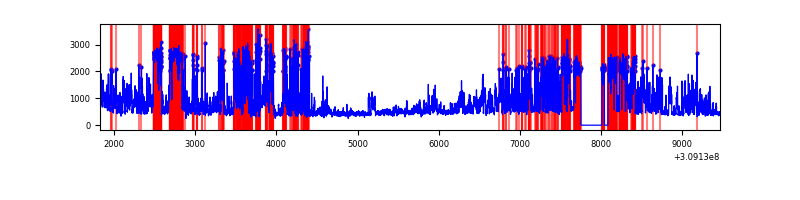 |
Top three noisy pixels from each quadrant. If the there are fewer than three noisy pixels in the level2.evt file, extra rows are filled as -1
| Pixel properties | Quadrant properties | ||||||
|---|---|---|---|---|---|---|---|
| Quadrant | DetID | PixID | Counts | Sigma | Mean | Median | Sigma |
| A | 15 | 236 | 1666618 | 9724.12 | 850 | 831 | 171.3 |
| A | 4 | 2 | 15318 | 84.57 | 850 | 831 | 171.3 |
| A | 13 | 254 | 12917 | 70.55 | 850 | 831 | 171.3 |
| B | 3 | 64 | 133948 | 805.49 | 869 | 846 | 165.2 |
| B | 12 | 111 | 19920 | 115.43 | 869 | 846 | 165.2 |
| B | 0 | 190 | 19900 | 115.31 | 869 | 846 | 165.2 |
| C | 14 | 238 | 131724 | 660.52 | 849 | 851 | 198.1 |
| C | 9 | 54 | 14418 | 68.47 | 849 | 851 | 198.1 |
| C | 13 | 61 | 5872 | 25.34 | 849 | 851 | 198.1 |
| D | 1 | 52 | 2000961 | 10471.01 | 791 | 769 | 191.0 |
| D | 12 | 235 | 1257026 | 6576.51 | 791 | 769 | 191.0 |
| D | 7 | 238 | 607378 | 3175.6 | 791 | 769 | 191.0 |
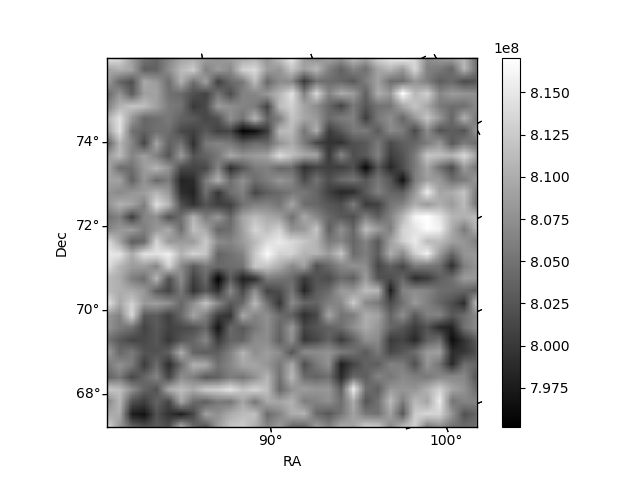
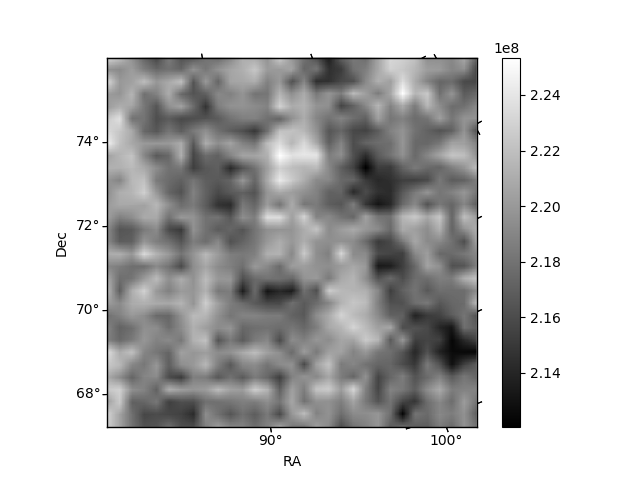
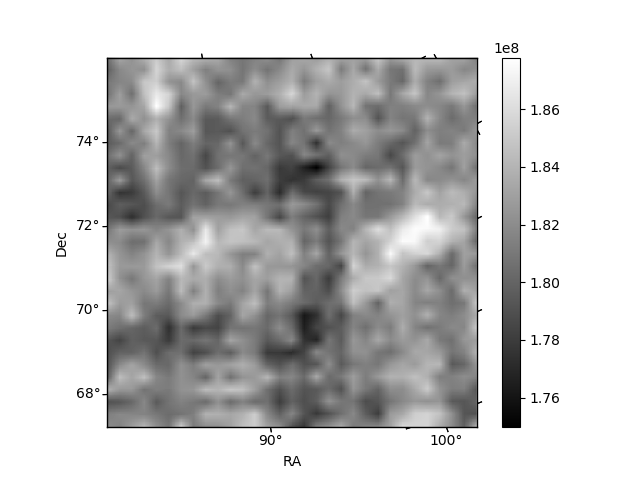
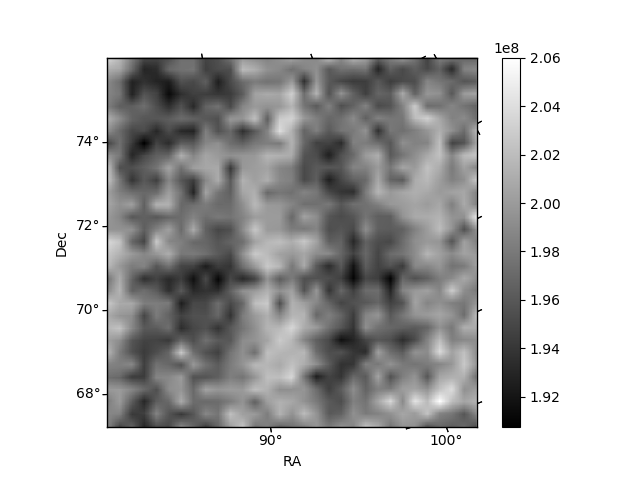
Histogram calculated using DETX and DETY for each event in the final _common_clean file
| Quadrant A |  |
 |
Quadrant B |
|---|---|---|---|
| Quadrant D |  |
 |
Quadrant C |
| Plot type | Count rate plots | Images |
|---|---|---|
| Comparison with Poisson distribution Blue bars denote a histogram of data divided into 1 sec bins. Red curve is a Poisson curve with rate = median count rate of data. |
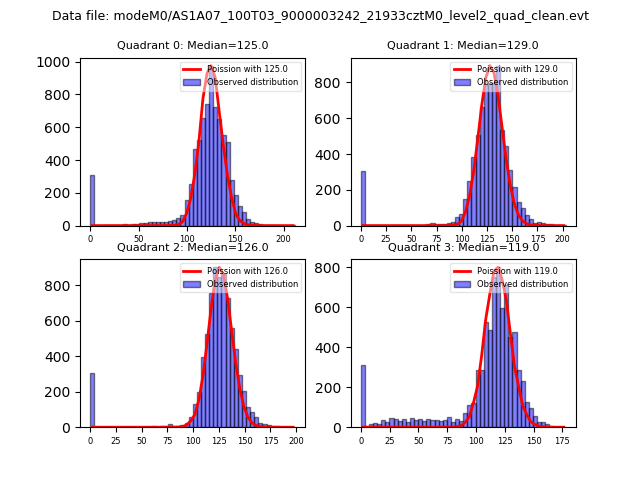 |
 |
| Quadrant-wise count rates Data is divided into 100 sec bins |
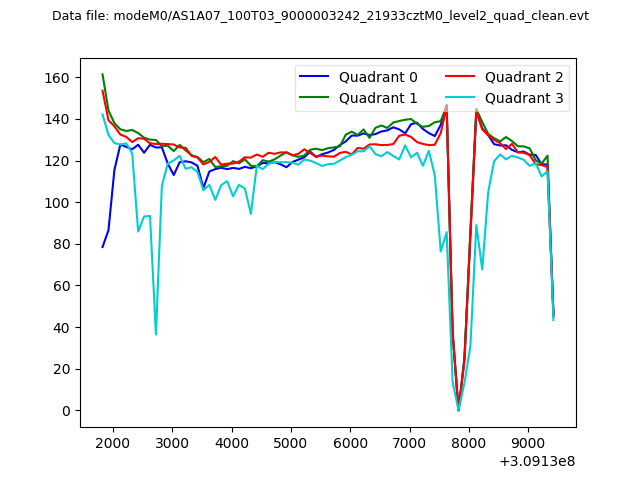 |
|
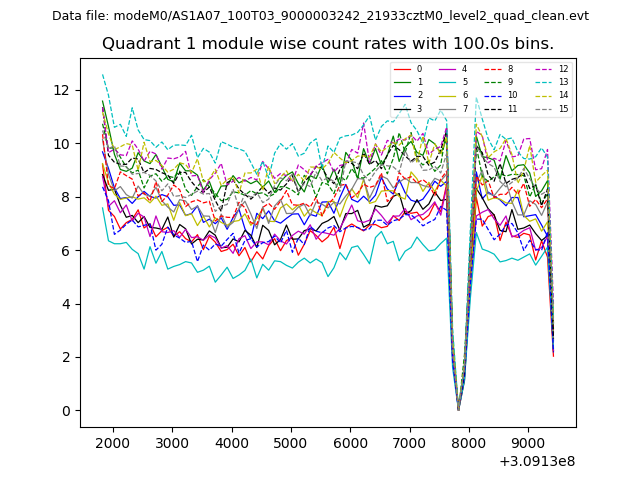
| Module-wise count rates for Quadrant A Data is divided into 100 sec bins |
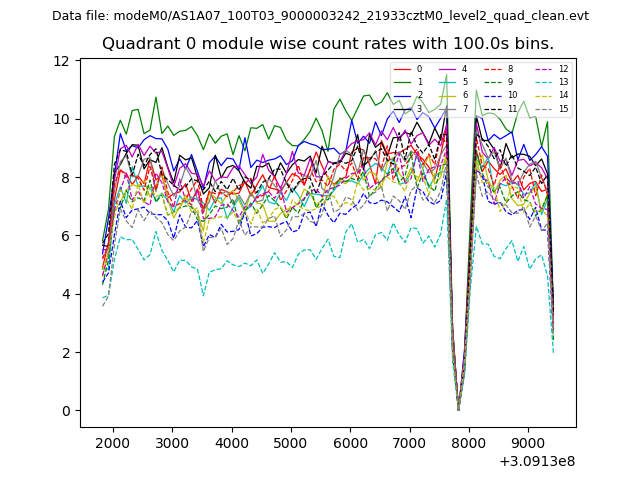 |
 |
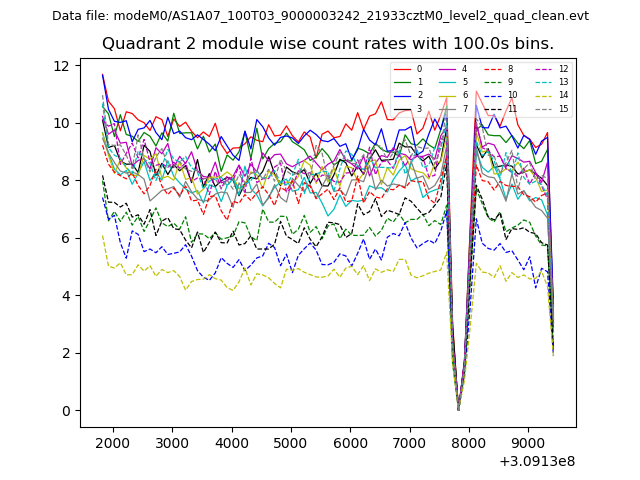
| Module-wise count rates for Quadrant B Data is divided into 100 sec bins |
 |
 |
| Module-wise count rates for Quadrant C Data is divided into 100 sec bins |
 |
 |
| Module-wise count rates for Quadrant D Data is divided into 100 sec bins |
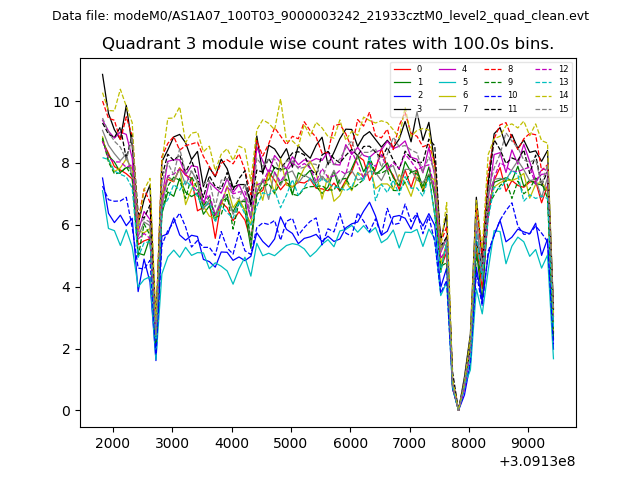 |
 |
| Parameter | Plot |
|---|---|
| CZT HV Monitor | 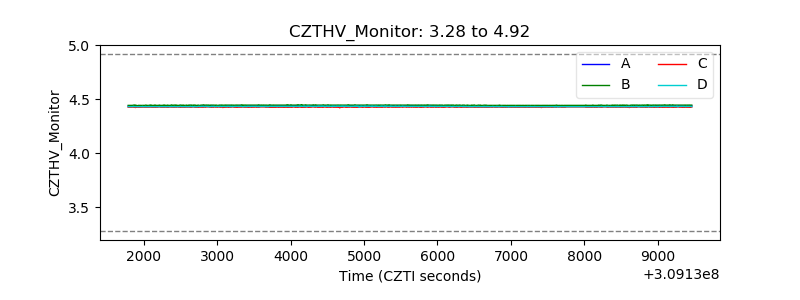 |
| D_VDD | 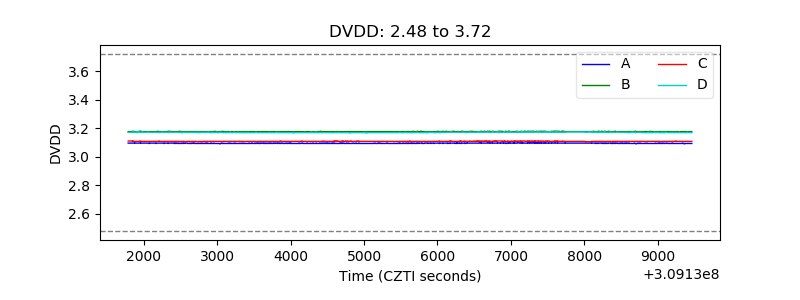 |
| Temperature 1 | 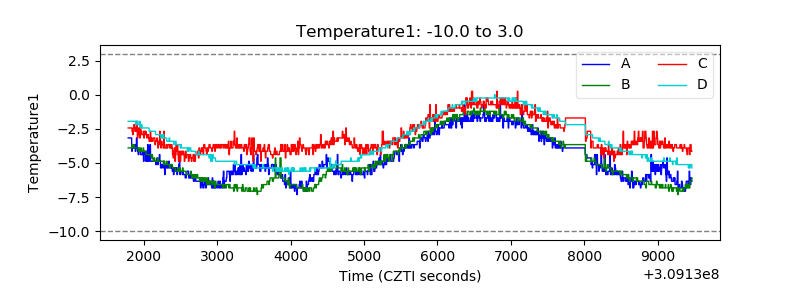 |
| Veto HV Monitor | 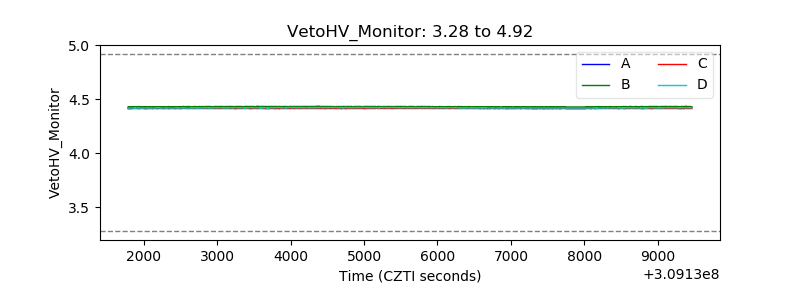 |
| Veto LLD | 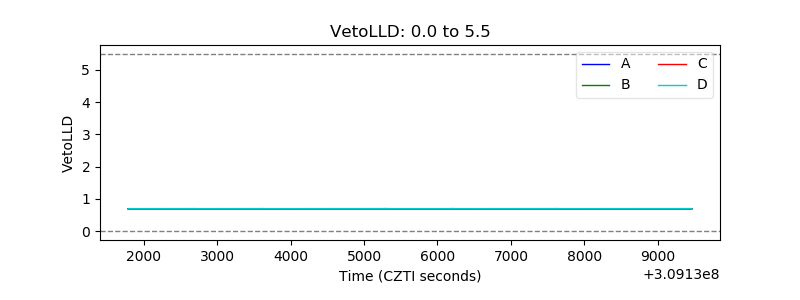 |
| Alpha Counter | 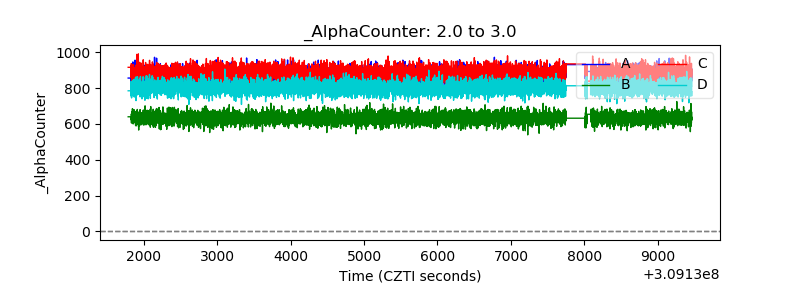 |
| _CPM_Rate | 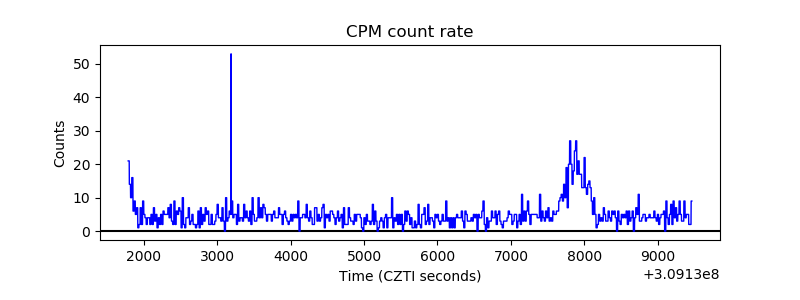 |
| CZT Counter | 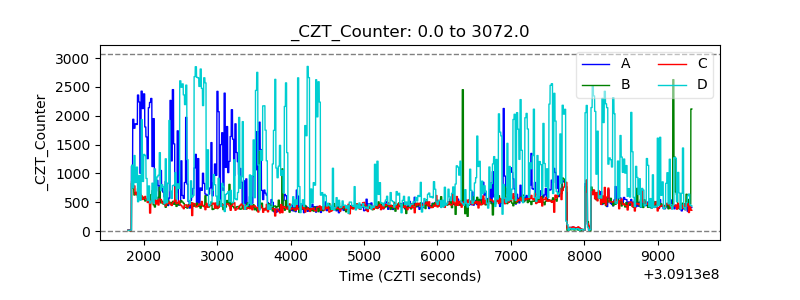 |
| +2.5 Volts monitor |  |
| +5 Volts monitor | 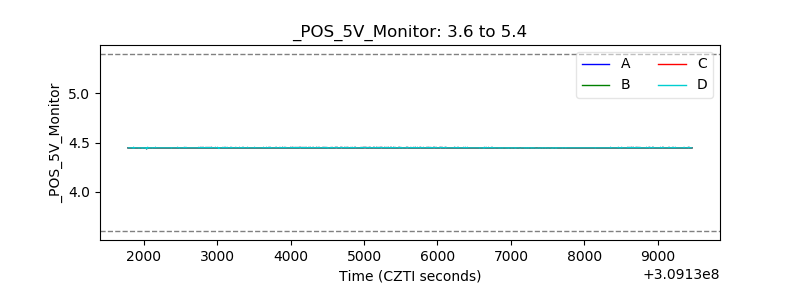 |
| _ROLL_ROT | 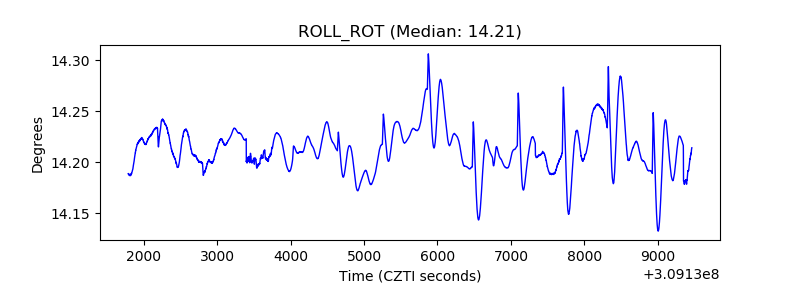 |
| _Roll_DEC | 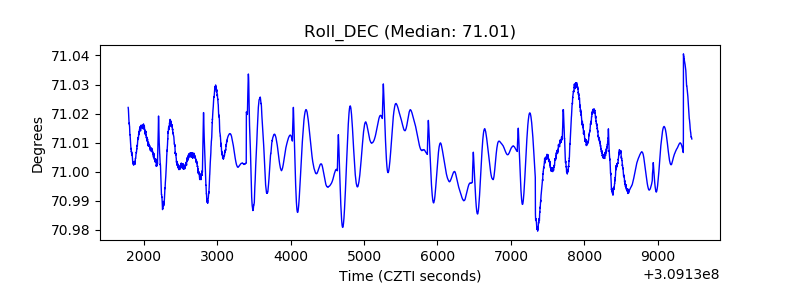 |
| _Roll_RA | 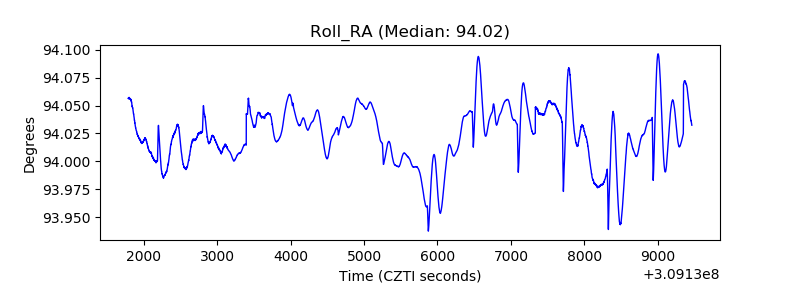 |
| Veto Counter | 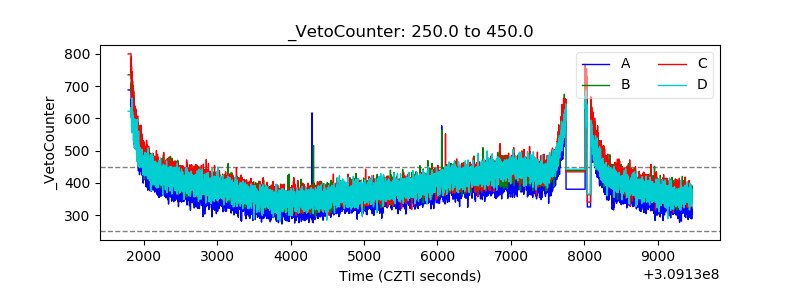 |