| Param | Original file | Final file |
|---|---|---|
| Filename | modeM0/AS1A07_100T03_9000003242_21937cztM0_level2.evt | modeM0/AS1A07_100T03_9000003242_21937cztM0_level2_quad_clean.evt |
| Size (bytes) | 1,031,235,840 | 232,156,800 |
| Size | 983.5 MB | 221.4 MB |
| Events in quadrant A | 5,753,048 | 1,579,281 |
| Events in quadrant B | 6,035,596 | 1,598,475 |
| Events in quadrant C | 5,819,425 | 1,554,676 |
| Events in quadrant D | 12,762,306 | 1,418,853 |
| Mode M0 | |||
|---|---|---|---|
| Quadrant | BADHDUFLAG | Total packets | Discarded packets |
| A | 0 | 25770 | 3 |
| B | 0 | 26315 | 3 |
| C | 0 | 25861 | 3 |
| D | 0 | 46953 | 3 |
| Mode SS | |||
|---|---|---|---|
| Quadrant | BADHDUFLAG | Total packets | Discarded packets |
| A | 0 | 258 | 0 |
| B | 0 | 258 | 0 |
| C | 0 | 258 | 0 |
| D | 0 | 258 | 0 |
| Mode M9 | |||
|---|---|---|---|
| Quadrant | BADHDUFLAG | Total packets | Discarded packets |
| A | 0 | 17 | 0 |
| B | 0 | 18 | 0 |
| C | 0 | 18 | 0 |
| D | 0 | 18 | 0 |
| Quadrant | Total seconds | Saturated seconds | Saturation percentage |
|---|---|---|---|
| A | 12739 | 70 | 0.549494% |
| B | 12739 | 117 | 0.918439% |
| C | 12739 | 108 | 0.847790% |
| D | 12739 | 1583 | 12.426407% |
Noise dominated data is calculated using 1-second bins in cleaned event files. If a bin has >2000 counts, and if more than 50% of those come from <1% of pixels, then it is considered to be noise-dominated and hence unusable.
| Quadrant | # 1 sec bins | Bins with >0 counts | Bins with >2000 counts | High rate bins dominated by noise | Noise dominated (total time) | Noise dominated (detector-on time) | Marked lightcurve |
|---|---|---|---|---|---|---|---|
| A | 14089 | 12739 | 1 | 1 | 0.01% | 0.01% |  |
| B | 14089 | 12739 | 15 | 15 | 0.11% | 0.12% | 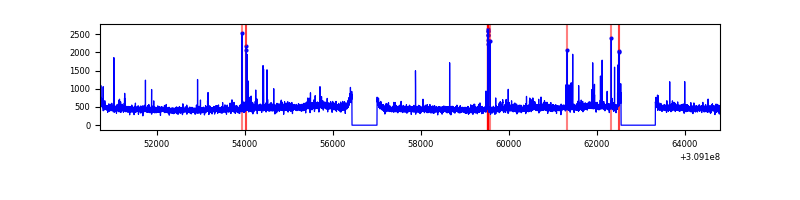 |
| C | 14089 | 12739 | 0 | 0 | 0.00% | 0.00% | 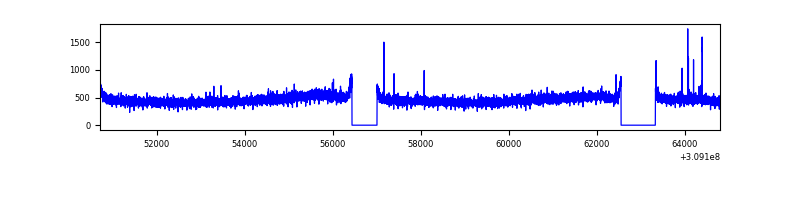 |
| D | 14089 | 12740 | 1388 | 1388 | 9.85% | 10.89% |  |
Top three noisy pixels from each quadrant. If the there are fewer than three noisy pixels in the level2.evt file, extra rows are filled as -1
| Pixel properties | Quadrant properties | ||||||
|---|---|---|---|---|---|---|---|
| Quadrant | DetID | PixID | Counts | Sigma | Mean | Median | Sigma |
| A | 13 | 254 | 22268 | 70.26 | 1484 | 1453 | 296.3 |
| A | 4 | 2 | 18484 | 57.48 | 1484 | 1453 | 296.3 |
| A | 3 | 1 | 12806 | 38.32 | 1484 | 1453 | 296.3 |
| B | 3 | 64 | 135073 | 475.24 | 1479 | 1439 | 281.2 |
| B | 0 | 219 | 36231 | 123.73 | 1479 | 1439 | 281.2 |
| B | 12 | 111 | 34418 | 117.28 | 1479 | 1439 | 281.2 |
| C | 14 | 238 | 225640 | 678.95 | 1426 | 1431 | 330.2 |
| C | 5 | 4 | 25523 | 72.95 | 1426 | 1431 | 330.2 |
| C | 13 | 61 | 9919 | 25.7 | 1426 | 1431 | 330.2 |
| D | 12 | 235 | 3767002 | 11415.52 | 1376 | 1335 | 329.9 |
| D | 7 | 238 | 3031387 | 9185.52 | 1376 | 1335 | 329.9 |
| D | 1 | 52 | 315813 | 953.33 | 1376 | 1335 | 329.9 |
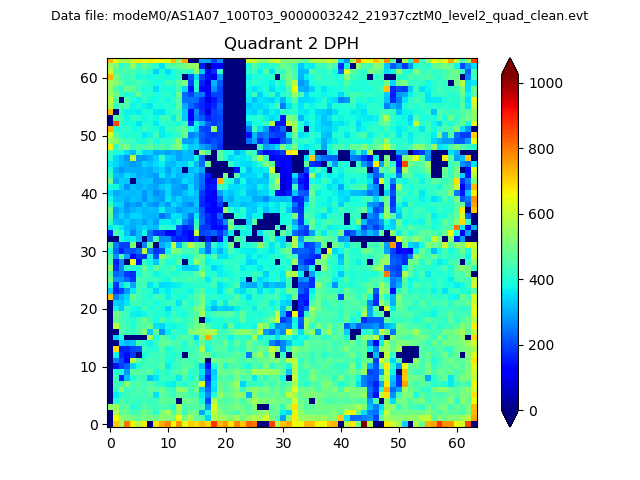
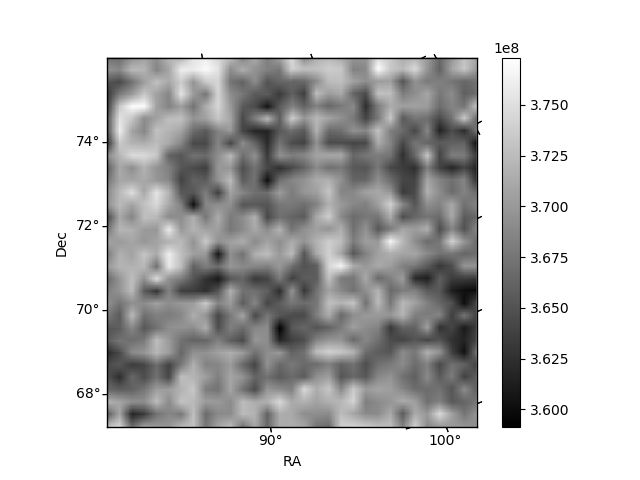
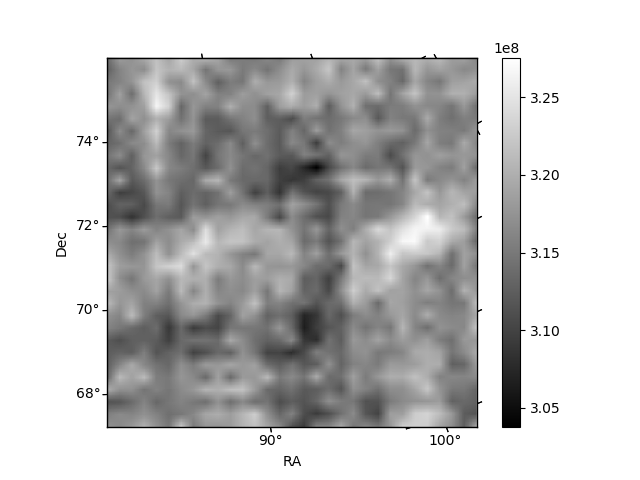
Histogram calculated using DETX and DETY for each event in the final _common_clean file
| Quadrant A | 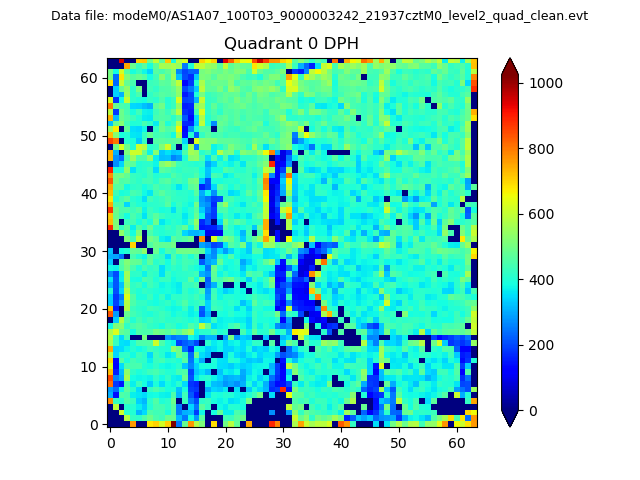 |
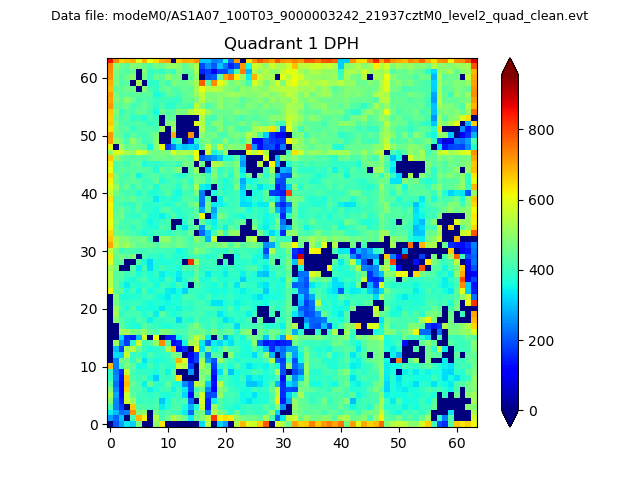 |
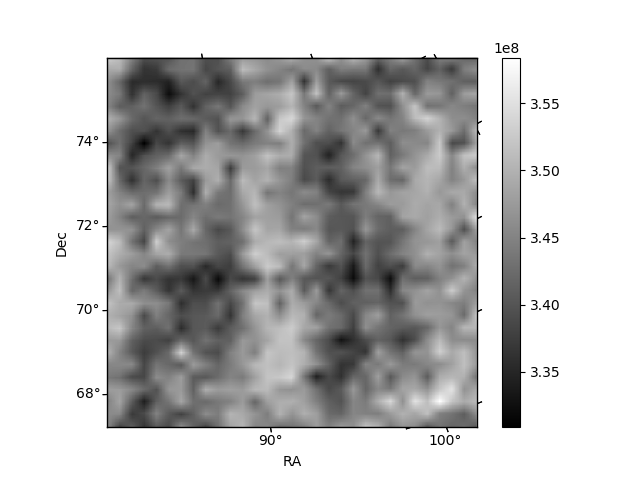
Quadrant B |
|---|---|---|---|
| Quadrant D | 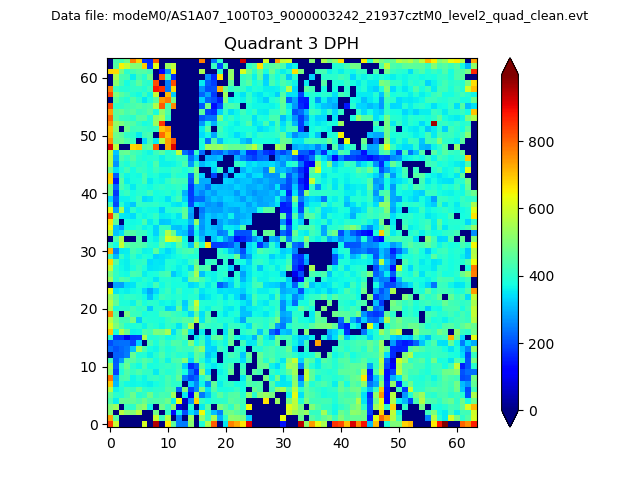 |
 |
Quadrant C |
| Plot type | Count rate plots | Images |
|---|---|---|
| Comparison with Poisson distribution Blue bars denote a histogram of data divided into 1 sec bins. Red curve is a Poisson curve with rate = median count rate of data. |
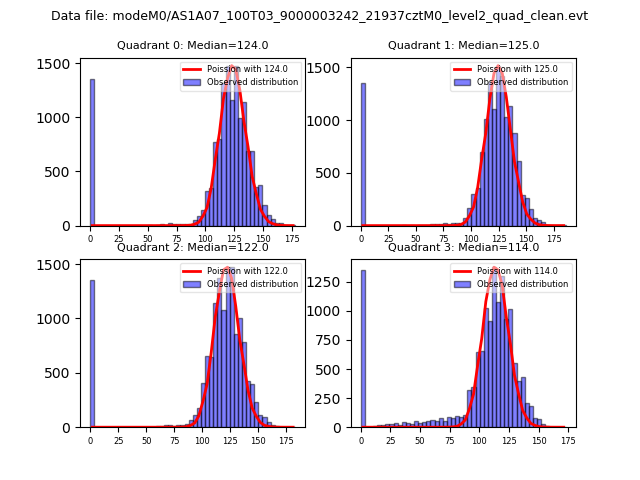 |
 |
| Quadrant-wise count rates Data is divided into 100 sec bins |
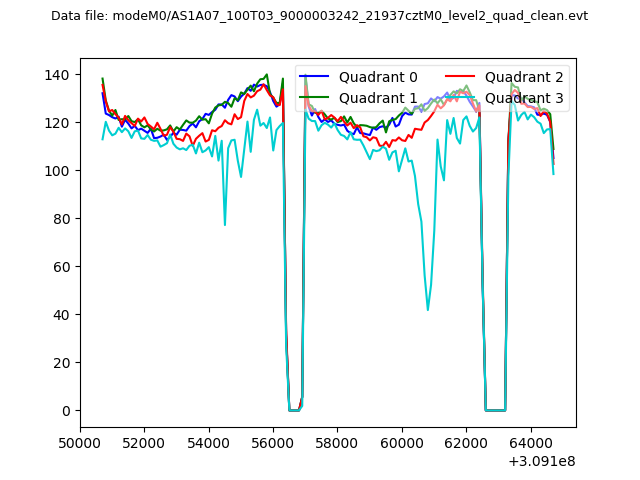 |
|
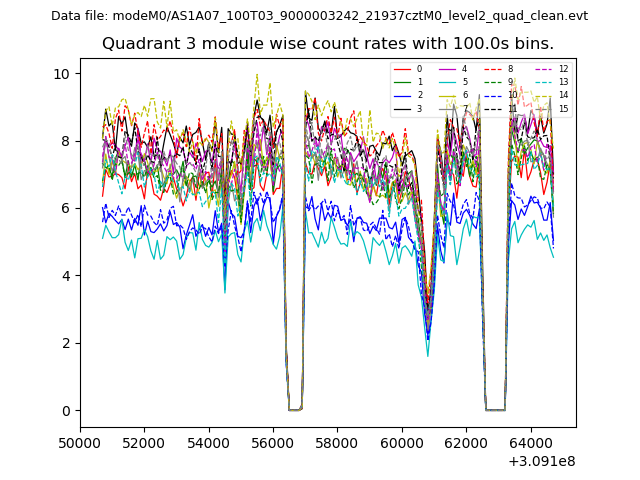
| Module-wise count rates for Quadrant A Data is divided into 100 sec bins |
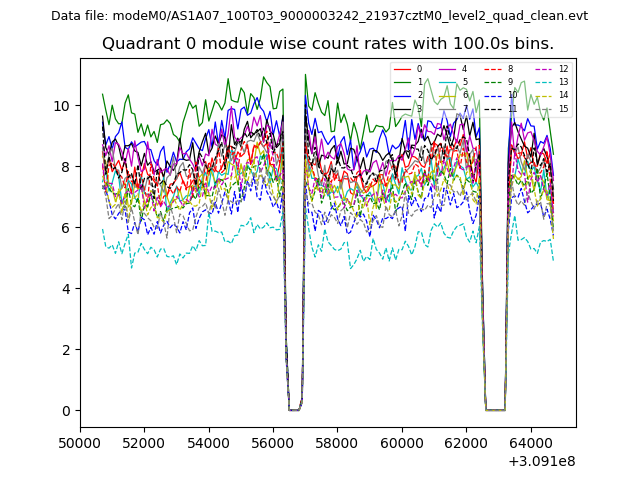 |
 |
| Module-wise count rates for Quadrant B Data is divided into 100 sec bins |
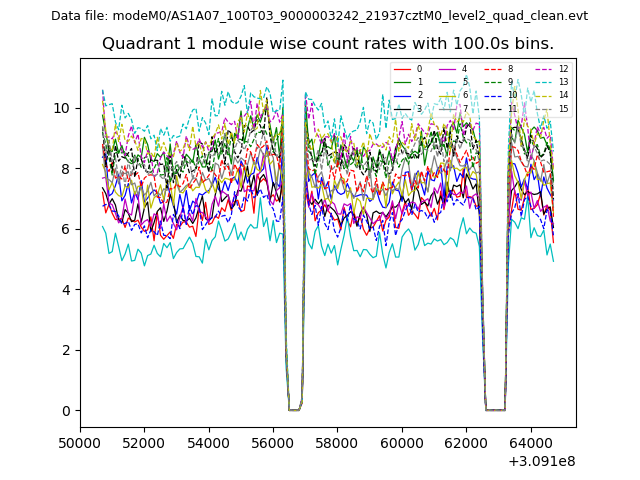 |
 |
| Module-wise count rates for Quadrant C Data is divided into 100 sec bins |
 |
 |
| Module-wise count rates for Quadrant D Data is divided into 100 sec bins |
 |
 |
| Parameter | Plot |
|---|---|
| CZT HV Monitor | 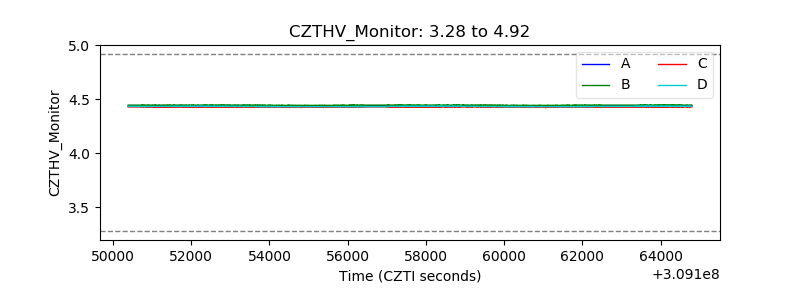 |
| D_VDD |  |
| Temperature 1 | 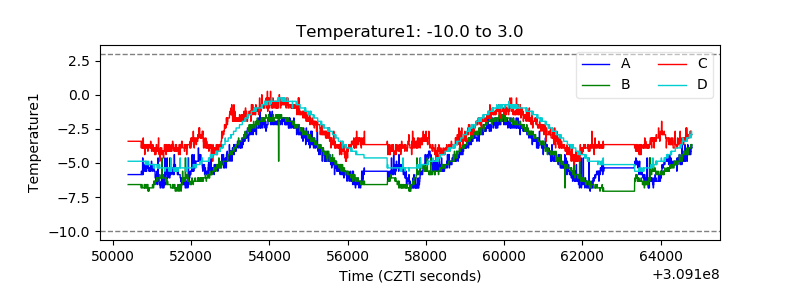 |
| Veto HV Monitor |  |
| Veto LLD | 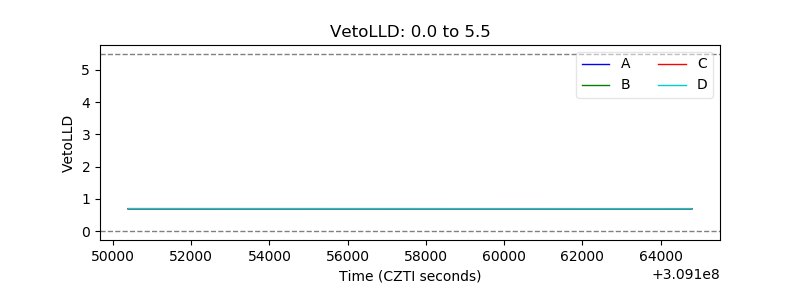 |
| Alpha Counter | 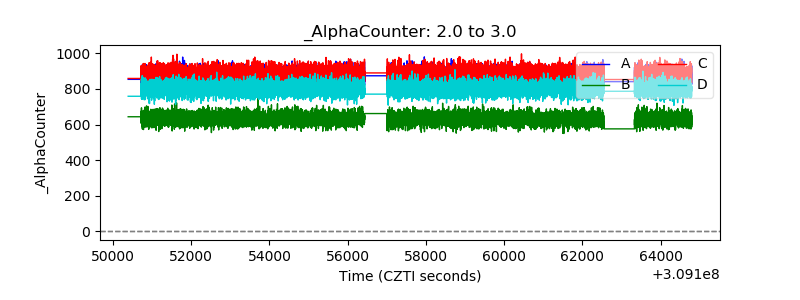 |
| _CPM_Rate |  |
| CZT Counter | 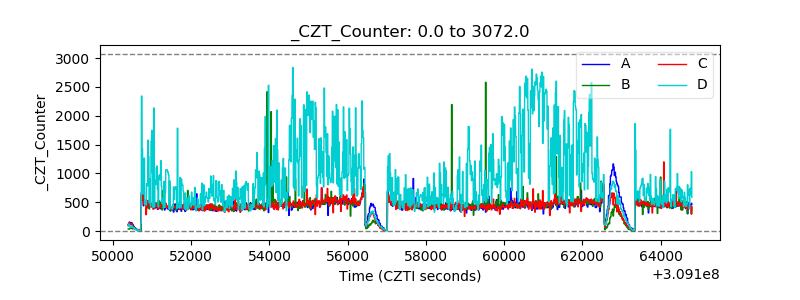 |
| +2.5 Volts monitor |  |
| +5 Volts monitor |  |
| _ROLL_ROT | 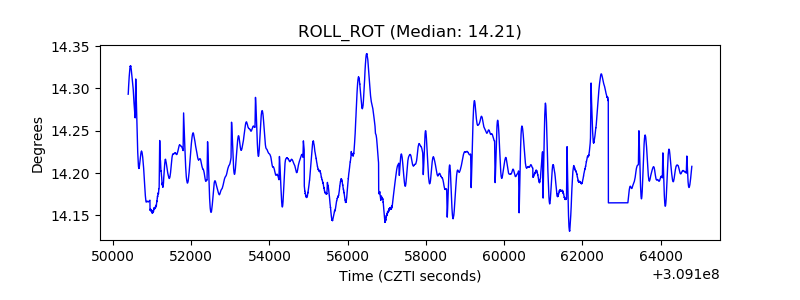 |
| _Roll_DEC | 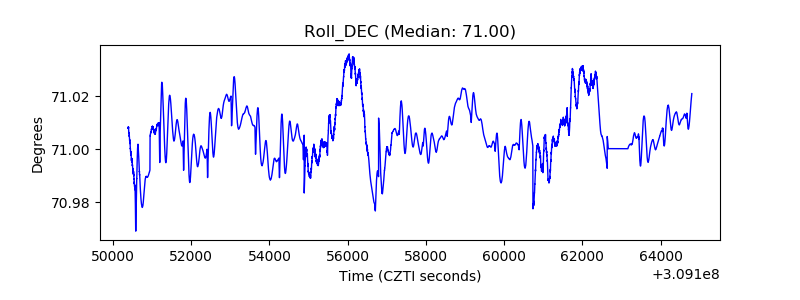 |
| _Roll_RA | 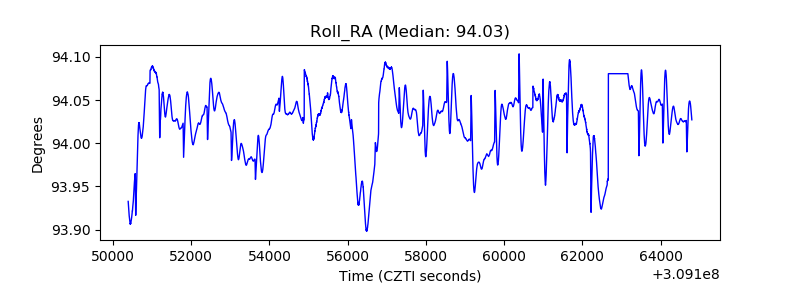 |
| Veto Counter | 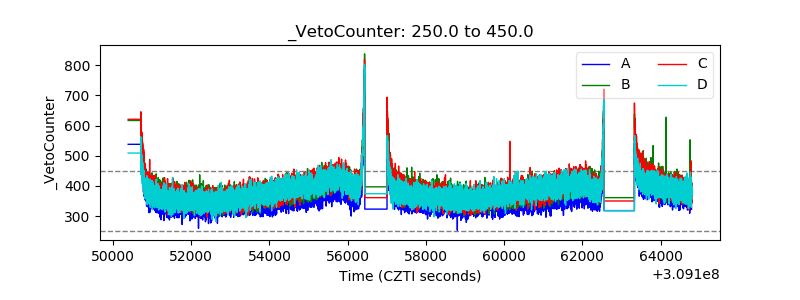 |