| Param | Original file | Final file |
|---|---|---|
| Filename | modeM0/AS1A07_100T03_9000003242_21938cztM0_level2.evt | modeM0/AS1A07_100T03_9000003242_21938cztM0_level2_quad_clean.evt |
| Size (bytes) | 537,575,040 | 122,941,440 |
| Size | 512.7 MB | 117.2 MB |
| Events in quadrant A | 3,030,957 | 840,854 |
| Events in quadrant B | 3,226,729 | 845,441 |
| Events in quadrant C | 3,108,686 | 815,986 |
| Events in quadrant D | 6,469,009 | 763,405 |
| Mode M0 | |||
|---|---|---|---|
| Quadrant | BADHDUFLAG | Total packets | Discarded packets |
| A | 0 | 13286 | 1 |
| B | 0 | 13777 | 2 |
| C | 0 | 13484 | 1 |
| D | 0 | 23746 | 1 |
| Mode SS | |||
|---|---|---|---|
| Quadrant | BADHDUFLAG | Total packets | Discarded packets |
| A | 0 | 132 | 0 |
| B | 0 | 132 | 0 |
| C | 0 | 132 | 0 |
| D | 0 | 132 | 0 |
| Mode M9 | |||
|---|---|---|---|
| Quadrant | BADHDUFLAG | Total packets | Discarded packets |
| A | 0 | 9 | 0 |
| B | 0 | 9 | 0 |
| C | 0 | 9 | 0 |
| D | 0 | 9 | 0 |
| Quadrant | Total seconds | Saturated seconds | Saturation percentage |
|---|---|---|---|
| A | 6561 | 36 | 0.548697% |
| B | 6561 | 79 | 1.204085% |
| C | 6561 | 57 | 0.868770% |
| D | 6561 | 702 | 10.699588% |
Noise dominated data is calculated using 1-second bins in cleaned event files. If a bin has >2000 counts, and if more than 50% of those come from <1% of pixels, then it is considered to be noise-dominated and hence unusable.
| Quadrant | # 1 sec bins | Bins with >0 counts | Bins with >2000 counts | High rate bins dominated by noise | Noise dominated (total time) | Noise dominated (detector-on time) | Marked lightcurve |
|---|---|---|---|---|---|---|---|
| A | 7496 | 6561 | 0 | 0 | 0.00% | 0.00% | 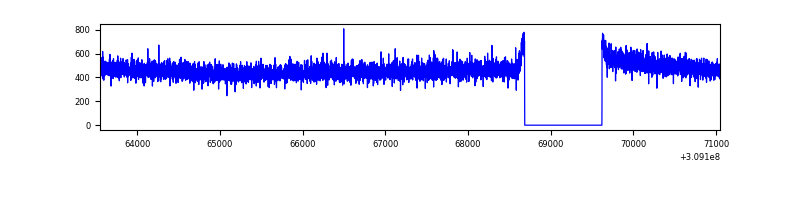 |
| B | 7496 | 6561 | 21 | 21 | 0.28% | 0.32% | 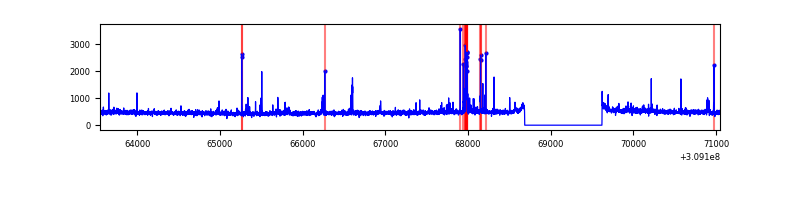 |
| C | 7496 | 6561 | 1 | 1 | 0.01% | 0.02% | 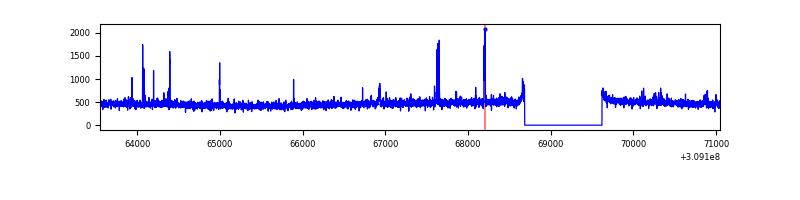 |
| D | 7496 | 6561 | 721 | 721 | 9.62% | 10.99% | 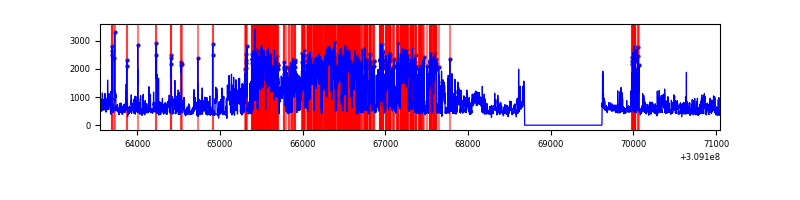 |
Top three noisy pixels from each quadrant. If the there are fewer than three noisy pixels in the level2.evt file, extra rows are filled as -1
| Pixel properties | Quadrant properties | ||||||
|---|---|---|---|---|---|---|---|
| Quadrant | DetID | PixID | Counts | Sigma | Mean | Median | Sigma |
| A | 13 | 254 | 11271 | 66.18 | 783 | 768 | 158.7 |
| A | 3 | 1 | 7679 | 43.55 | 783 | 768 | 158.7 |
| A | 0 | 226 | 6762 | 37.77 | 783 | 768 | 158.7 |
| B | 3 | 64 | 126367 | 856.79 | 773 | 754 | 146.6 |
| B | 0 | 190 | 18164 | 118.75 | 773 | 754 | 146.6 |
| B | 0 | 229 | 18021 | 117.78 | 773 | 754 | 146.6 |
| C | 14 | 238 | 118452 | 680.35 | 742 | 744 | 173.0 |
| C | 5 | 4 | 59441 | 339.27 | 742 | 744 | 173.0 |
| C | 10 | 22 | 39646 | 224.85 | 742 | 744 | 173.0 |
| D | 12 | 235 | 2284676 | 12846.99 | 734 | 711 | 177.8 |
| D | 7 | 238 | 785195 | 4412.61 | 734 | 711 | 177.8 |
| D | 1 | 52 | 386790 | 2171.64 | 734 | 711 | 177.8 |
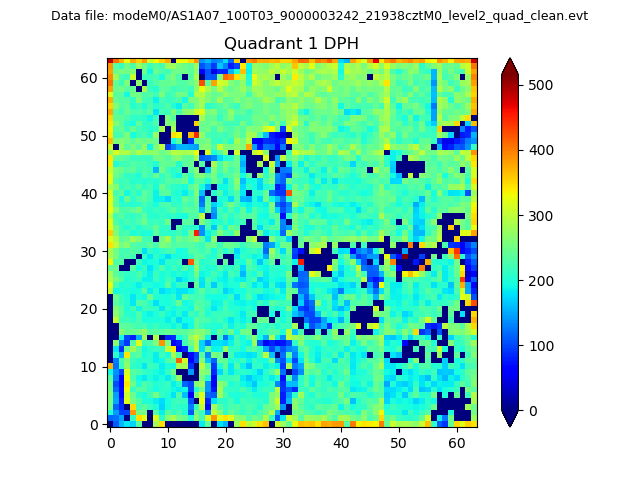
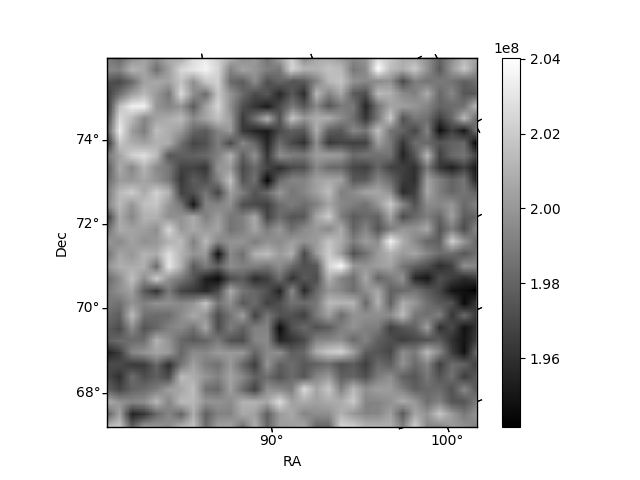
Histogram calculated using DETX and DETY for each event in the final _common_clean file
| Quadrant A |  |
 |
Quadrant B |
|---|---|---|---|
| Quadrant D | 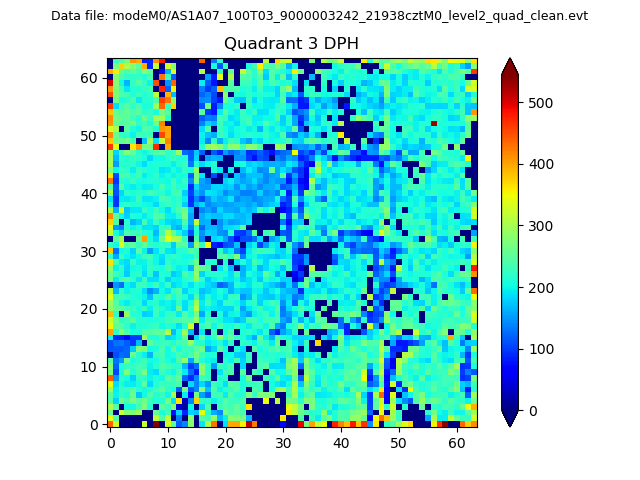 |
 |
Quadrant C |
| Plot type | Count rate plots | Images |
|---|---|---|
| Comparison with Poisson distribution Blue bars denote a histogram of data divided into 1 sec bins. Red curve is a Poisson curve with rate = median count rate of data. |
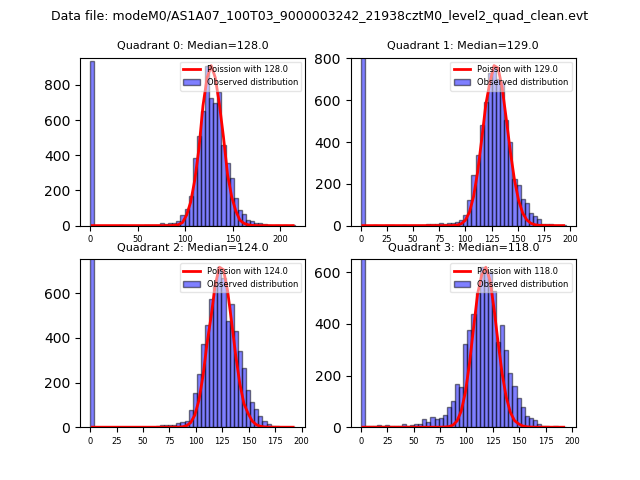 |
 |
| Quadrant-wise count rates Data is divided into 100 sec bins |
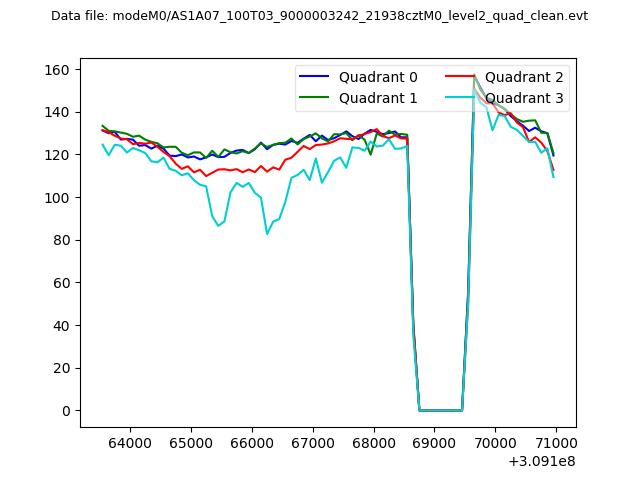 |
|
| Module-wise count rates for Quadrant A Data is divided into 100 sec bins |
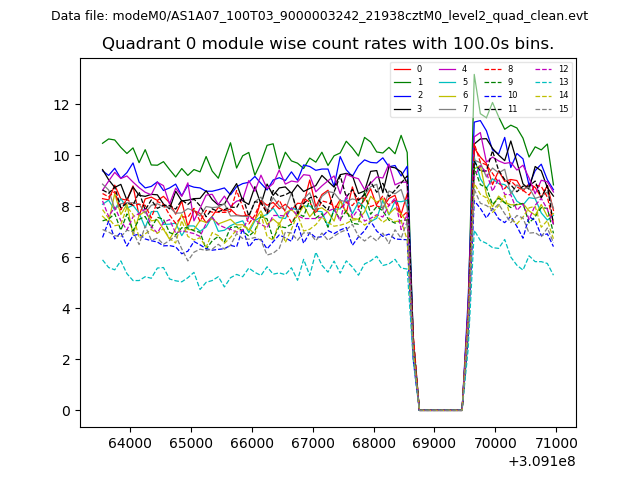 |
 |
| Module-wise count rates for Quadrant B Data is divided into 100 sec bins |
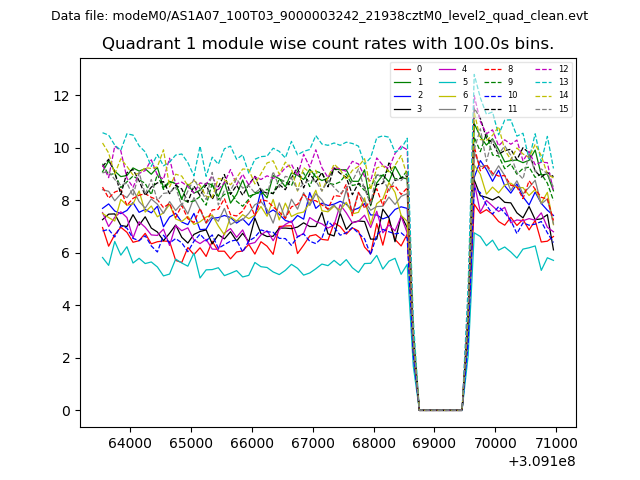 |
 |
| Module-wise count rates for Quadrant C Data is divided into 100 sec bins |
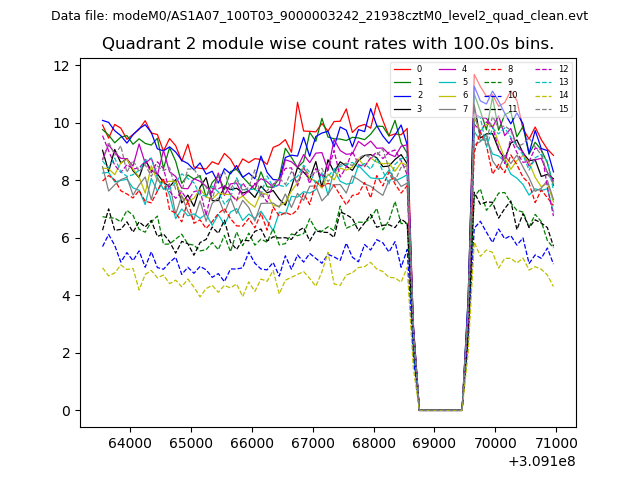 |
 |
| Module-wise count rates for Quadrant D Data is divided into 100 sec bins |
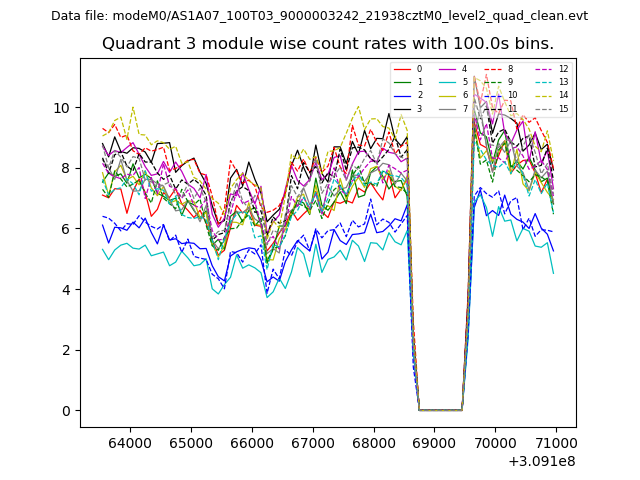 |
 |
| Parameter | Plot |
|---|---|
| CZT HV Monitor | 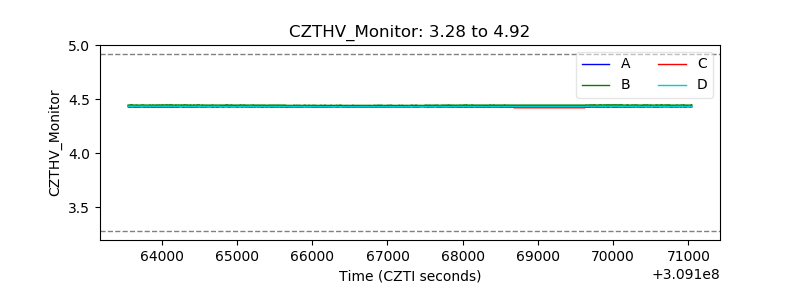 |
| D_VDD | 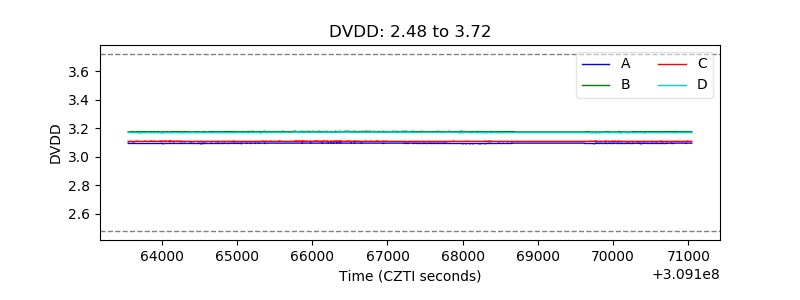 |
| Temperature 1 | 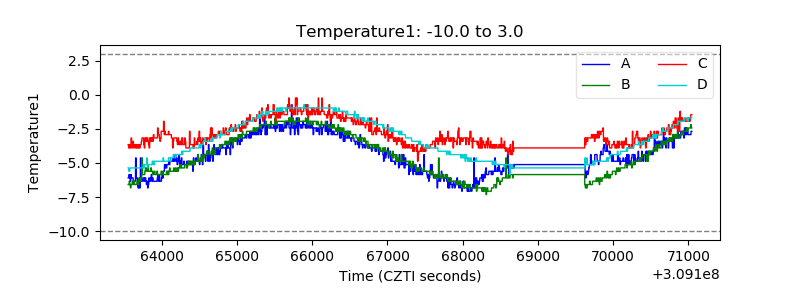 |
| Veto HV Monitor | 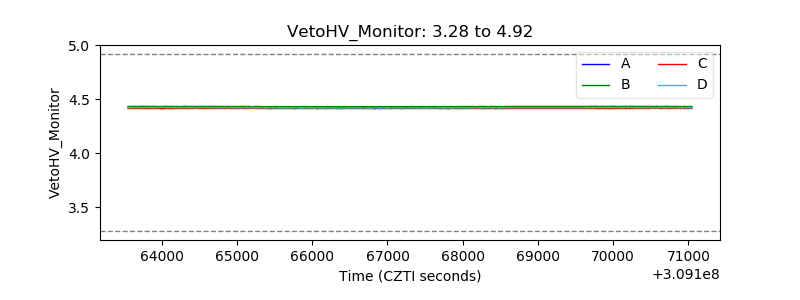 |
| Veto LLD | 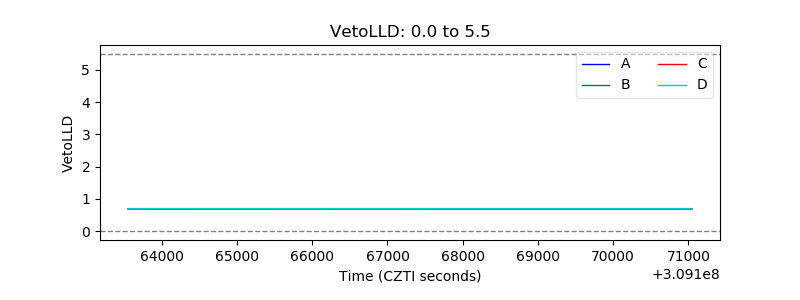 |
| Alpha Counter | 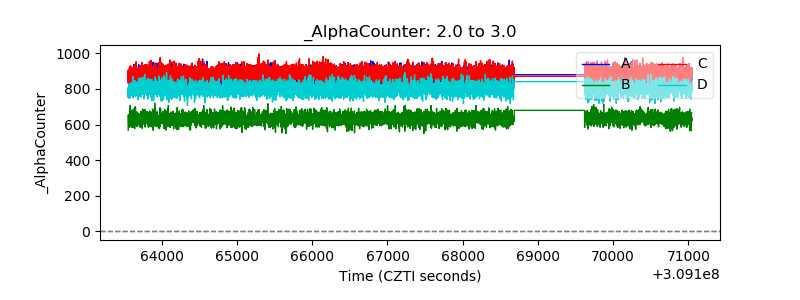 |
| _CPM_Rate | 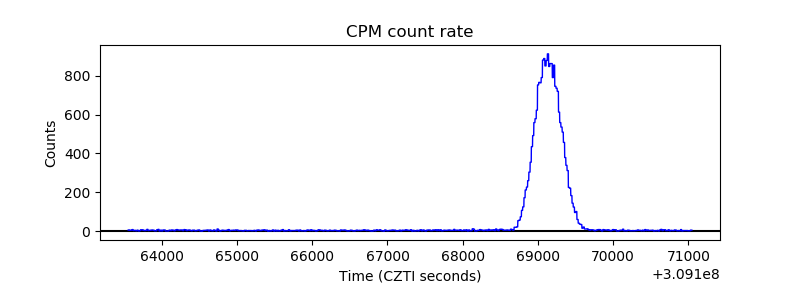 |
| CZT Counter | 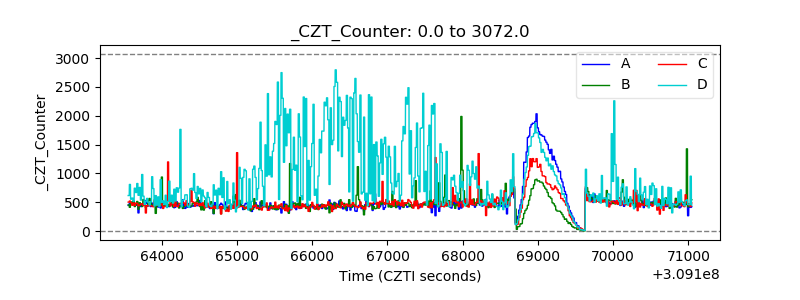 |
| +2.5 Volts monitor |  |
| +5 Volts monitor |  |
| _ROLL_ROT | 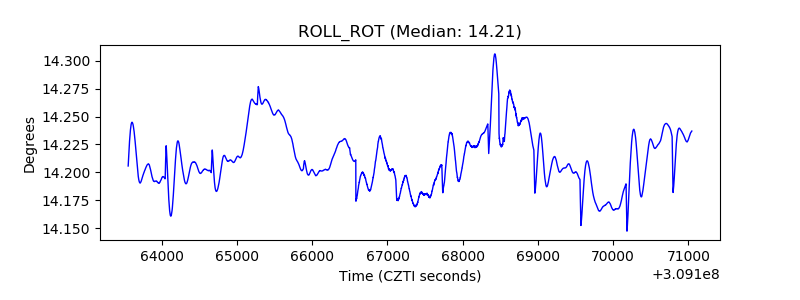 |
| _Roll_DEC | 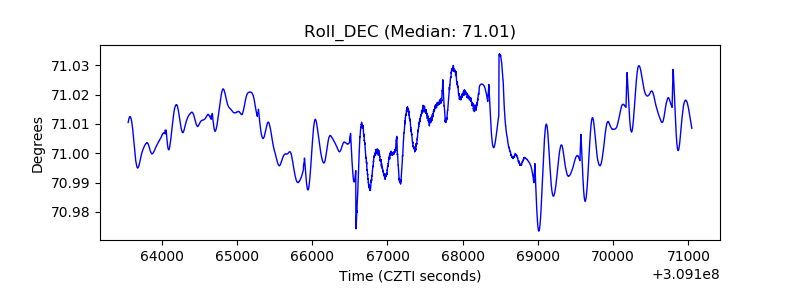 |
| _Roll_RA | 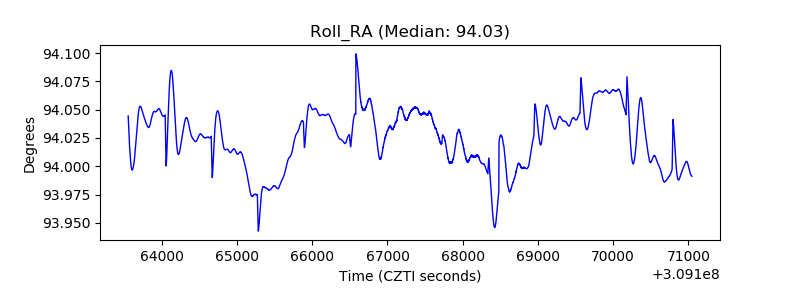 |
| Veto Counter | 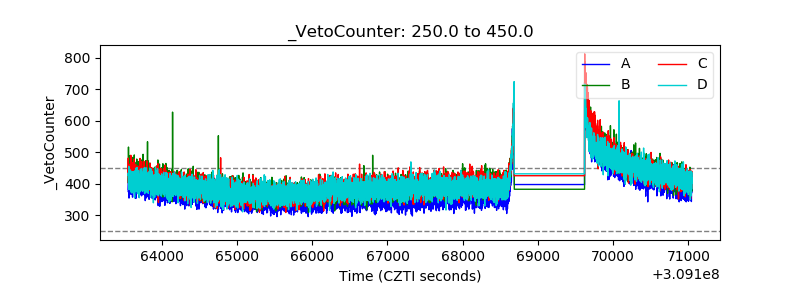 |