| Param | Original file | Final file |
|---|---|---|
| Filename | modeM0/AS1A07_100T03_9000003242_21939cztM0_level2.evt | modeM0/AS1A07_100T03_9000003242_21939cztM0_level2_quad_clean.evt |
| Size (bytes) | 216,792,000 | 53,167,680 |
| Size | 206.7 MB | 50.7 MB |
| Events in quadrant A | 1,293,080 | 366,274 |
| Events in quadrant B | 1,346,434 | 364,883 |
| Events in quadrant C | 1,282,611 | 343,790 |
| Events in quadrant D | 2,447,862 | 331,371 |
| Mode M0 | |||
|---|---|---|---|
| Quadrant | BADHDUFLAG | Total packets | Discarded packets |
| A | 0 | 5709 | 0 |
| B | 0 | 5860 | 0 |
| C | 0 | 5748 | 0 |
| D | 0 | 9231 | 0 |
| Mode SS | |||
|---|---|---|---|
| Quadrant | BADHDUFLAG | Total packets | Discarded packets |
| A | 0 | 58 | 0 |
| B | 0 | 58 | 0 |
| C | 0 | 58 | 0 |
| D | 0 | 58 | 0 |
| Quadrant | Total seconds | Saturated seconds | Saturation percentage |
|---|---|---|---|
| A | 2847 | 0 | 0.000000% |
| B | 2848 | 11 | 0.386236% |
| C | 2848 | 9 | 0.316011% |
| D | 2848 | 132 | 4.634831% |
Noise dominated data is calculated using 1-second bins in cleaned event files. If a bin has >2000 counts, and if more than 50% of those come from <1% of pixels, then it is considered to be noise-dominated and hence unusable.
| Quadrant | # 1 sec bins | Bins with >0 counts | Bins with >2000 counts | High rate bins dominated by noise | Noise dominated (total time) | Noise dominated (detector-on time) | Marked lightcurve |
|---|---|---|---|---|---|---|---|
| A | 2847 | 2847 | 0 | 0 | 0.00% | 0.00% | 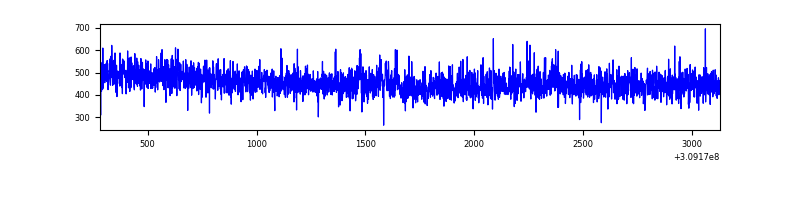 |
| B | 2848 | 2848 | 7 | 7 | 0.25% | 0.25% | 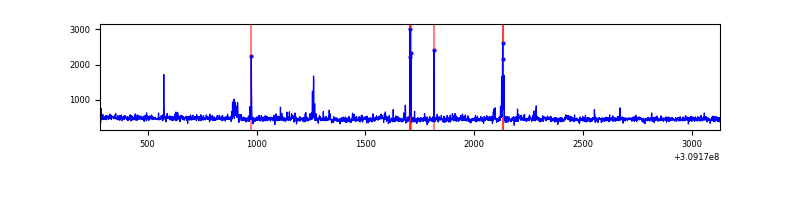 |
| C | 2848 | 2848 | 0 | 0 | 0.00% | 0.00% | 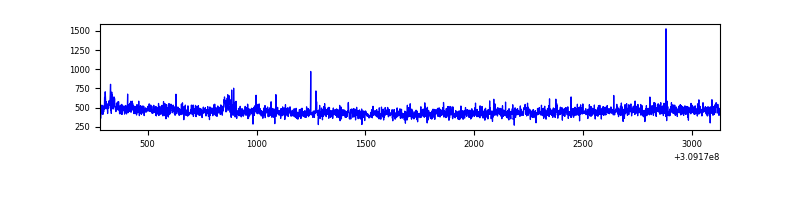 |
| D | 2848 | 2848 | 114 | 114 | 4.00% | 4.00% | 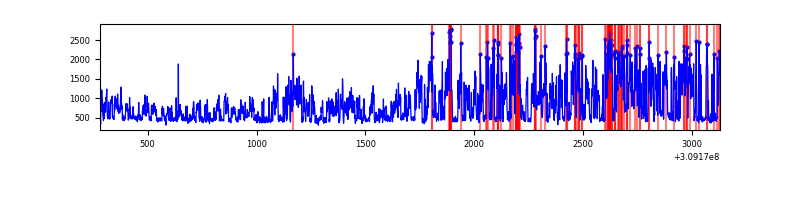 |
Top three noisy pixels from each quadrant. If the there are fewer than three noisy pixels in the level2.evt file, extra rows are filled as -1
| Pixel properties | Quadrant properties | ||||||
|---|---|---|---|---|---|---|---|
| Quadrant | DetID | PixID | Counts | Sigma | Mean | Median | Sigma |
| A | 3 | 1 | 10147 | 143.91 | 332 | 326 | 68.2 |
| A | 13 | 254 | 5371 | 73.93 | 332 | 326 | 68.2 |
| A | 0 | 226 | 3038 | 39.74 | 332 | 326 | 68.2 |
| B | 3 | 64 | 37713 | 593.49 | 325 | 317 | 63.0 |
| B | 0 | 197 | 15066 | 234.07 | 325 | 317 | 63.0 |
| B | 0 | 190 | 10234 | 157.39 | 325 | 317 | 63.0 |
| C | 14 | 238 | 50510 | 680.54 | 311 | 311 | 73.8 |
| C | 10 | 22 | 16597 | 220.79 | 311 | 311 | 73.8 |
| C | 13 | 61 | 2162 | 25.09 | 311 | 311 | 73.8 |
| D | 12 | 235 | 929233 | 11769.82 | 318 | 307 | 78.9 |
| D | 1 | 52 | 198709 | 2513.82 | 318 | 307 | 78.9 |
| D | 13 | 104 | 49273 | 620.42 | 318 | 307 | 78.9 |
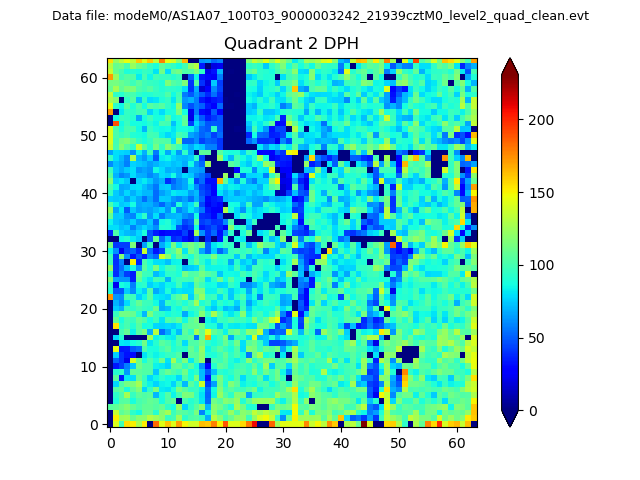
Histogram calculated using DETX and DETY for each event in the final _common_clean file
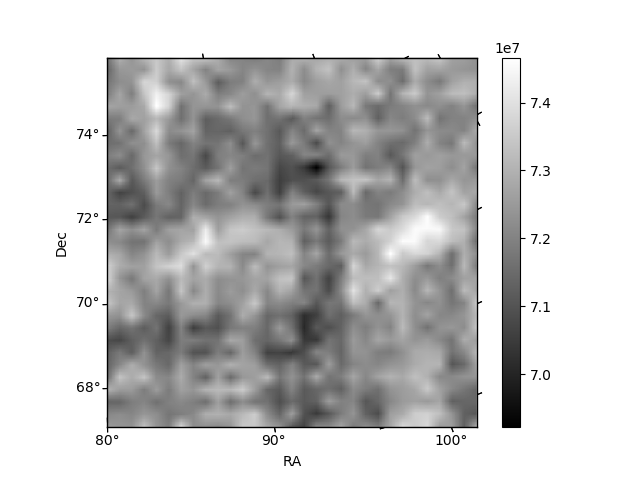
| Quadrant A | 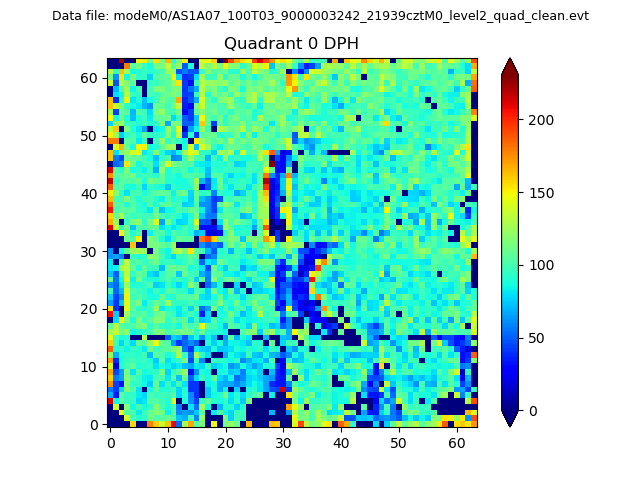 |
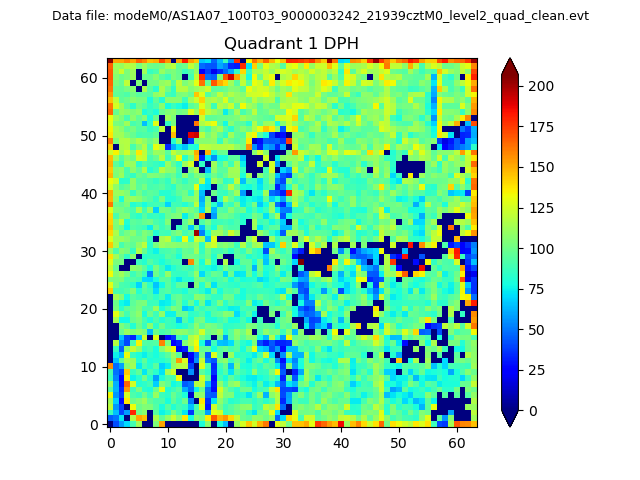 |
Quadrant B |
|---|---|---|---|
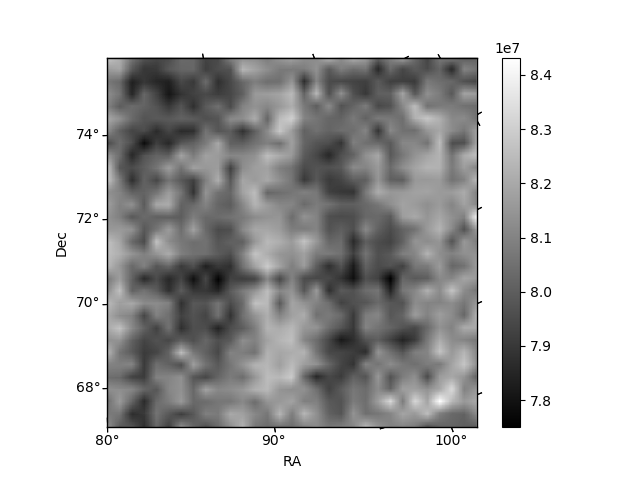
| Quadrant D | 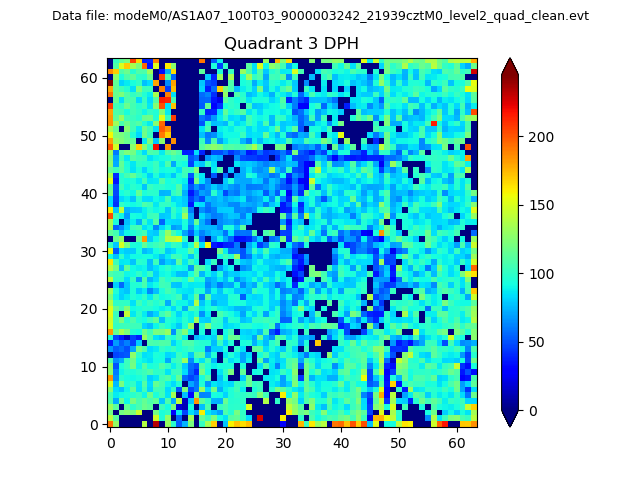 |
 |
Quadrant C |
| Plot type | Count rate plots | Images |
|---|---|---|
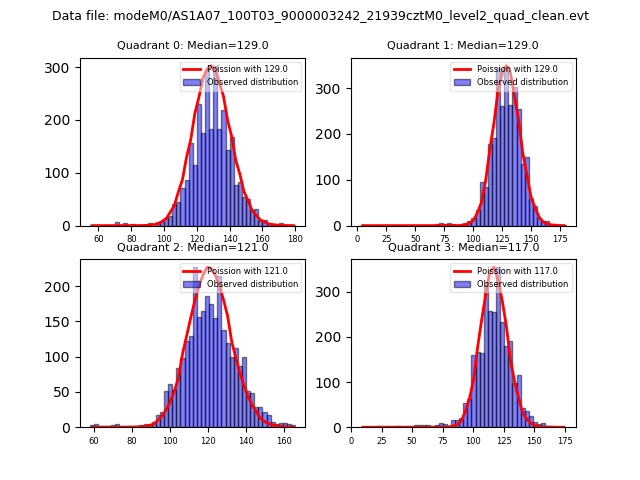
| Comparison with Poisson distribution Blue bars denote a histogram of data divided into 1 sec bins. Red curve is a Poisson curve with rate = median count rate of data. |
 |
 |
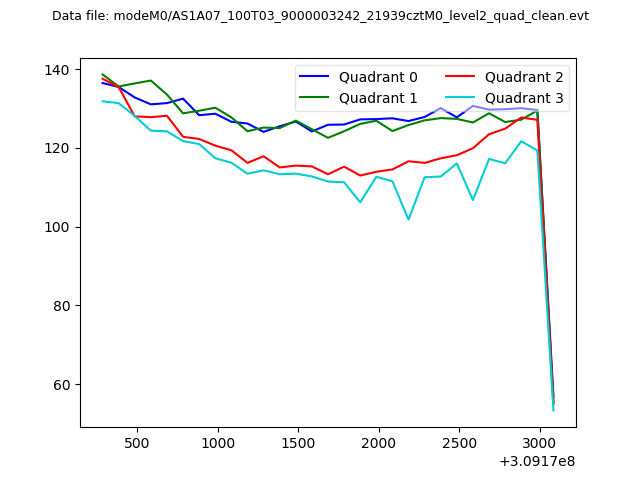
| Quadrant-wise count rates Data is divided into 100 sec bins |
 |
|
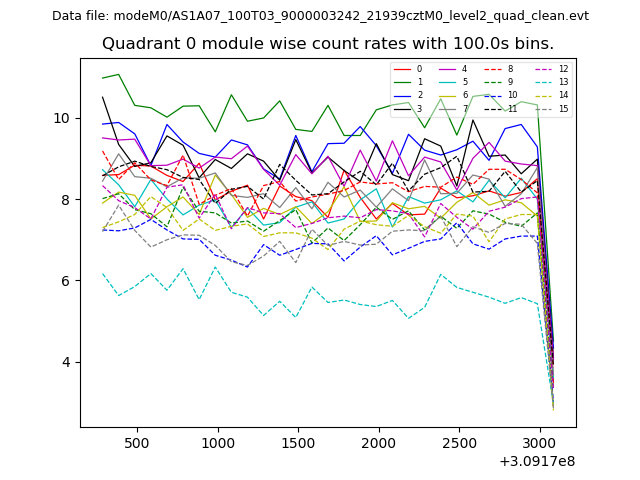
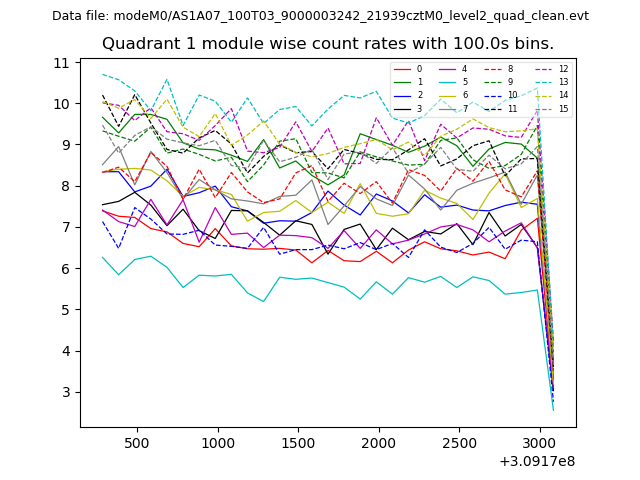
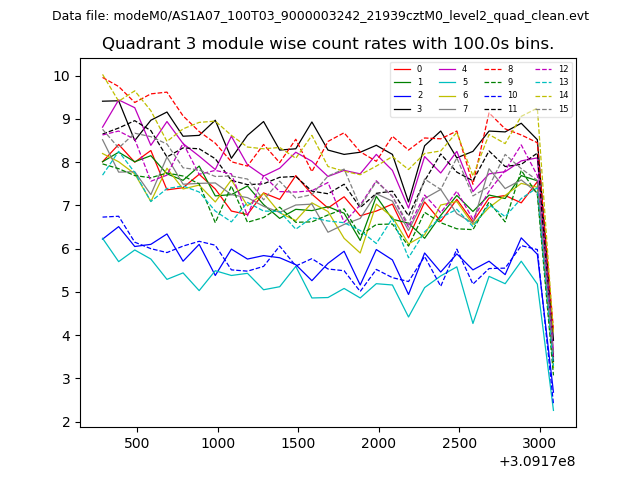
| Module-wise count rates for Quadrant A Data is divided into 100 sec bins |
 |
 |
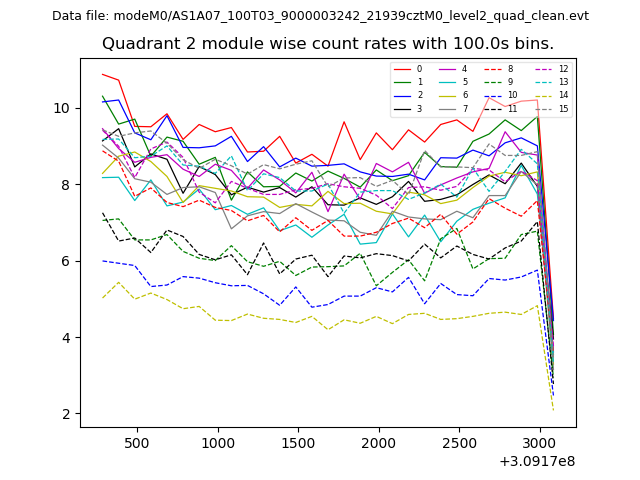
| Module-wise count rates for Quadrant B Data is divided into 100 sec bins |
 |
 |
| Module-wise count rates for Quadrant C Data is divided into 100 sec bins |
 |
 |
| Module-wise count rates for Quadrant D Data is divided into 100 sec bins |
 |
 |
| Parameter | Plot |
|---|---|
| CZT HV Monitor | 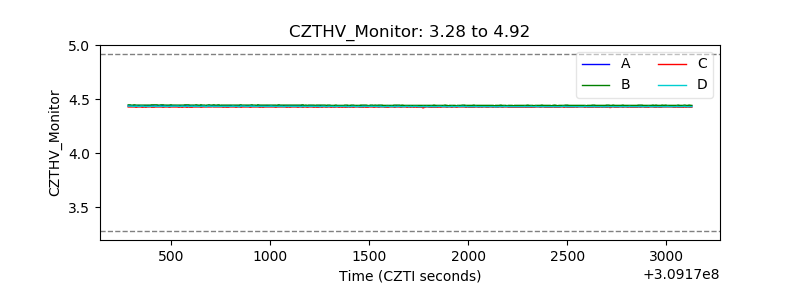 |
| D_VDD | 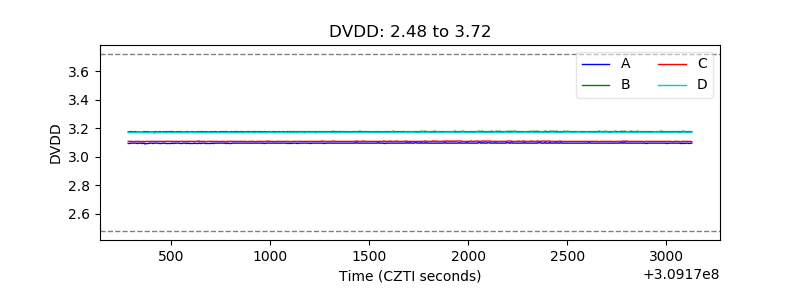 |
| Temperature 1 |  |
| Veto HV Monitor | 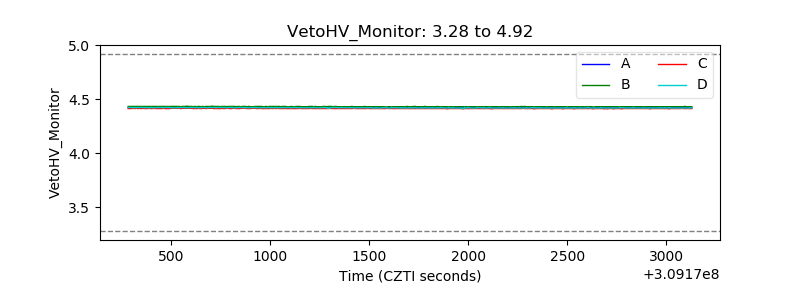 |
| Veto LLD | 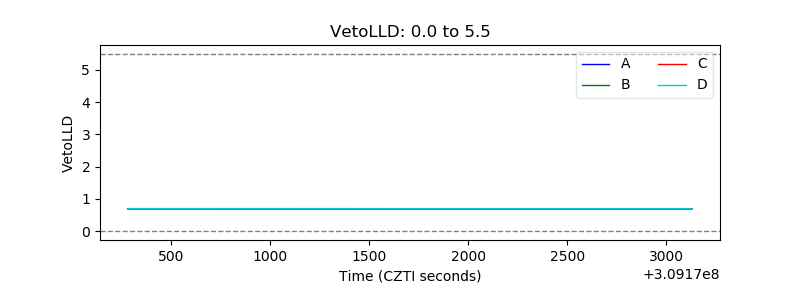 |
| Alpha Counter | 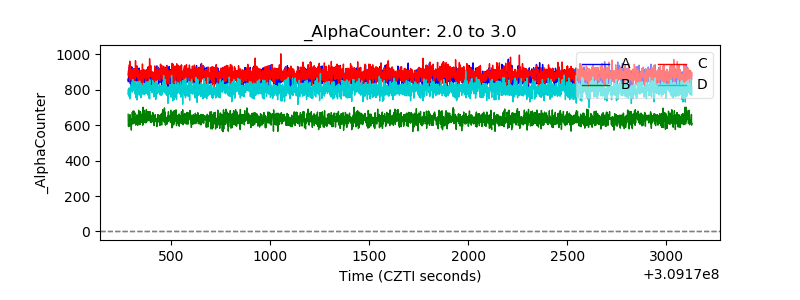 |
| _CPM_Rate | 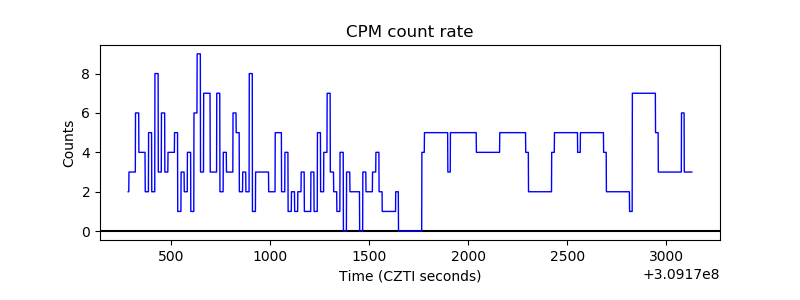 |
| CZT Counter | 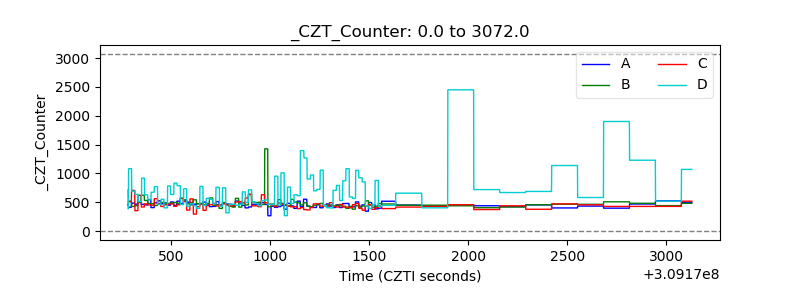 |
| +2.5 Volts monitor |  |
| +5 Volts monitor | 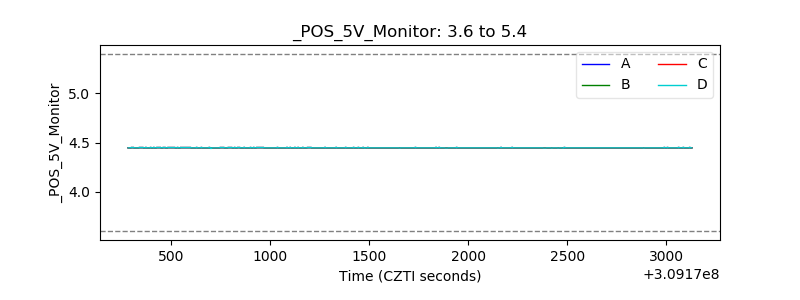 |
| _ROLL_ROT | 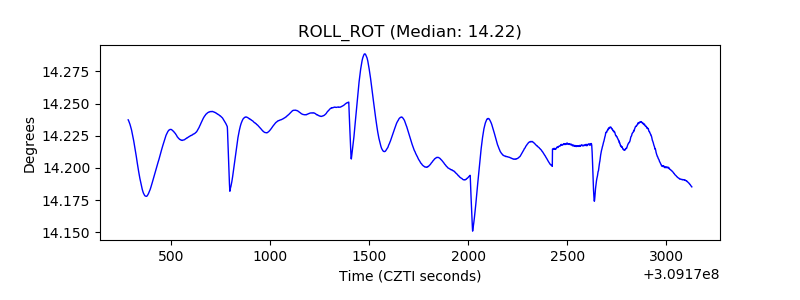 |
| _Roll_DEC | 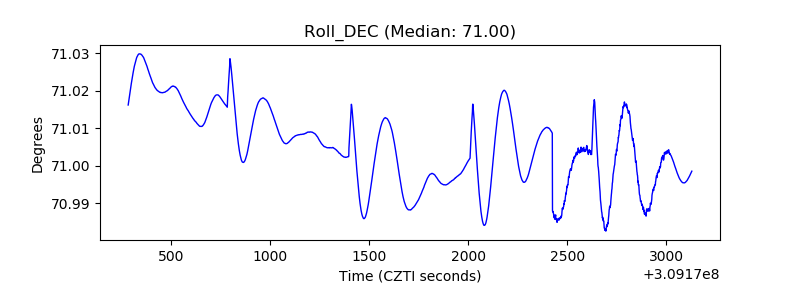 |
| _Roll_RA | 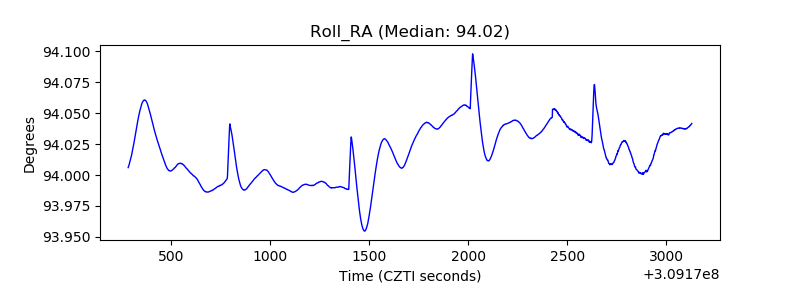 |
| Veto Counter | 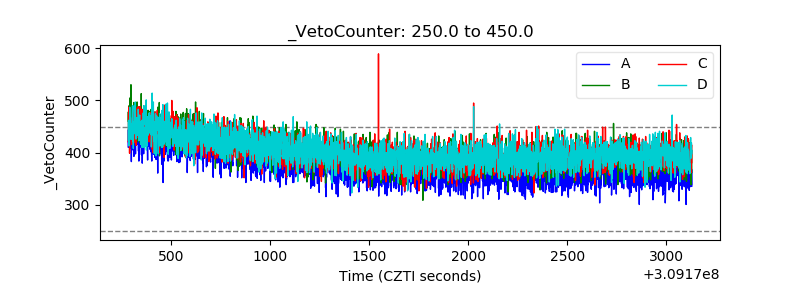 |