| Param | Original file | Final file |
|---|---|---|
| Filename | modeM0/AS1A07_007T02_9000003244cztM0_level2.fits | modeM0/AS1A07_007T02_9000003244cztM0_level2_quad_clean.evt |
| Size (bytes) | 1,021,553,280 | 820,563,840 |
| Size | 974.2 MB | 782.6 MB |
| Events in quadrant A | 6,404,060 | 4,703,590 |
| Events in quadrant B | 6,070,836 | 4,710,636 |
| Events in quadrant C | 6,251,206 | 4,549,504 |
| Events in quadrant D | 5,475,512 | 4,147,740 |
| Mode M0 | |||
|---|---|---|---|
| Quadrant | BADHDUFLAG | Total packets | Discarded packets |
| A | 0 | 211103 | 0 |
| B | 0 | 218457 | 0 |
| C | 0 | 208584 | 0 |
| D | 0 | 225752 | 0 |
| Mode M9 | |||
|---|---|---|---|
| Quadrant | BADHDUFLAG | Total packets | Discarded packets |
| A | 0 | 186 | 0 |
| B | 0 | 186 | 0 |
| C | 0 | 186 | 0 |
| D | 0 | 186 | 0 |
| Mode SS | |||
|---|---|---|---|
| Quadrant | BADHDUFLAG | Total packets | Discarded packets |
| A | 0 | 2008 | 0 |
| B | 0 | 2008 | 0 |
| C | 0 | 2008 | 0 |
| D | 0 | 2008 | 0 |
| Quadrant | Total seconds | Saturated seconds | Saturation percentage |
|---|---|---|---|
| A | 98289 | 1170 | 1.190367% |
| B | 98289 | 2077 | 2.113156% |
| C | 98289 | 1657 | 1.685845% |
| D | 98289 | 2157 | 2.194549% |
Noise dominated data is calculated using 1-second bins in cleaned event files. If a bin has >2000 counts, and if more than 50% of those come from <1% of pixels, then it is considered to be noise-dominated and hence unusable.
| Quadrant | # 1 sec bins | Bins with >0 counts | Bins with >2000 counts | High rate bins dominated by noise | Noise dominated (total time) | Noise dominated (detector-on time) | Marked lightcurve |
|---|---|---|---|---|---|---|---|
| A | 116890 | 98272 | 0 | 0 | 0.00% | 0.00% | 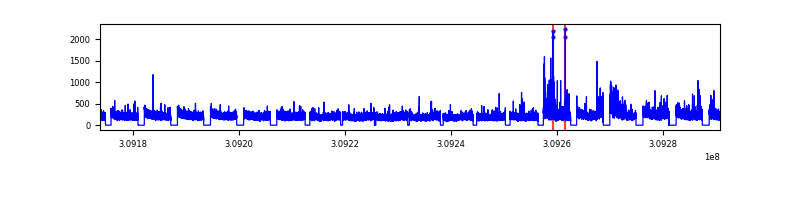 |
| B | 116889 | 98255 | 0 | 0 | 0.00% | 0.00% |  |
| C | 116890 | 98272 | 0 | 0 | 0.00% | 0.00% |  |
| D | 116890 | 98237 | 0 | 0 | 0.00% | 0.00% | 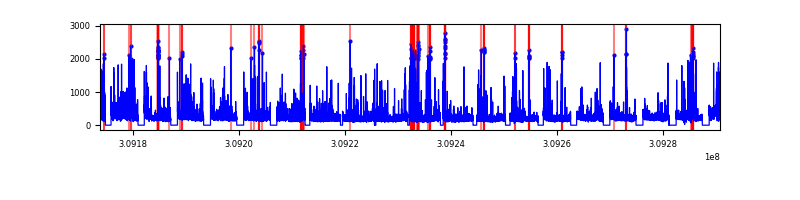 |
Top three noisy pixels from each quadrant. If the there are fewer than three noisy pixels in the level2.evt file, extra rows are filled as -1
| Pixel properties | Quadrant properties | ||||||
|---|---|---|---|---|---|---|---|
| Quadrant | DetID | PixID | Counts | Sigma | Mean | Median | Sigma |
| A | 0 | 29 | 5986 | 10.86 | 1667 | 1566 | 406.9 |
| A | 7 | 110 | 4964 | 8.35 | 1667 | 1566 | 406.9 |
| A | 9 | 19 | 4738 | 7.79 | 1667 | 1566 | 406.9 |
| B | 2 | 9 | 4820 | 10.44 | 1602 | 1530 | 315.0 |
| B | 2 | 8 | 4106 | 8.18 | 1602 | 1530 | 315.0 |
| B | 5 | 128 | 4017 | 7.9 | 1602 | 1530 | 315.0 |
| C | 1 | 80 | 4739 | 7.61 | 1648 | 1550 | 419.0 |
| C | 1 | 81 | 4698 | 7.51 | 1648 | 1550 | 419.0 |
| C | 3 | 234 | 4365 | 6.72 | 1648 | 1550 | 419.0 |
| D | 10 | 189 | 3973 | 6.24 | 1563 | 1431 | 407.3 |
| D | 3 | 14 | 3878 | 6.01 | 1563 | 1431 | 407.3 |
| D | 6 | 231 | 3840 | 5.91 | 1563 | 1431 | 407.3 |
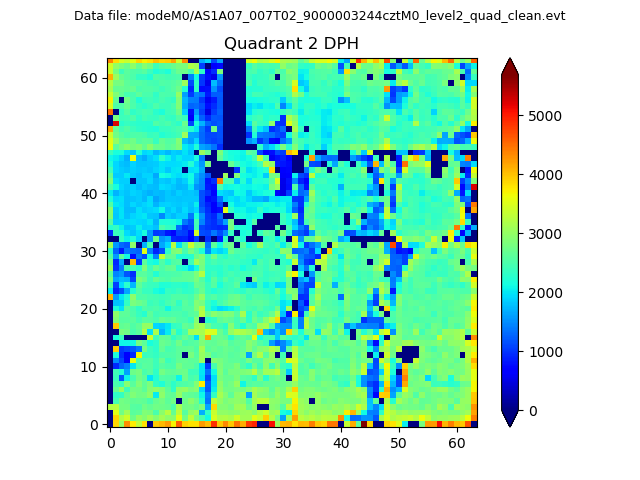
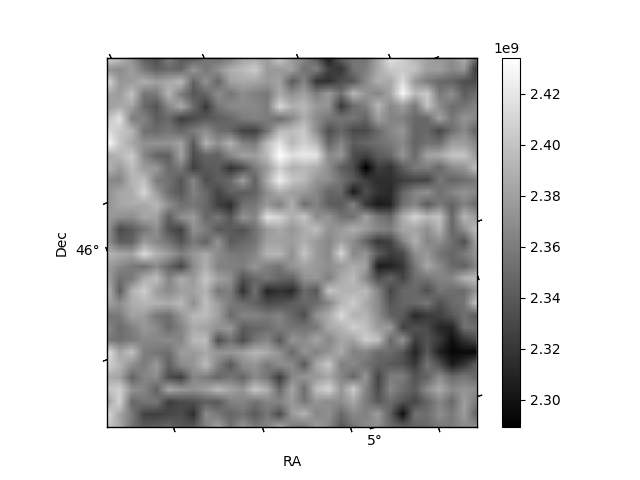
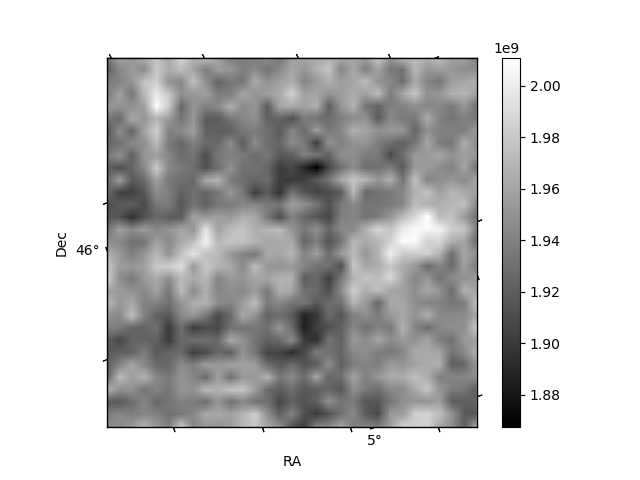
Histogram calculated using DETX and DETY for each event in the final _common_clean file
| Quadrant A | 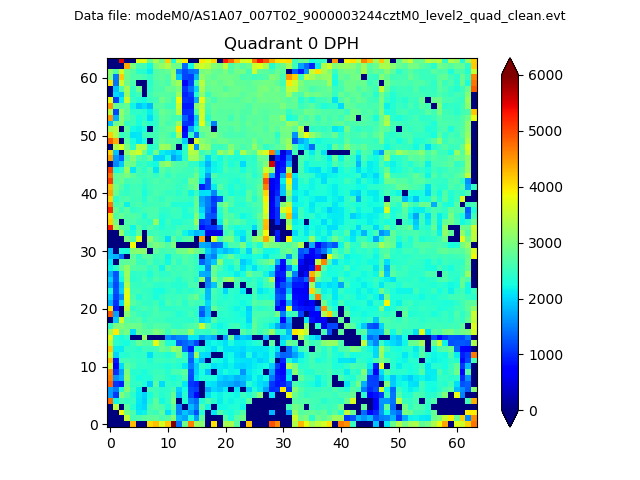 |
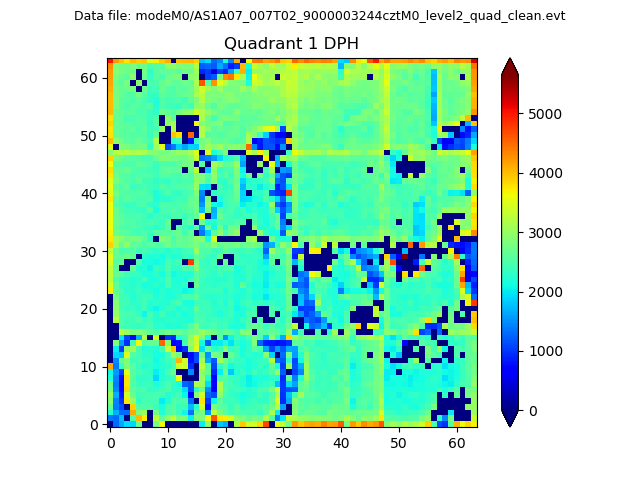 |
Quadrant B |
|---|---|---|---|
| Quadrant D |  |
 |
Quadrant C |
| Plot type | Count rate plots | Images |
|---|---|---|
| Comparison with Poisson distribution Blue bars denote a histogram of data divided into 1 sec bins. Red curve is a Poisson curve with rate = median count rate of data. |
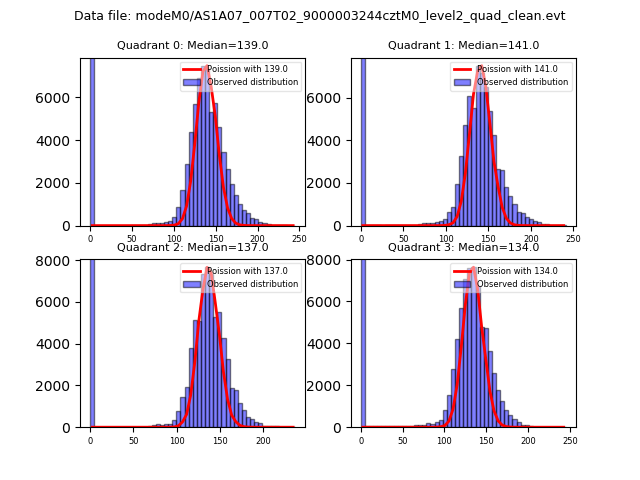 |
 |
| Quadrant-wise count rates Data is divided into 100 sec bins |
 |
|
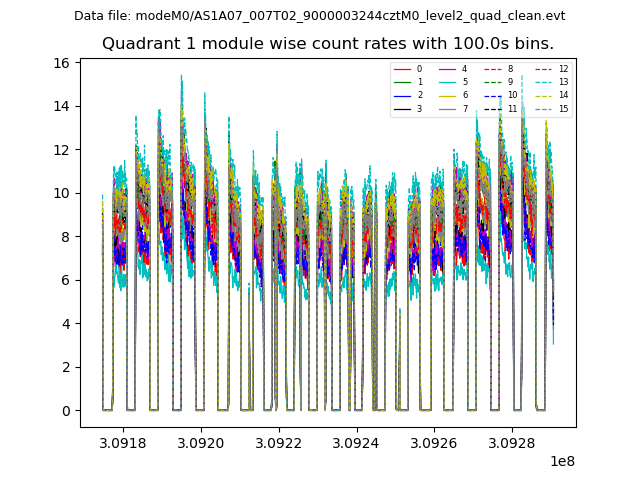
| Module-wise count rates for Quadrant A Data is divided into 100 sec bins |
 |
 |
| Module-wise count rates for Quadrant B Data is divided into 100 sec bins |
 |
 |
| Module-wise count rates for Quadrant C Data is divided into 100 sec bins |
 |
 |
| Module-wise count rates for Quadrant D Data is divided into 100 sec bins |
 |
 |
| Parameter | Plot |
|---|---|
| CZT HV Monitor | 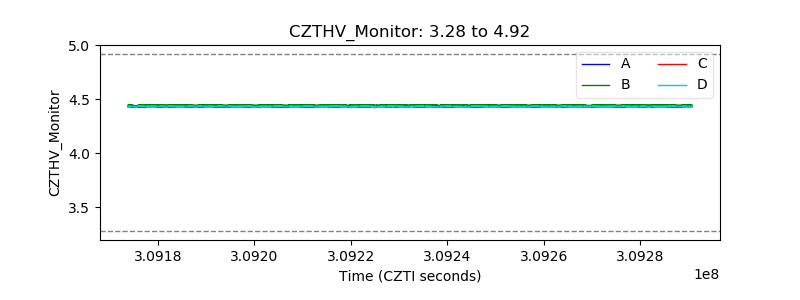 |
| D_VDD | 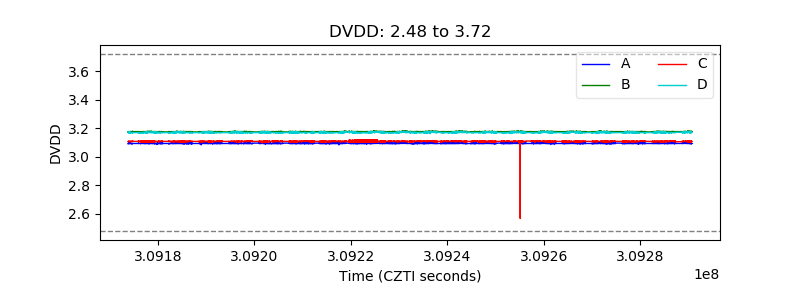 |
| Temperature 1 |  |
| Veto HV Monitor | 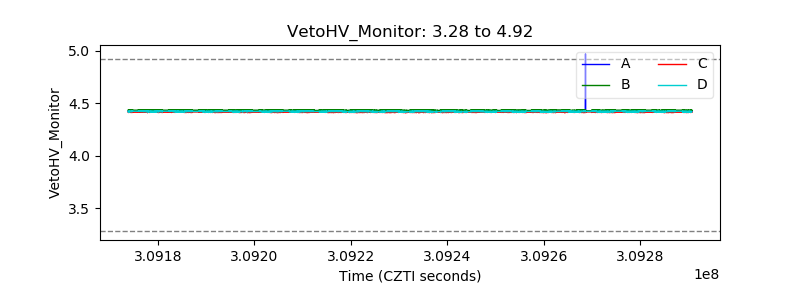 |
| Veto LLD | 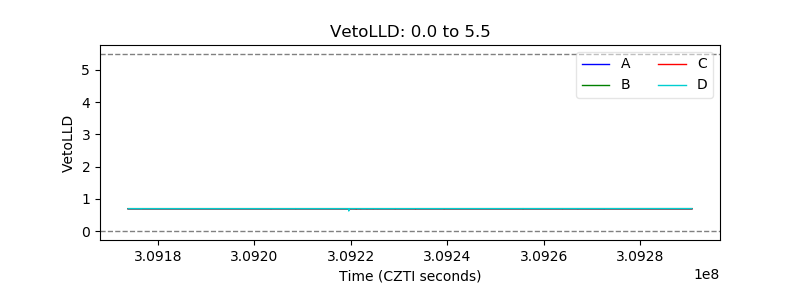 |
| Alpha Counter |  |
| _CPM_Rate | 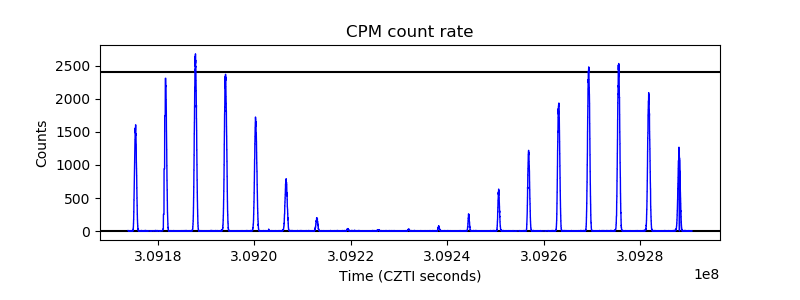 |
| CZT Counter | 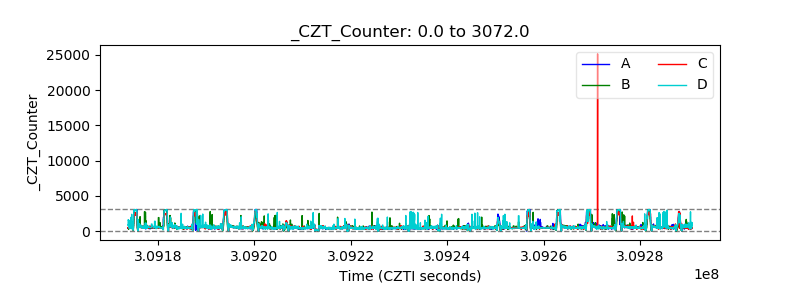 |
| +2.5 Volts monitor |  |
| +5 Volts monitor |  |
| _ROLL_ROT |  |
| _Roll_DEC | 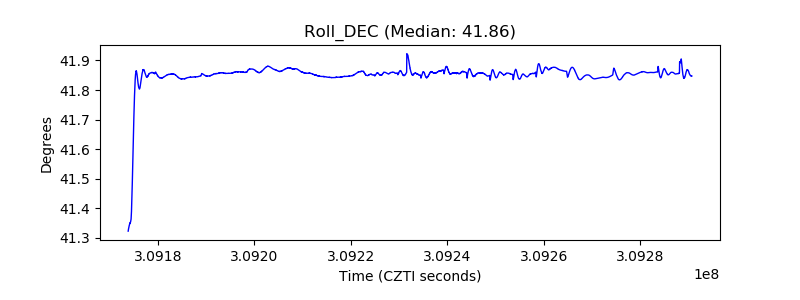 |
| _Roll_RA |  |
| Veto Counter |  |