| Param | Original file | Final file |
|---|---|---|
| Filename | modeM0/AS1A07_007T02_9000003244_21939cztM0_level2.evt | modeM0/AS1A07_007T02_9000003244_21939cztM0_level2_quad_clean.evt |
| Size (bytes) | 189,181,440 | 20,753,280 |
| Size | 180.4 MB | 19.8 MB |
| Events in quadrant A | 1,252,606 | 115,760 |
| Events in quadrant B | 1,343,013 | 117,222 |
| Events in quadrant C | 1,247,578 | 116,040 |
| Events in quadrant D | 1,726,338 | 111,150 |
| Mode M0 | |||
|---|---|---|---|
| Quadrant | BADHDUFLAG | Total packets | Discarded packets |
| A | 0 | 5233 | 1 |
| B | 0 | 5497 | 8 |
| C | 0 | 5154 | 1 |
| D | 0 | 6839 | 1 |
| Mode M9 | |||
|---|---|---|---|
| Quadrant | BADHDUFLAG | Total packets | Discarded packets |
| A | 0 | 11 | 0 |
| B | 0 | 11 | 0 |
| C | 0 | 11 | 0 |
| D | 0 | 11 | 0 |
| Mode SS | |||
|---|---|---|---|
| Quadrant | BADHDUFLAG | Total packets | Discarded packets |
| A | 0 | 48 | 0 |
| B | 0 | 48 | 0 |
| C | 0 | 48 | 0 |
| D | 0 | 48 | 0 |
| Quadrant | Total seconds | Saturated seconds | Saturation percentage |
|---|---|---|---|
| A | 2326 | 64 | 2.751505% |
| B | 2325 | 78 | 3.354839% |
| C | 2325 | 71 | 3.053763% |
| D | 2325 | 74 | 3.182796% |
Noise dominated data is calculated using 1-second bins in cleaned event files. If a bin has >2000 counts, and if more than 50% of those come from <1% of pixels, then it is considered to be noise-dominated and hence unusable.
| Quadrant | # 1 sec bins | Bins with >0 counts | Bins with >2000 counts | High rate bins dominated by noise | Noise dominated (total time) | Noise dominated (detector-on time) | Marked lightcurve |
|---|---|---|---|---|---|---|---|
| A | 3396 | 2326 | 0 | 0 | 0.00% | 0.00% | 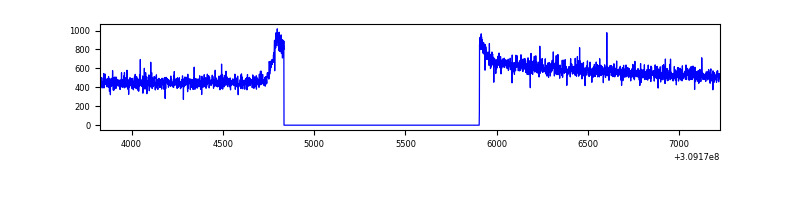 |
| B | 3394 | 2324 | 12 | 12 | 0.35% | 0.52% | 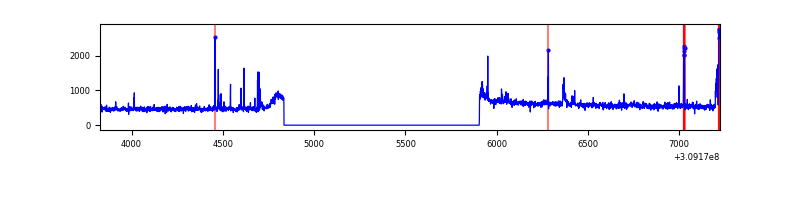 |
| C | 3395 | 2325 | 0 | 0 | 0.00% | 0.00% | 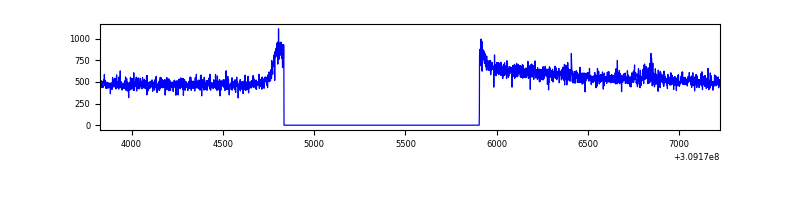 |
| D | 3395 | 2325 | 11 | 11 | 0.32% | 0.47% | 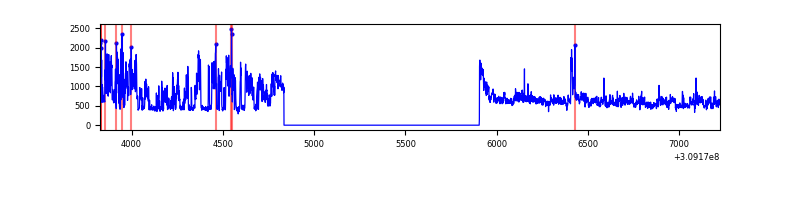 |
Top three noisy pixels from each quadrant. If the there are fewer than three noisy pixels in the level2.evt file, extra rows are filled as -1
| Pixel properties | Quadrant properties | ||||||
|---|---|---|---|---|---|---|---|
| Quadrant | DetID | PixID | Counts | Sigma | Mean | Median | Sigma |
| A | 13 | 254 | 3425 | 46.53 | 325 | 318 | 66.8 |
| A | 0 | 226 | 2771 | 36.74 | 325 | 318 | 66.8 |
| A | 3 | 137 | 2614 | 34.38 | 325 | 318 | 66.8 |
| B | 3 | 64 | 79267 | 1254.23 | 320 | 313 | 63.0 |
| B | 0 | 229 | 8158 | 124.62 | 320 | 313 | 63.0 |
| B | 12 | 111 | 7716 | 117.6 | 320 | 313 | 63.0 |
| C | 14 | 238 | 48950 | 669.35 | 305 | 308 | 72.7 |
| C | 10 | 22 | 7163 | 94.33 | 305 | 308 | 72.7 |
| C | 13 | 61 | 2155 | 25.42 | 305 | 308 | 72.7 |
| D | 12 | 235 | 411603 | 5389.5 | 308 | 299 | 76.3 |
| D | 1 | 52 | 110587 | 1445.15 | 308 | 299 | 76.3 |
| D | 11 | 176 | 30693 | 398.27 | 308 | 299 | 76.3 |
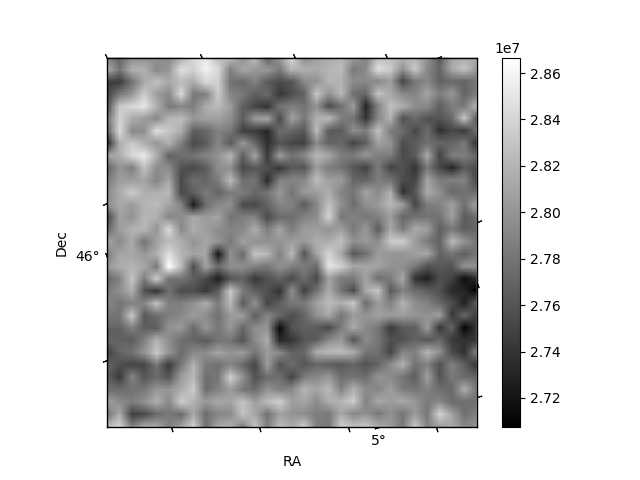
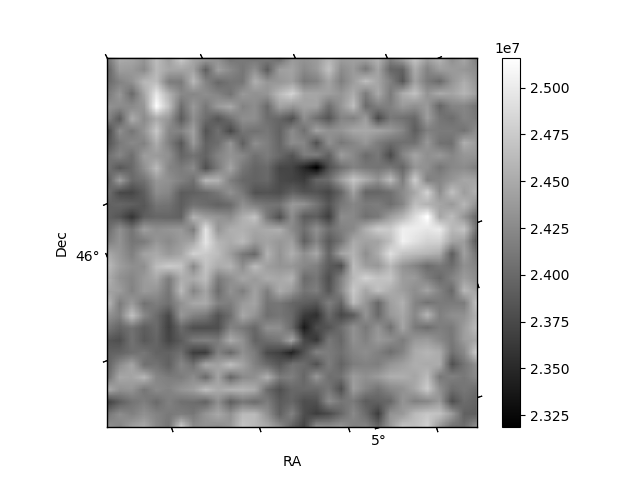
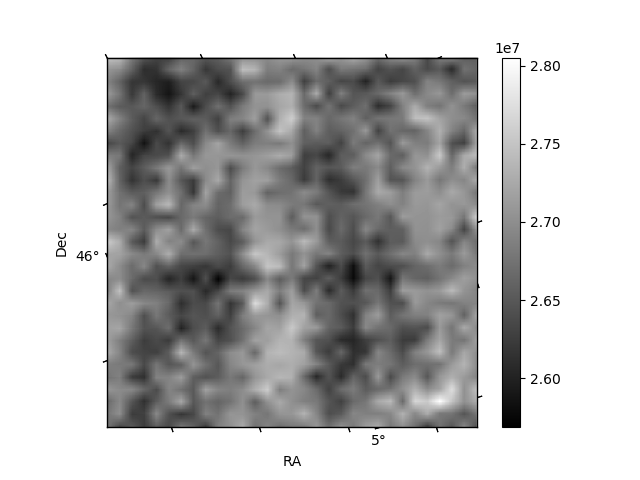
Histogram calculated using DETX and DETY for each event in the final _common_clean file
| Quadrant A | 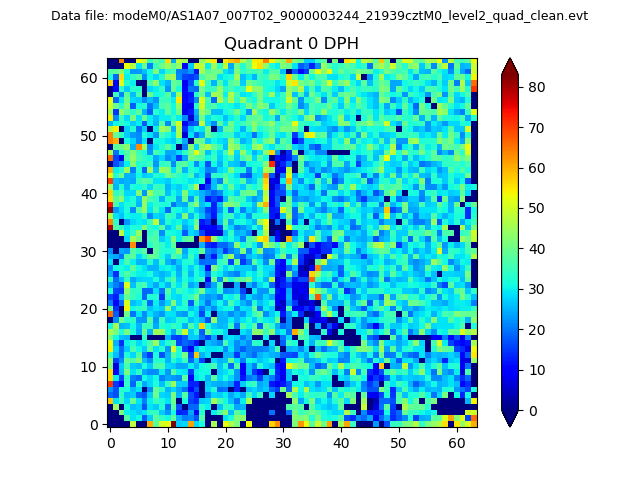 |
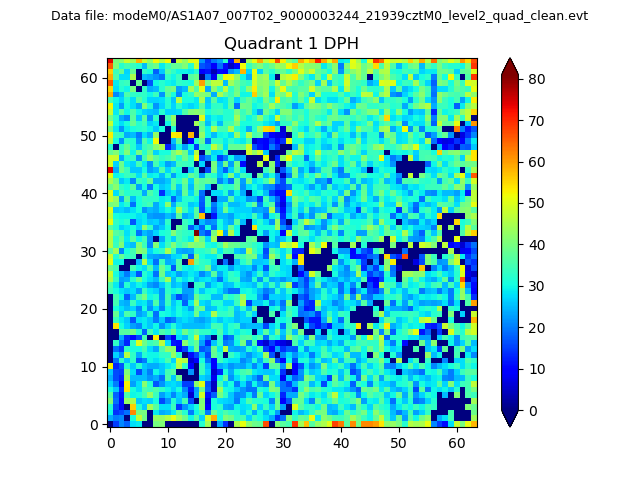 |
Quadrant B |
|---|---|---|---|
| Quadrant D |  |
 |
Quadrant C |
| Plot type | Count rate plots | Images |
|---|---|---|
| Comparison with Poisson distribution Blue bars denote a histogram of data divided into 1 sec bins. Red curve is a Poisson curve with rate = median count rate of data. |
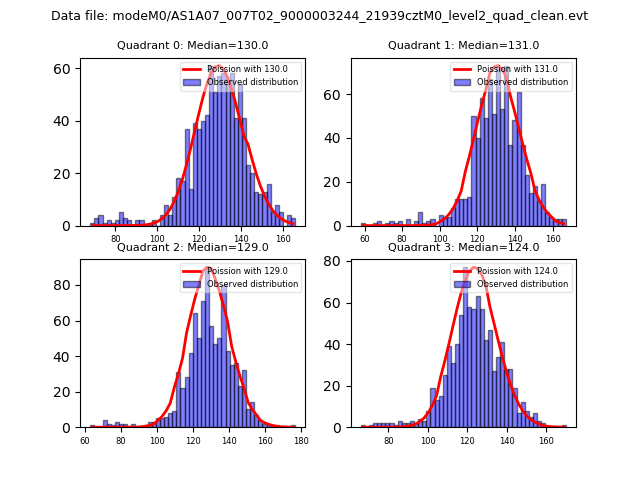 |
 |
| Quadrant-wise count rates Data is divided into 100 sec bins |
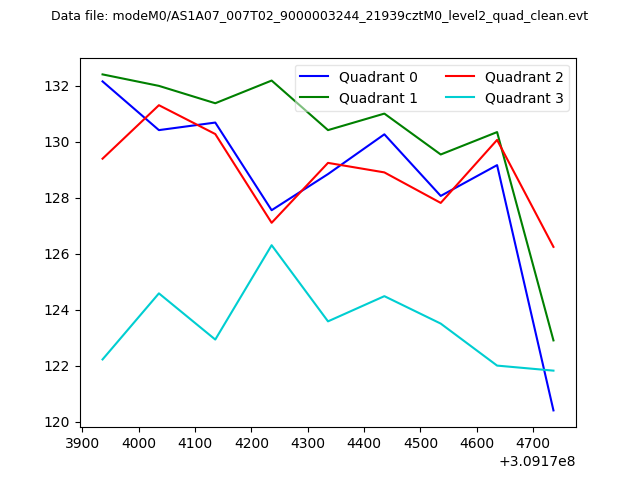 |
|
| Module-wise count rates for Quadrant A Data is divided into 100 sec bins |
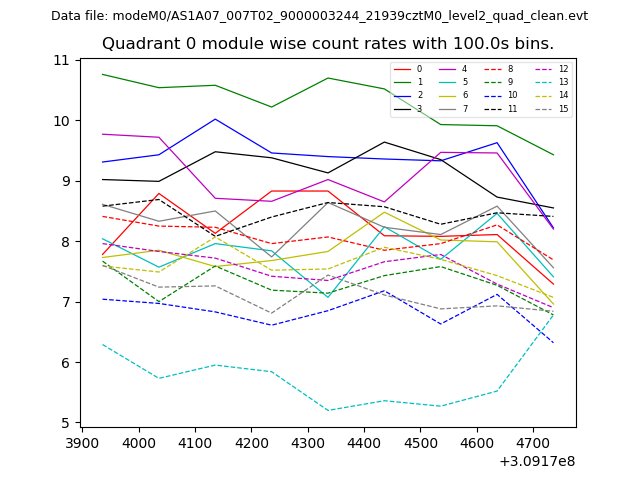 |
 |
| Module-wise count rates for Quadrant B Data is divided into 100 sec bins |
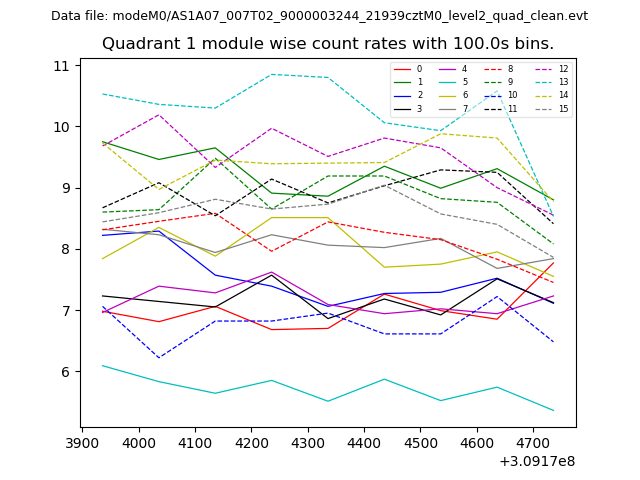 |
 |
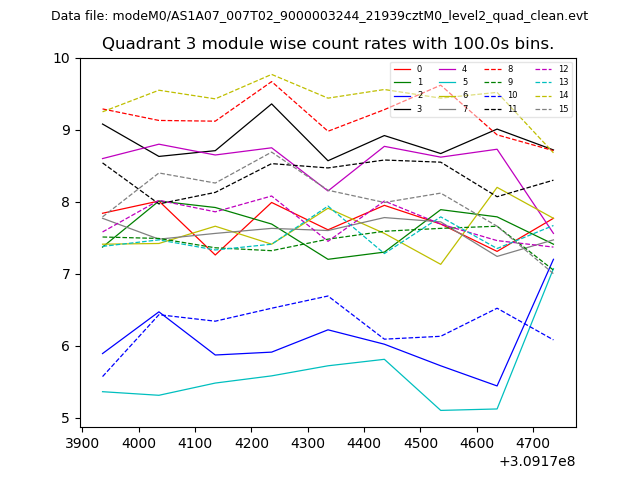
| Module-wise count rates for Quadrant C Data is divided into 100 sec bins |
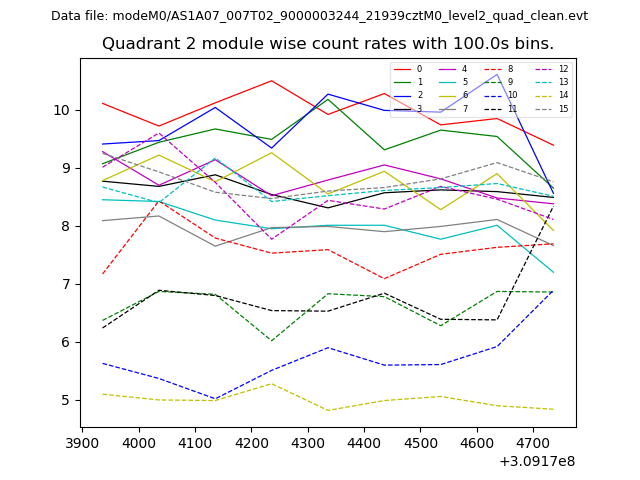 |
 |
| Module-wise count rates for Quadrant D Data is divided into 100 sec bins |
 |
 |
| Parameter | Plot |
|---|---|
| CZT HV Monitor | 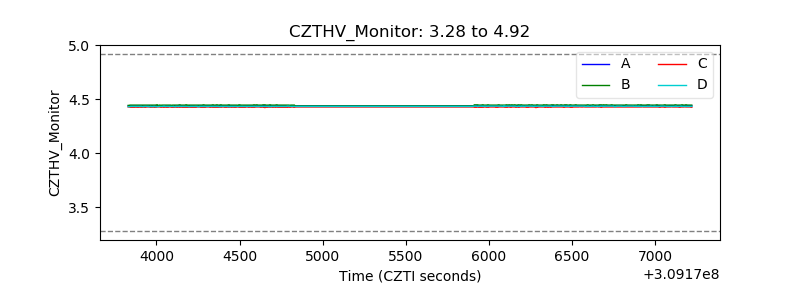 |
| D_VDD |  |
| Temperature 1 | 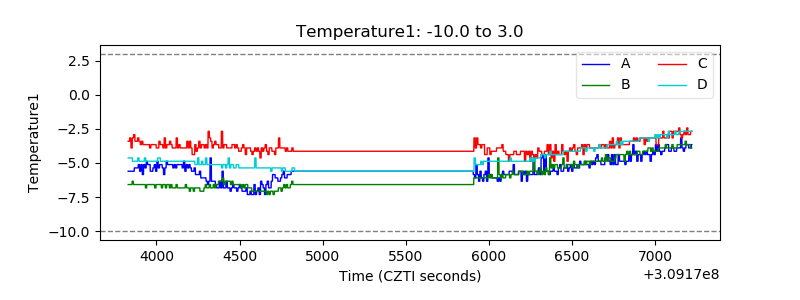 |
| Veto HV Monitor | 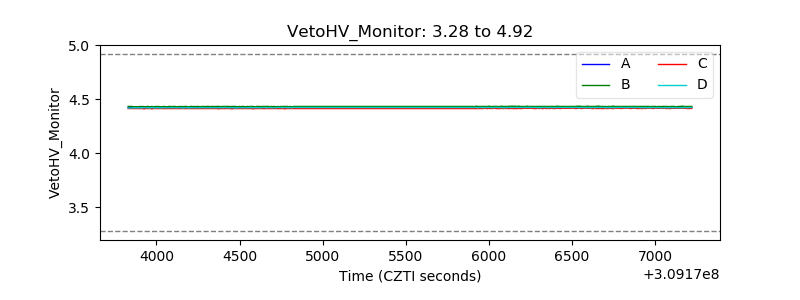 |
| Veto LLD | 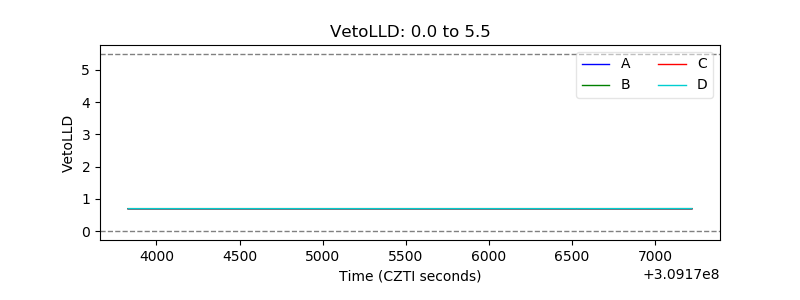 |
| Alpha Counter | 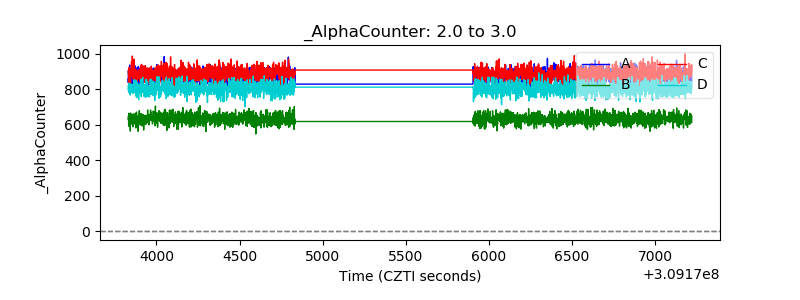 |
| _CPM_Rate | 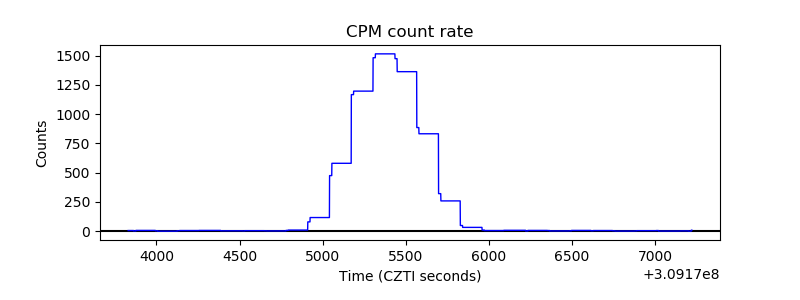 |
| CZT Counter |  |
| +2.5 Volts monitor |  |
| +5 Volts monitor | 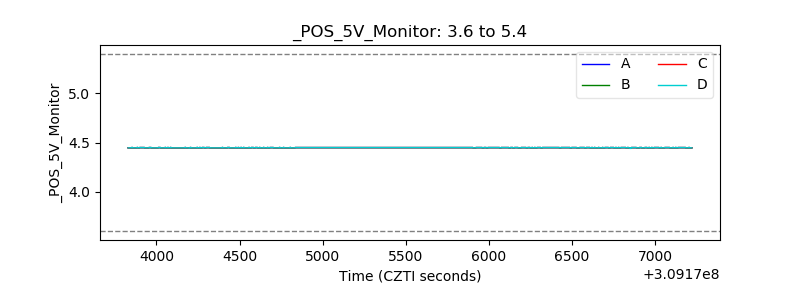 |
| _ROLL_ROT | 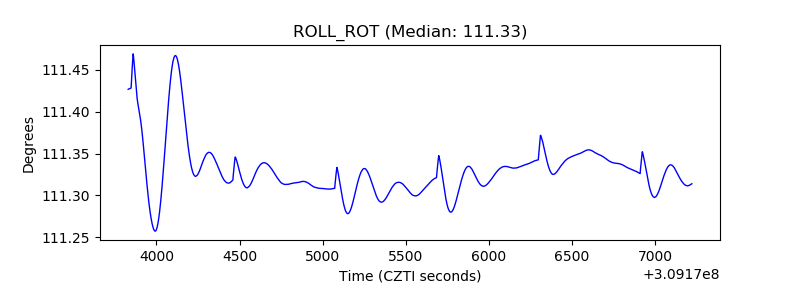 |
| _Roll_DEC | 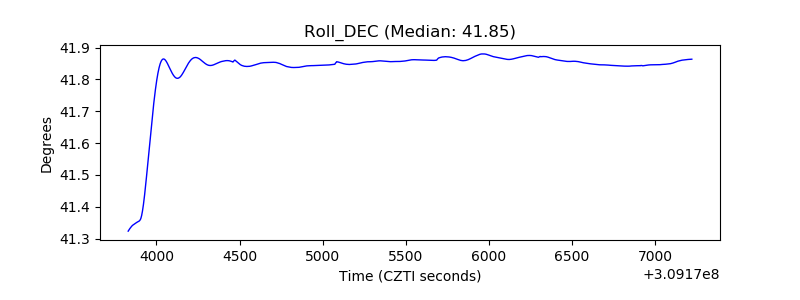 |
| _Roll_RA |  |
| Veto Counter | 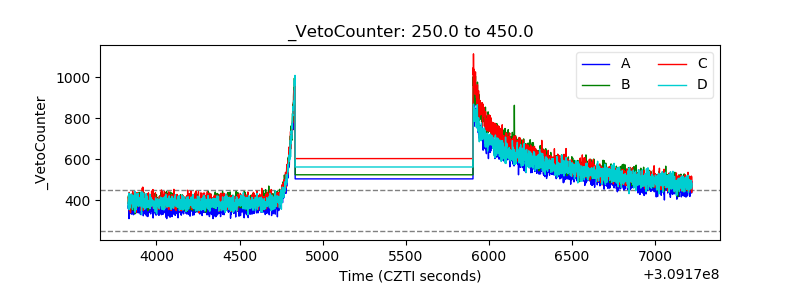 |