| Param | Original file | Final file |
|---|---|---|
| Filename | modeM0/AS1A07_007T02_9000003244_21941cztM0_level2.evt | modeM0/AS1A07_007T02_9000003244_21941cztM0_level2_quad_clean.evt |
| Size (bytes) | 553,763,520 | 96,264,000 |
| Size | 528.1 MB | 91.8 MB |
| Events in quadrant A | 3,672,126 | 621,469 |
| Events in quadrant B | 4,163,904 | 622,071 |
| Events in quadrant C | 3,661,540 | 603,187 |
| Events in quadrant D | 4,800,541 | 582,865 |
| Mode M0 | |||
|---|---|---|---|
| Quadrant | BADHDUFLAG | Total packets | Discarded packets |
| A | 0 | 15417 | 2 |
| B | 0 | 16902 | 2 |
| C | 0 | 15253 | 2 |
| D | 0 | 19208 | 2 |
| Mode M9 | |||
|---|---|---|---|
| Quadrant | BADHDUFLAG | Total packets | Discarded packets |
| A | 0 | 22 | 0 |
| B | 0 | 22 | 0 |
| C | 0 | 22 | 0 |
| D | 0 | 22 | 0 |
| Mode SS | |||
|---|---|---|---|
| Quadrant | BADHDUFLAG | Total packets | Discarded packets |
| A | 0 | 144 | 0 |
| B | 0 | 144 | 0 |
| C | 0 | 144 | 0 |
| D | 0 | 144 | 0 |
| Quadrant | Total seconds | Saturated seconds | Saturation percentage |
|---|---|---|---|
| A | 6969 | 132 | 1.894102% |
| B | 6970 | 262 | 3.758967% |
| C | 6970 | 160 | 2.295552% |
| D | 6970 | 186 | 2.668580% |
Noise dominated data is calculated using 1-second bins in cleaned event files. If a bin has >2000 counts, and if more than 50% of those come from <1% of pixels, then it is considered to be noise-dominated and hence unusable.
| Quadrant | # 1 sec bins | Bins with >0 counts | Bins with >2000 counts | High rate bins dominated by noise | Noise dominated (total time) | Noise dominated (detector-on time) | Marked lightcurve |
|---|---|---|---|---|---|---|---|
| A | 9229 | 6969 | 0 | 0 | 0.00% | 0.00% | 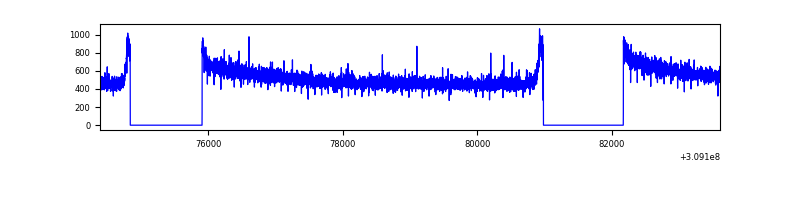 |
| B | 9230 | 6970 | 99 | 99 | 1.07% | 1.42% | 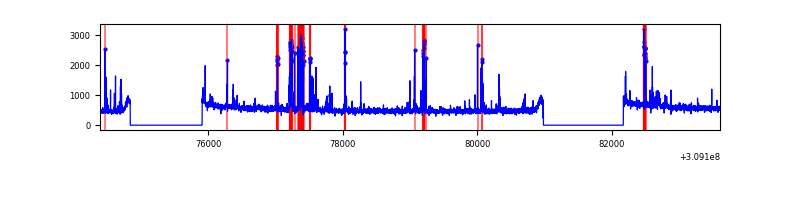 |
| C | 9230 | 6970 | 0 | 0 | 0.00% | 0.00% | 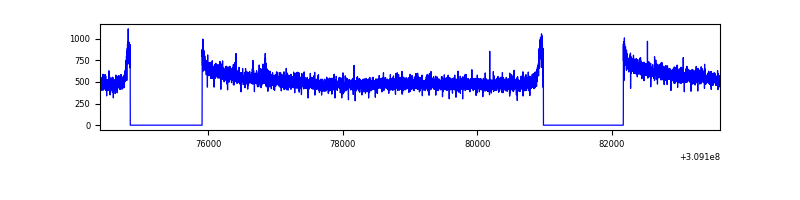 |
| D | 9230 | 6970 | 79 | 79 | 0.86% | 1.13% | 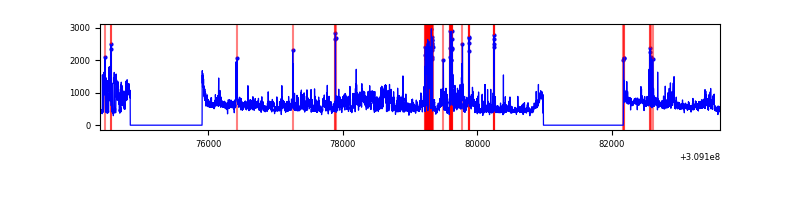 |
Top three noisy pixels from each quadrant. If the there are fewer than three noisy pixels in the level2.evt file, extra rows are filled as -1
| Pixel properties | Quadrant properties | ||||||
|---|---|---|---|---|---|---|---|
| Quadrant | DetID | PixID | Counts | Sigma | Mean | Median | Sigma |
| A | 13 | 254 | 10196 | 48.71 | 951 | 933 | 190.2 |
| A | 0 | 226 | 8181 | 38.12 | 951 | 933 | 190.2 |
| A | 3 | 137 | 7504 | 34.56 | 951 | 933 | 190.2 |
| B | 3 | 64 | 411357 | 2353.94 | 927 | 906 | 174.4 |
| B | 0 | 230 | 47693 | 268.32 | 927 | 906 | 174.4 |
| B | 4 | 216 | 43502 | 244.29 | 927 | 906 | 174.4 |
| C | 14 | 238 | 143799 | 686.85 | 900 | 907 | 208.0 |
| C | 10 | 22 | 7577 | 32.06 | 900 | 907 | 208.0 |
| C | 13 | 61 | 6111 | 25.01 | 900 | 907 | 208.0 |
| D | 12 | 235 | 810712 | 3691.79 | 914 | 888 | 219.4 |
| D | 1 | 52 | 407131 | 1851.96 | 914 | 888 | 219.4 |
| D | 11 | 176 | 109043 | 493.05 | 914 | 888 | 219.4 |
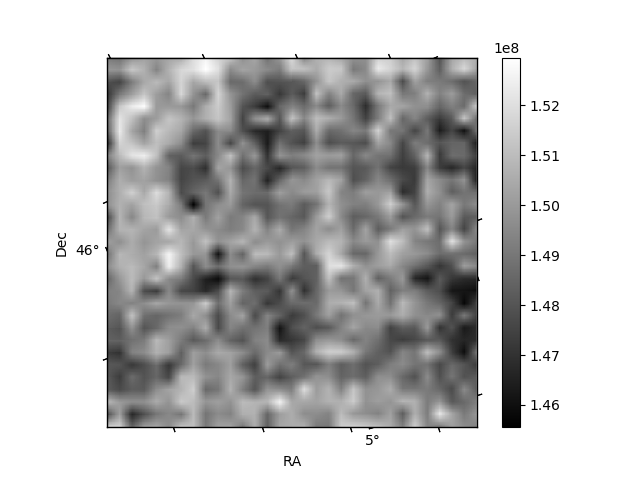
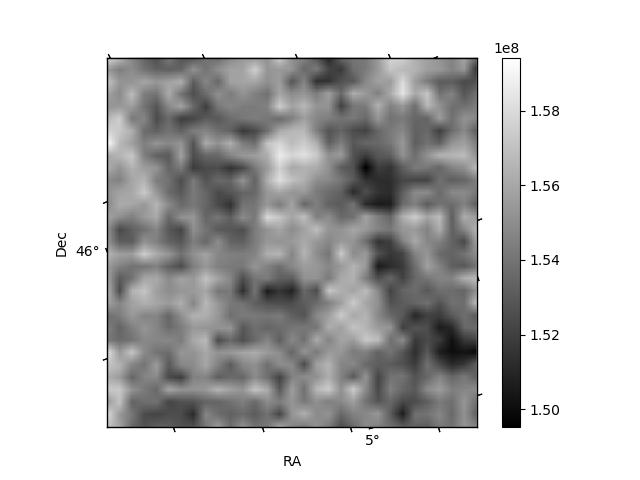
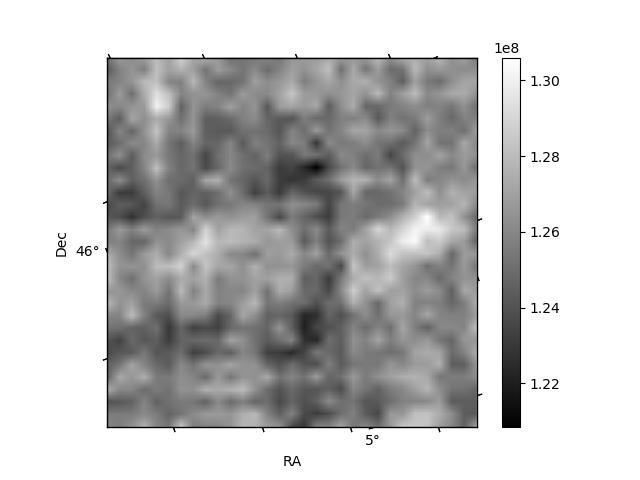
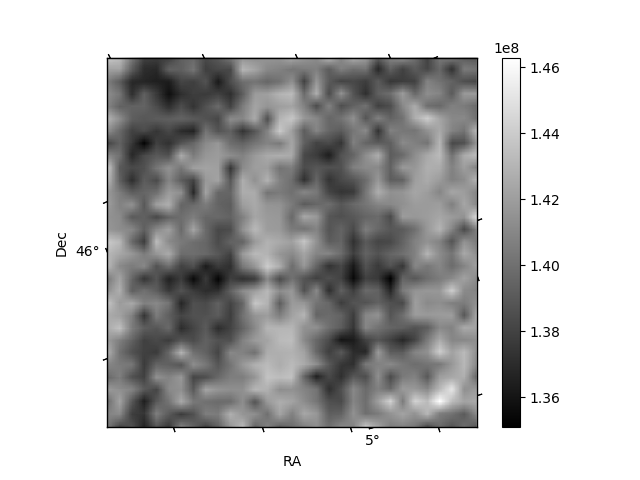
Histogram calculated using DETX and DETY for each event in the final _common_clean file
| Quadrant A | 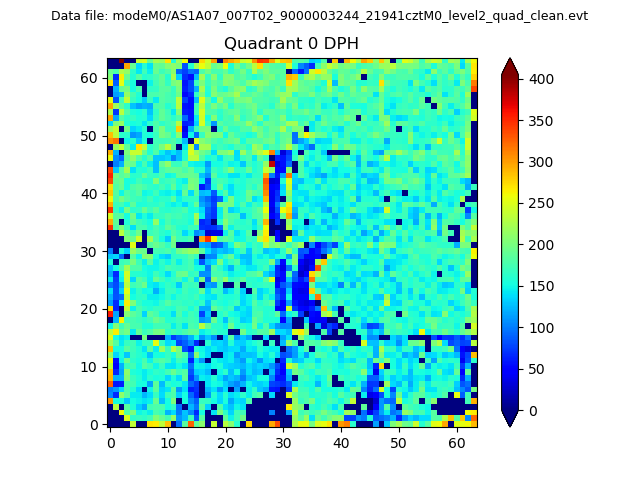 |
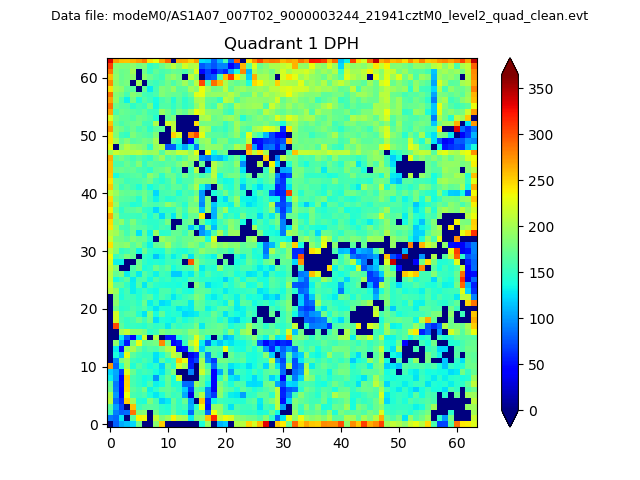 |
Quadrant B |
|---|---|---|---|
| Quadrant D | 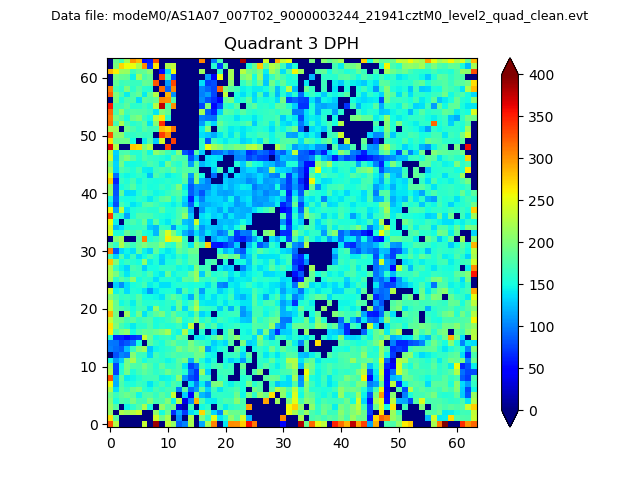 |
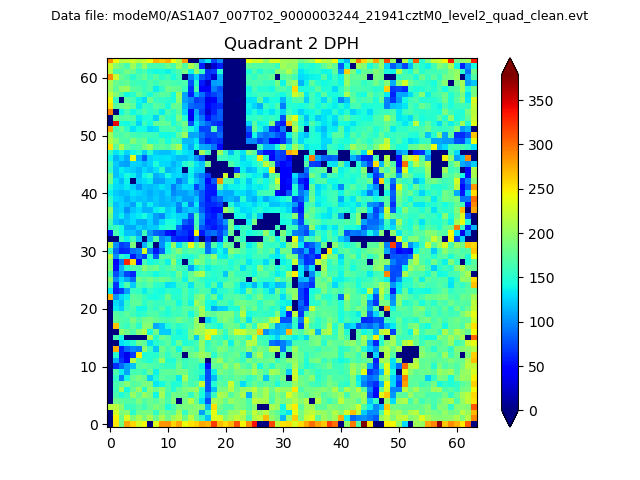 |
Quadrant C |
| Plot type | Count rate plots | Images |
|---|---|---|
| Comparison with Poisson distribution Blue bars denote a histogram of data divided into 1 sec bins. Red curve is a Poisson curve with rate = median count rate of data. |
 |
 |
| Quadrant-wise count rates Data is divided into 100 sec bins |
 |
|
| Module-wise count rates for Quadrant A Data is divided into 100 sec bins |
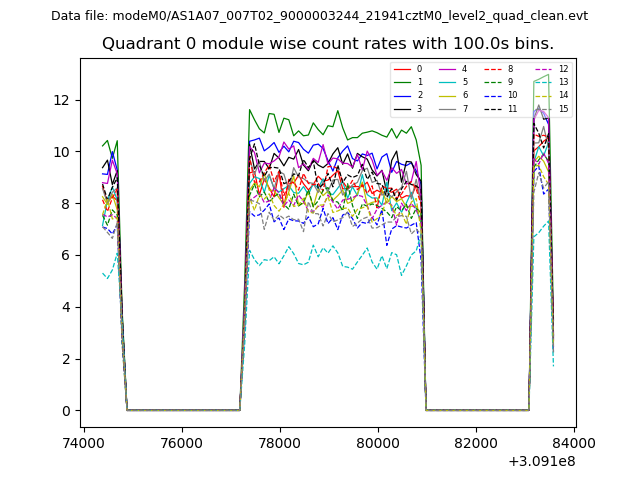 |
 |
| Module-wise count rates for Quadrant B Data is divided into 100 sec bins |
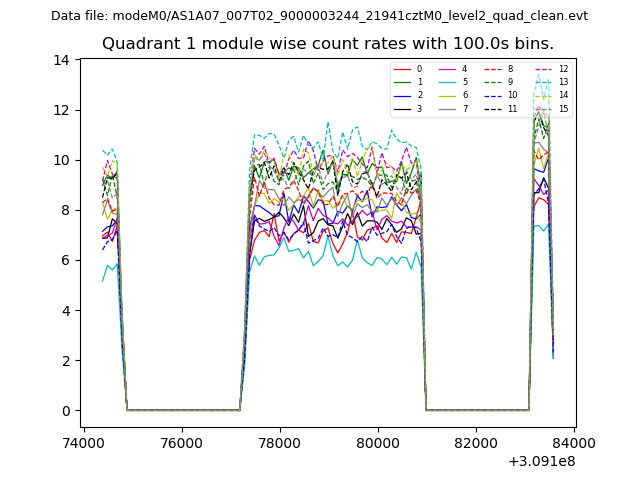 |
 |
| Module-wise count rates for Quadrant C Data is divided into 100 sec bins |
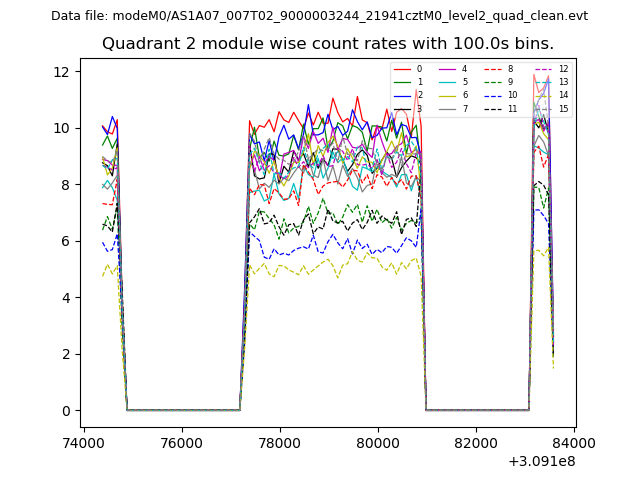 |
 |
| Module-wise count rates for Quadrant D Data is divided into 100 sec bins |
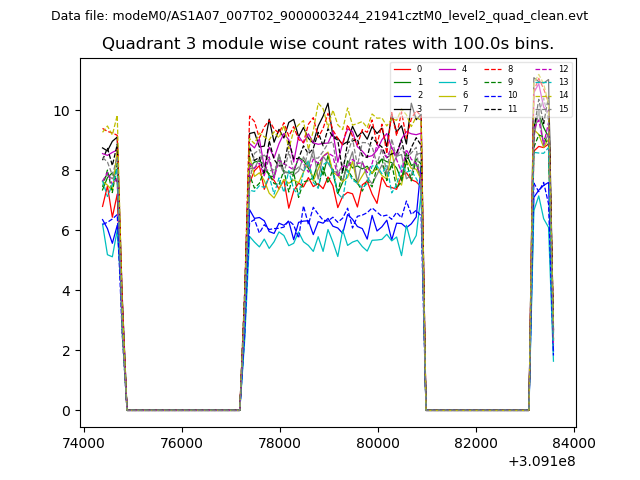 |
 |
| Parameter | Plot |
|---|---|
| CZT HV Monitor | 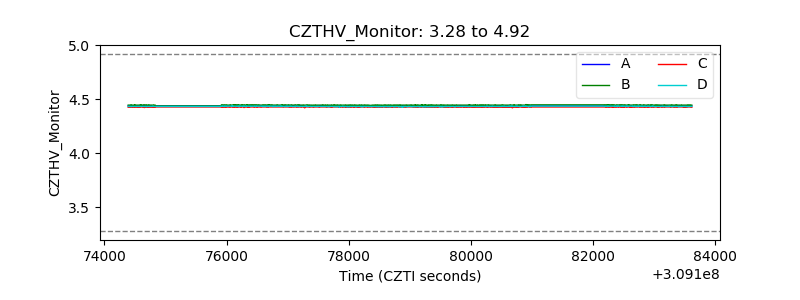 |
| D_VDD | 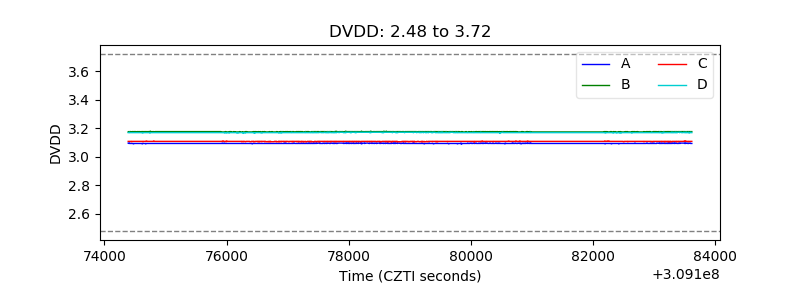 |
| Temperature 1 | 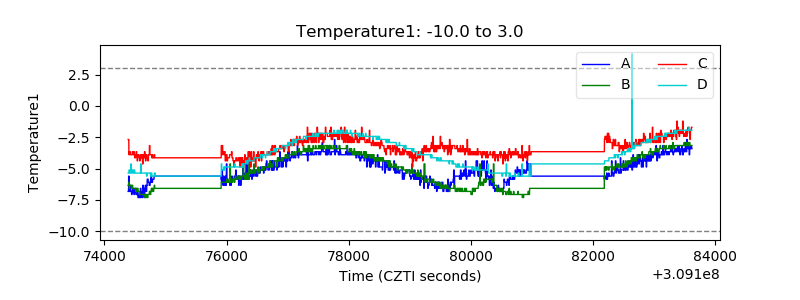 |
| Veto HV Monitor | 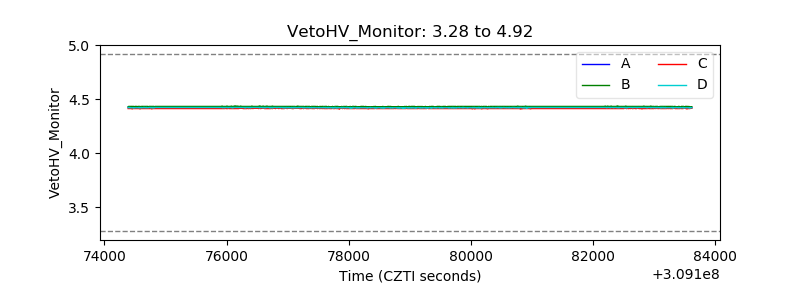 |
| Veto LLD | 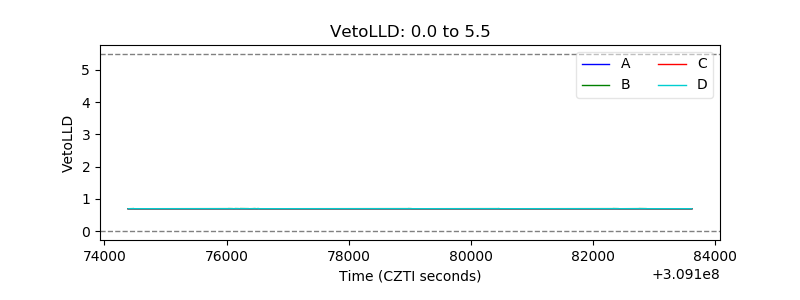 |
| Alpha Counter |  |
| _CPM_Rate | 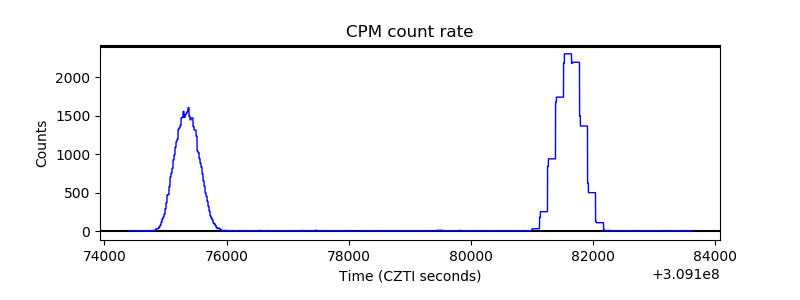 |
| CZT Counter |  |
| +2.5 Volts monitor |  |
| +5 Volts monitor |  |
| _ROLL_ROT | 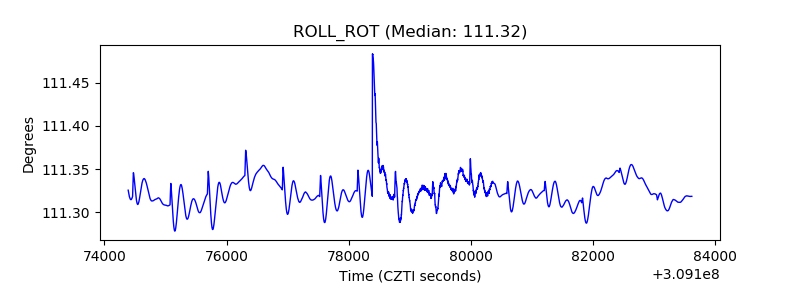 |
| _Roll_DEC | 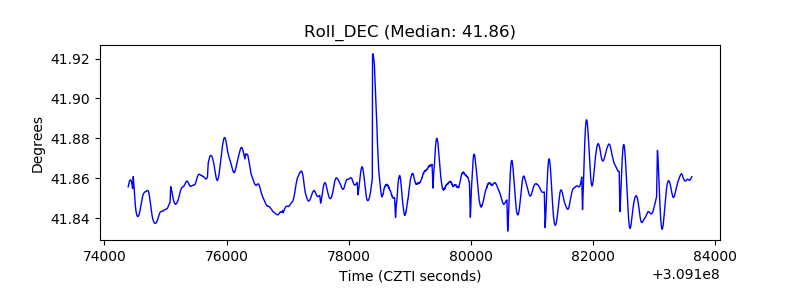 |
| _Roll_RA | 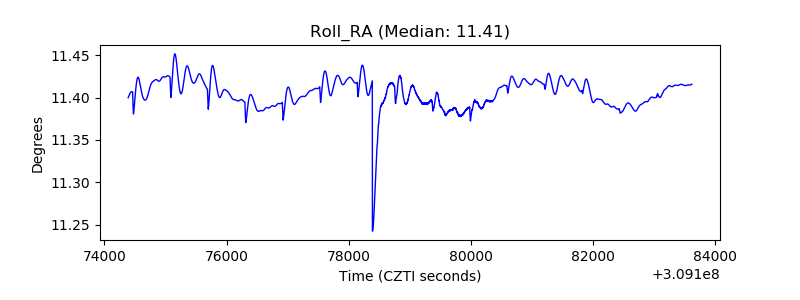 |
| Veto Counter | 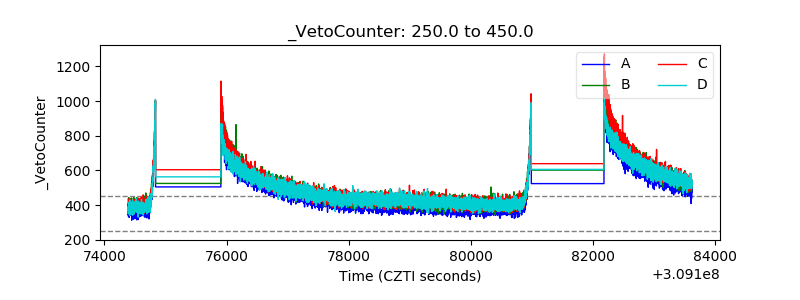 |